This section describes LCM dashboards and their roles in monitoring LCM operations.
The LCM dashboards and their monitoring roles include:
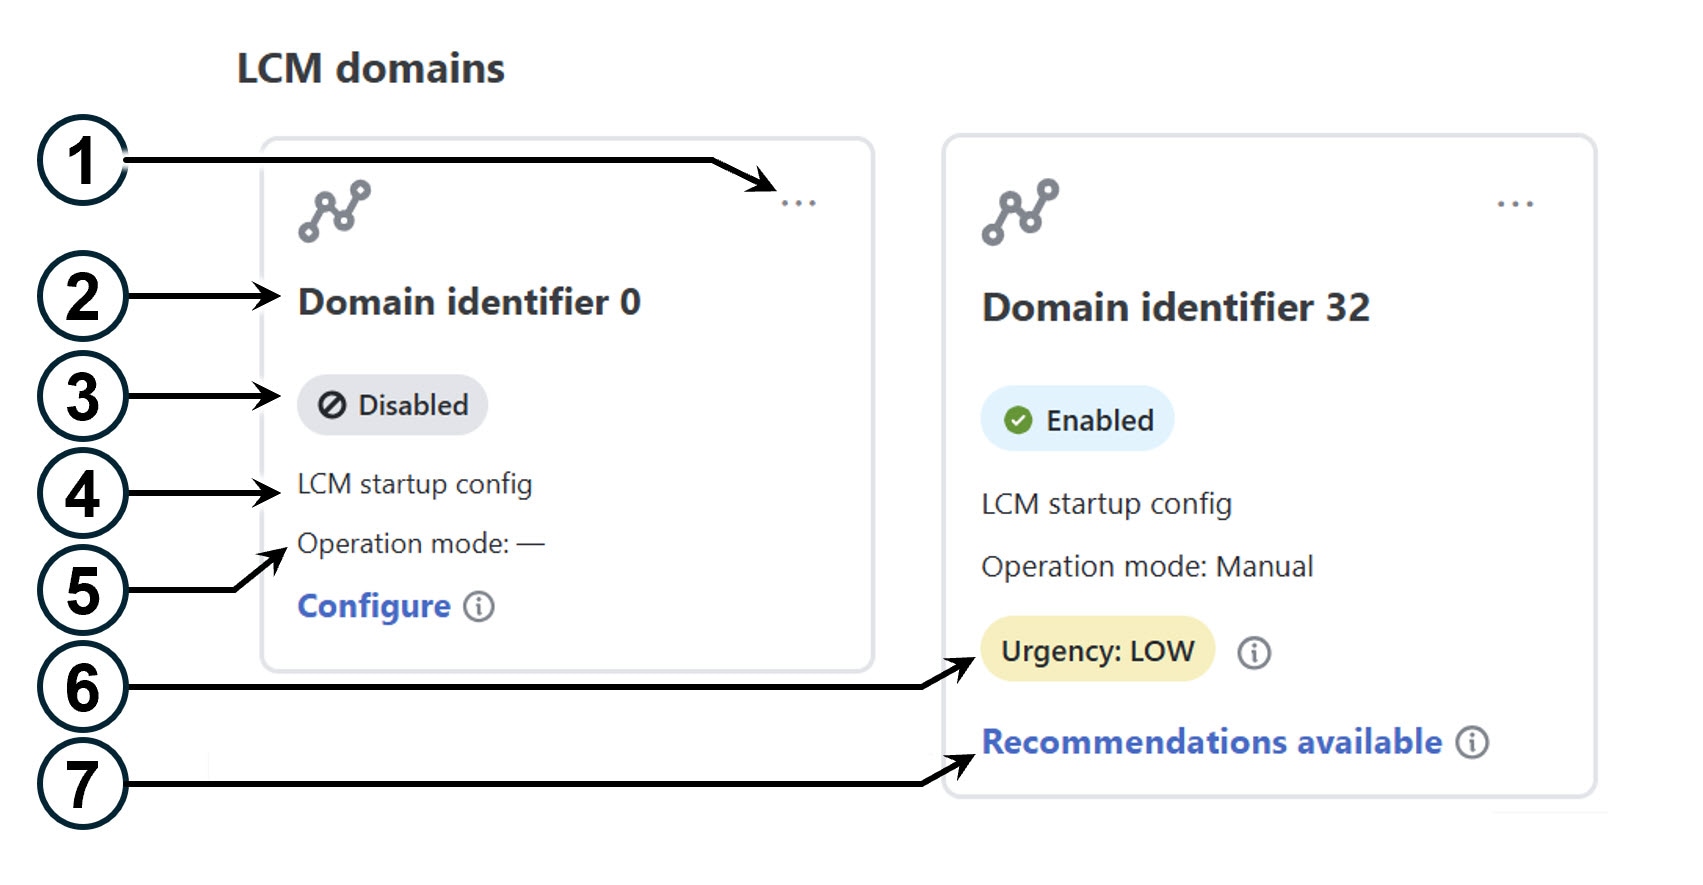
LCM domain dashboard: Displays all discovered domains with key information such as domain identifiers, LCM status, configuration descriptions, operation modes, and urgency levels. It also provides links to configure LCM if not set up and to view TTE policy recommendations when congestion is detected.
LCM operational dashboard: Displays congested interfaces based on configured utilization thresholds.
LCM operational history: Displays detailed, time-stamped snapshots after each key LCM event, such as evaluation, commit, pause or resume, and mitigated or degraded states, and provides a chronological, visual record of congestion management activities.
The LCM Domain dashboard (Services & Traffic Engineering > Local Congestion Mitigation) displays all the domains discovered by Crosswork Network Controller. A domain is an identifier assigned to an IGP process.
Domain identifier: The domain ID is taken from the router configuration (link-state instance-id) that is used to advertise IGP with BGP-LS.
3
LCM status: Indicates whether LCM is enabled for the domain or if the domain can be deleted.
4
LCM configuration description: The description is defined on the LCM Configuration page. The default description is "LCM startup config".
5
Operation mode: Indicates if LCM is running in Automatic or Manual mode. The default is Manual mode.
Automated mode—LCM automatically deploys TE tunnel recommendations based on thresholds that a user configures. Automated Mode is only supported on fully gRPC MSL compliant domains.
Manual mode—This option requires a user to view the LCM Operational Dashboard and decide whether to commit TE tunnel recommendations.
6
Urgency: Indicates the importance of the recommendation deployment or action.
Low: Indicates that LCM instantiated policies can be removed because they are no longer needed or that no changes are required.
Medium: Indicates new or modified recommendations.
High: Indicates network failures and recommendations should be deployed. This is a candidate that can be addressed automatically if the Auto repair solution advanced option was enabled. See Configure LCM.
Dormant: This status appears when the domain is inactive. LCM does not perform any operations on dormant domains.
7
Configure: This link appears if LCM has not yet been configured. Click Configure to go to the LCM Configuration page.
Recommendations available: This link appears if LCM has detected congestion and has TTE policy recommendations. To view LCM recommendations, click the link to go to the LCM operational dashboard.
Delete: Indicates that the domain card can be removed from LCM monitoring.
LCM operational dashboard
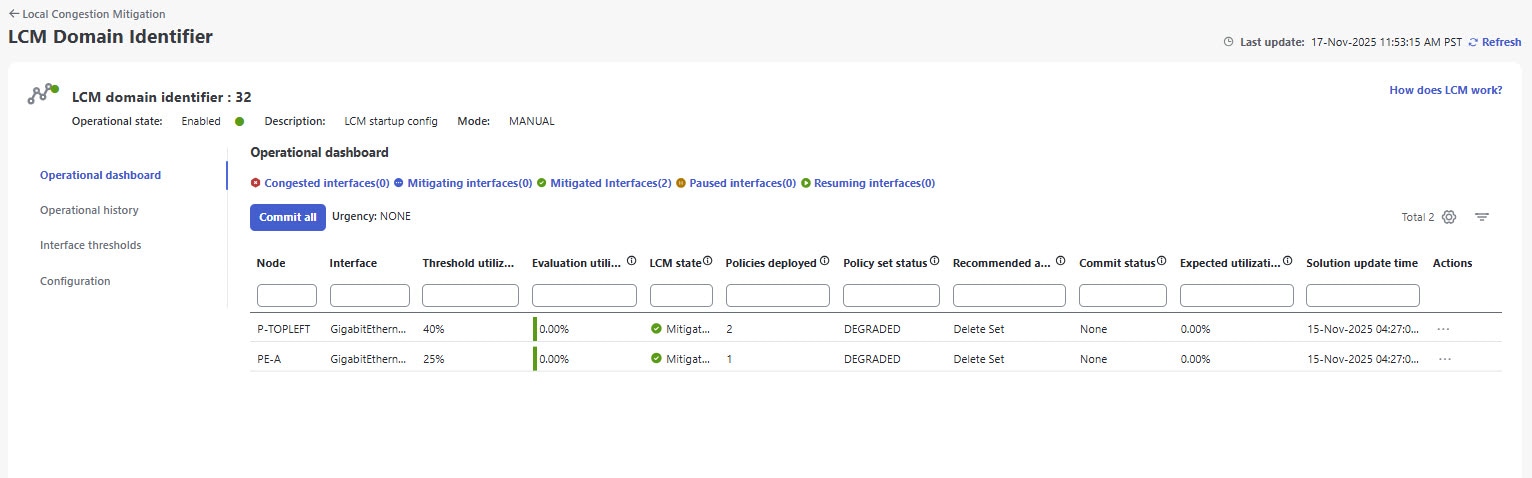
The LCM operational dashboard helps you preview the traffic engineering policies and path recommendations to mitigate congestion. Congested interfaces are those that exceed the configured utilization threshold.
Access LCM operational dashboard
To access LCM operational dashboard:
From the main menu, choose
Services & Traffic Engineering > Local Congestion Mitigation > Domain-ID > > Operational dashboard .
Figure 1. LCM operational dashboard
Each interface lists details such as current utilization, recommended action, status, expected utilization after committing recommendations, and so on.
Hover the mouse pointer over to view a description of the type of information each column provides. In the Actions column, you have these options:
Preview solution: This option opens the Recommended TTE policies preview page displaying the policies that LCM suggests for mitigating congestion. For headends that support MSL policies, you may see an MSL-based policy as a recommended solution.
View deployed policies: This option opens the Traffic Engineering - LCM deployed policy page displaying the various policies deployed to mitigate congestion. You can further click View details for each policy in the Actions menu to see the different paths and segments, along with detailed policy information.
Resume/Pause: Pause or resume an interface.
LCM states and dashboard behavior
Mitigated state: When LCM is in the Mitigated state, the dashboard displays the number of policies currently deployed to address previous congestion. It also provides recommended actions; for example, a "Delete Set" recommendation suggests removing these policies because congestion is no longer expected. The Commit status will show as None if the recommendation has not been committed, or Committed if it has been applied.
Congested state: When LCM detects congestion, the state changes to Congested. The dashboard shows recommended actions to remediate the congestion; for example, a "Create Set" recommendation advises deploying new policies. You can preview the new solution by selecting the Actions menu ( > Preview solution) before committing
Note
If LCM cannot find a solution (Recommended action - no solution), it may be due to constraints set in the LCM configuration. For more information, see Configure LCM.
Paused state: When LCM is in the Paused state, two events appear in the Operational history: one for the evaluation of policies for removal, and another for the commit of that removal. Similarly, when resuming policies, an evaluation event precedes the new commit event. If LCM is in a congestion check suspension interval, the operational history will display a resume event but will wait until the interval has passed before computing a new solution.
Recommendations are deployed as a set and require clicking Commit all to apply changes.
LCM operational history
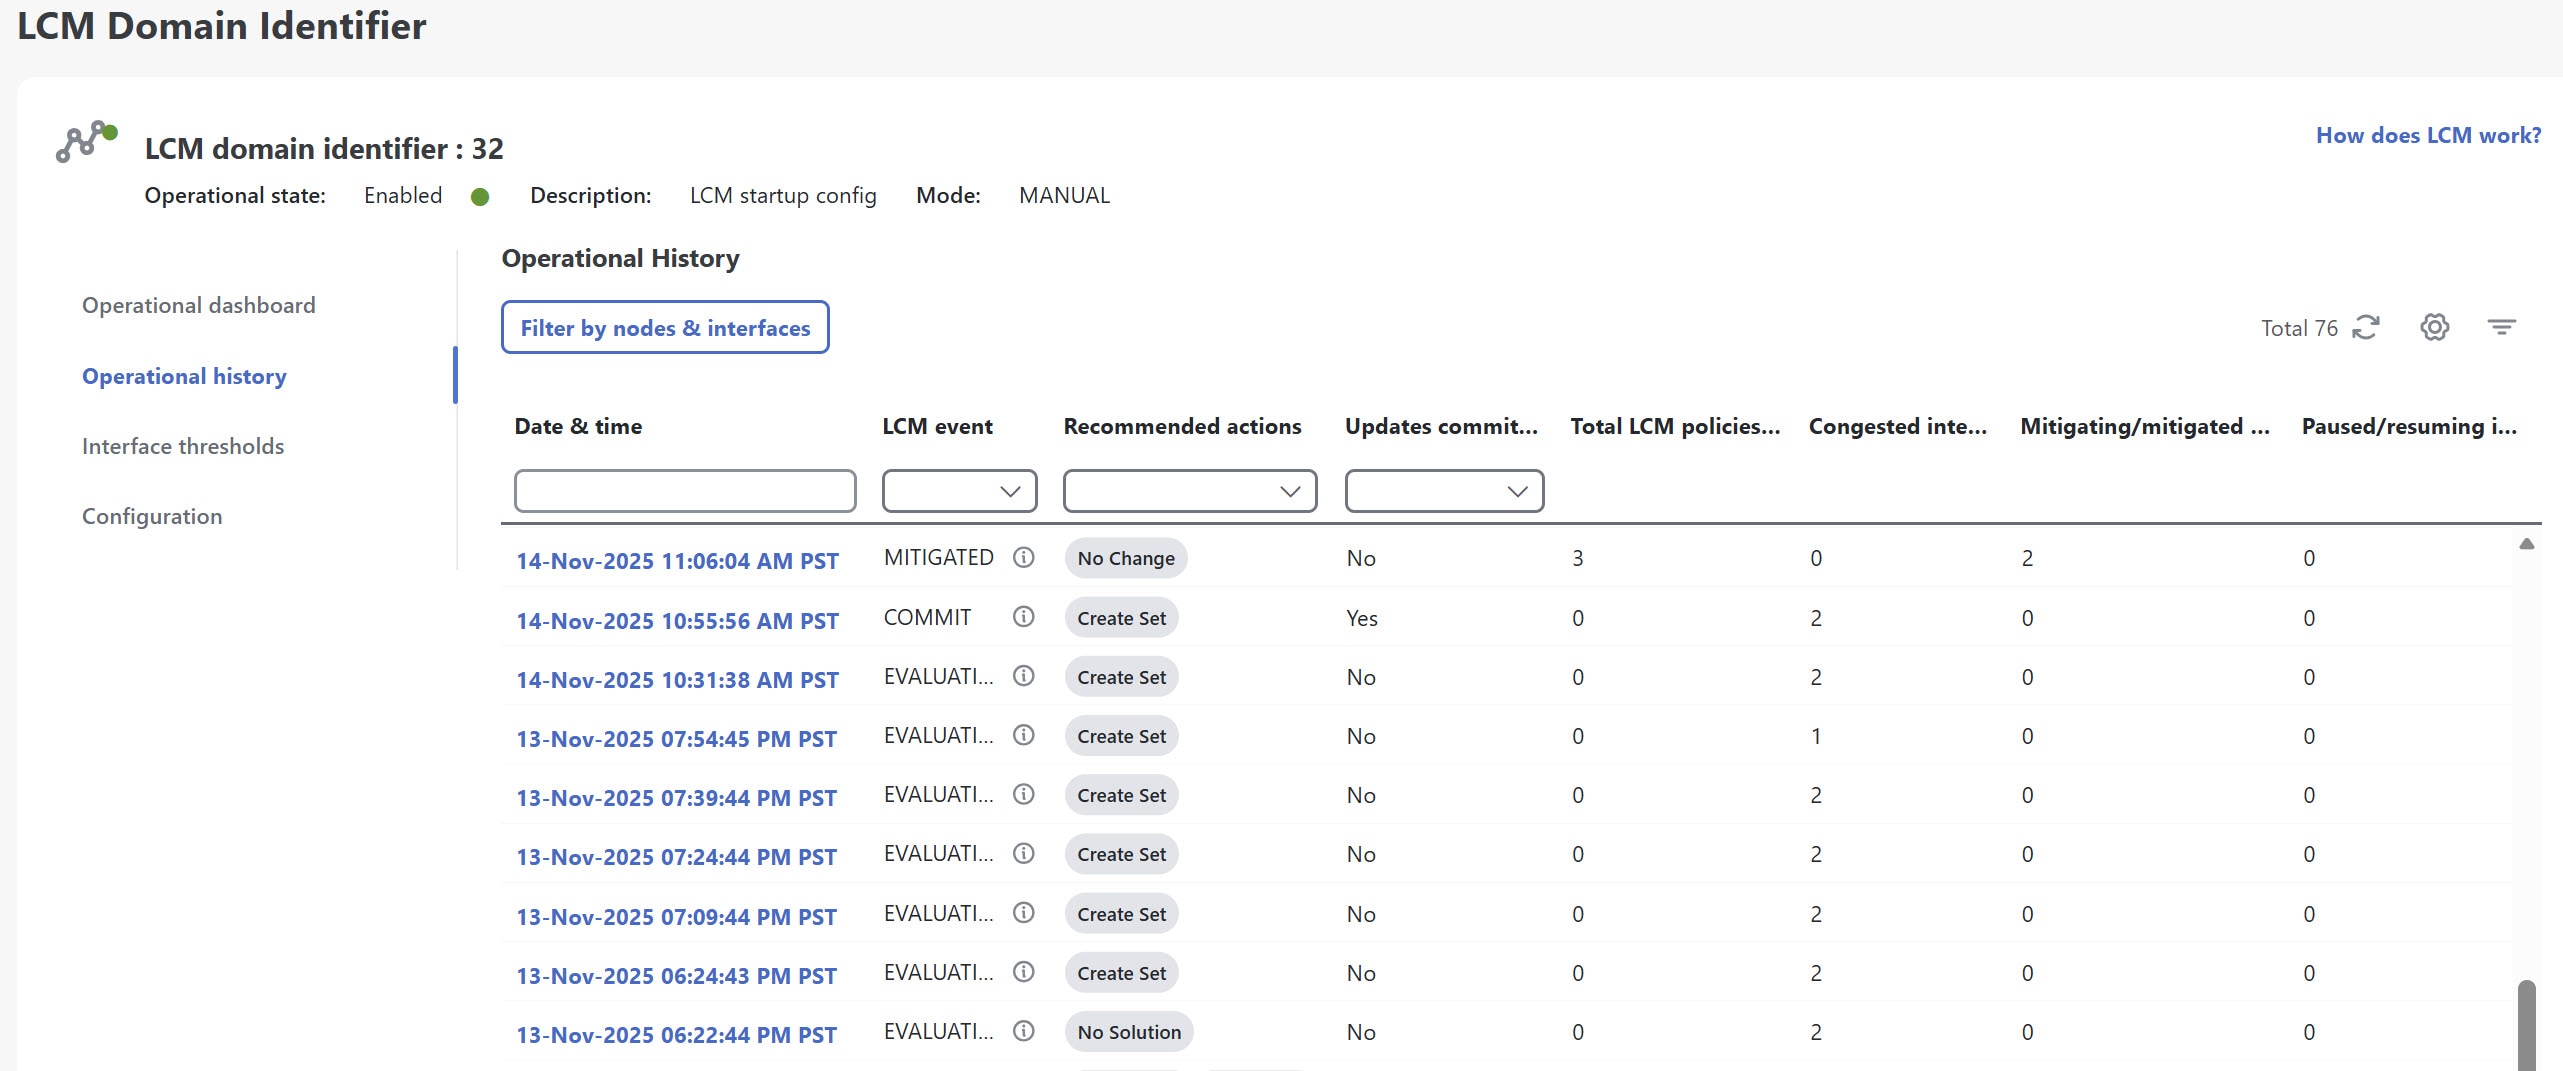
The LCM operational history provides a powerful way to review and analyze LCM historical actions within your network. Events are generated at key points: during evaluation, when policies are committed or removed, when interfaces are paused or resumed, and when congestion states change. By capturing detailed, time-stamped snapshots after every key LCM events, it offers a chronological, visual record of congestion management activities. You can filter the data by nodes and interfaces to quickly locate relevant events. Historical records are retained based on a configurable setting (default is 30 days). This history enables auditing, troubleshooting, and operational review by showing:
Date & time of each event
Type of LCM event (commit, degraded, evaluation, mitigated, pause, and resume)
Recommended actions or next steps based on the event outcome
Configuration updates committed indicating whether the recommended changes were deployed to the network
Total LCM policies deployed
Number of congested interfaces
Number of mitigating/mitigated interfaces
Number of paused/resuming interfaces
Filtering options to narrow down event list to specific nodes and interfaces.
Access LCM operational history
To view LCM operational history:
From the main menu, choose Services & Traffic Engineering > Local Congestion Mitigation > Domain-ID > > Operational history.
Figure 1. LCM operational history
The table rows show the operational history of LCM events. If an event is paused, it will remain in the paused state until there is user intervention. You can review paused policies in the operational dashboard and resume them as needed.
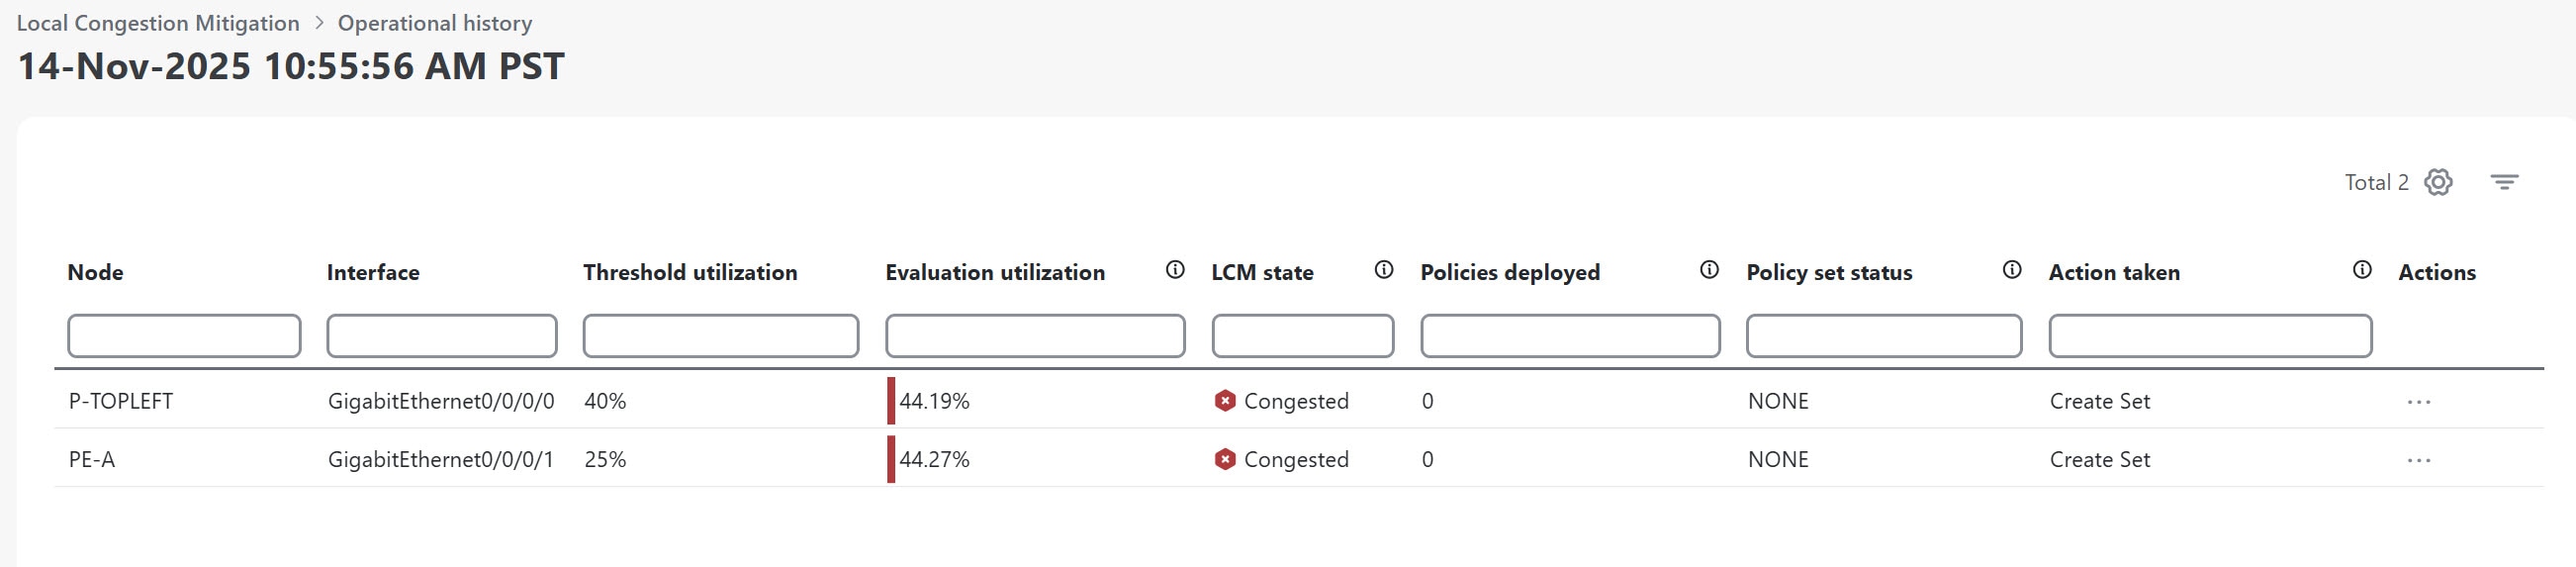
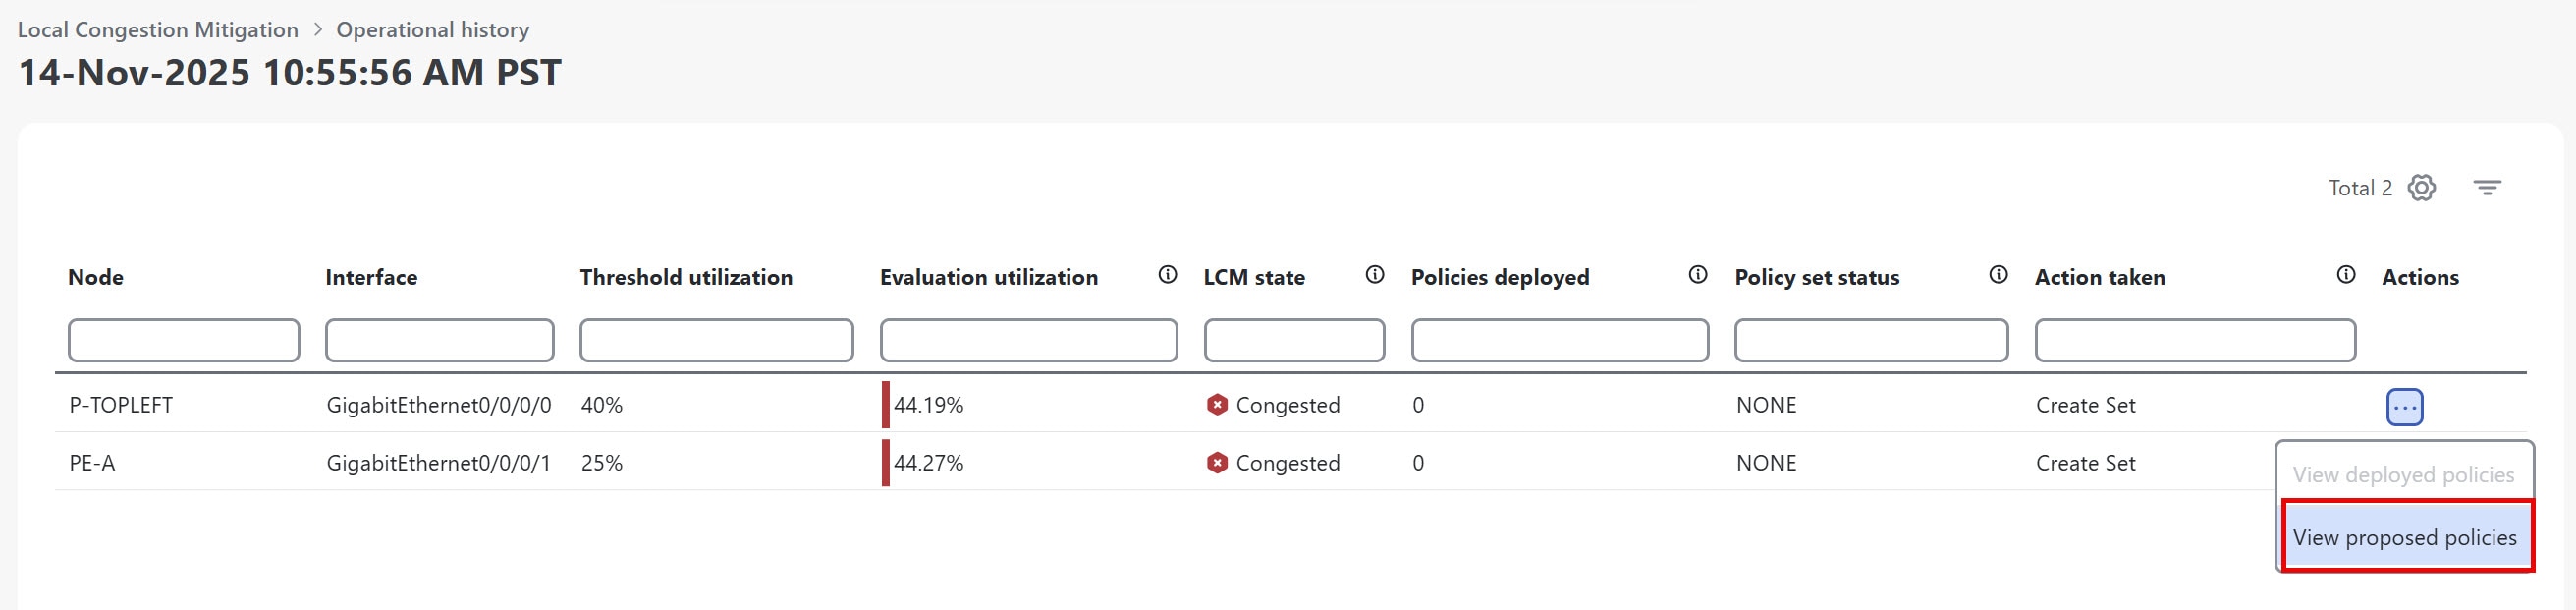
Cick on any event in the table to see what the dashboard looked like at that specific point in time and as a result of that event. To better understand the information provided by the LCM operational history, let's click on the second row event (14-Nov-2025 10:55:56 AM PST) in the image above. It opens event details, where you can see that the interfaces were congested at 44% utilization.
Figure 2. Operational history event snapshort
Click in the Actions column and select View proposed policies to visualize policies in a generated solution, giving you better insights of the past events.
Figure 3. Operational history event snapshort - actions
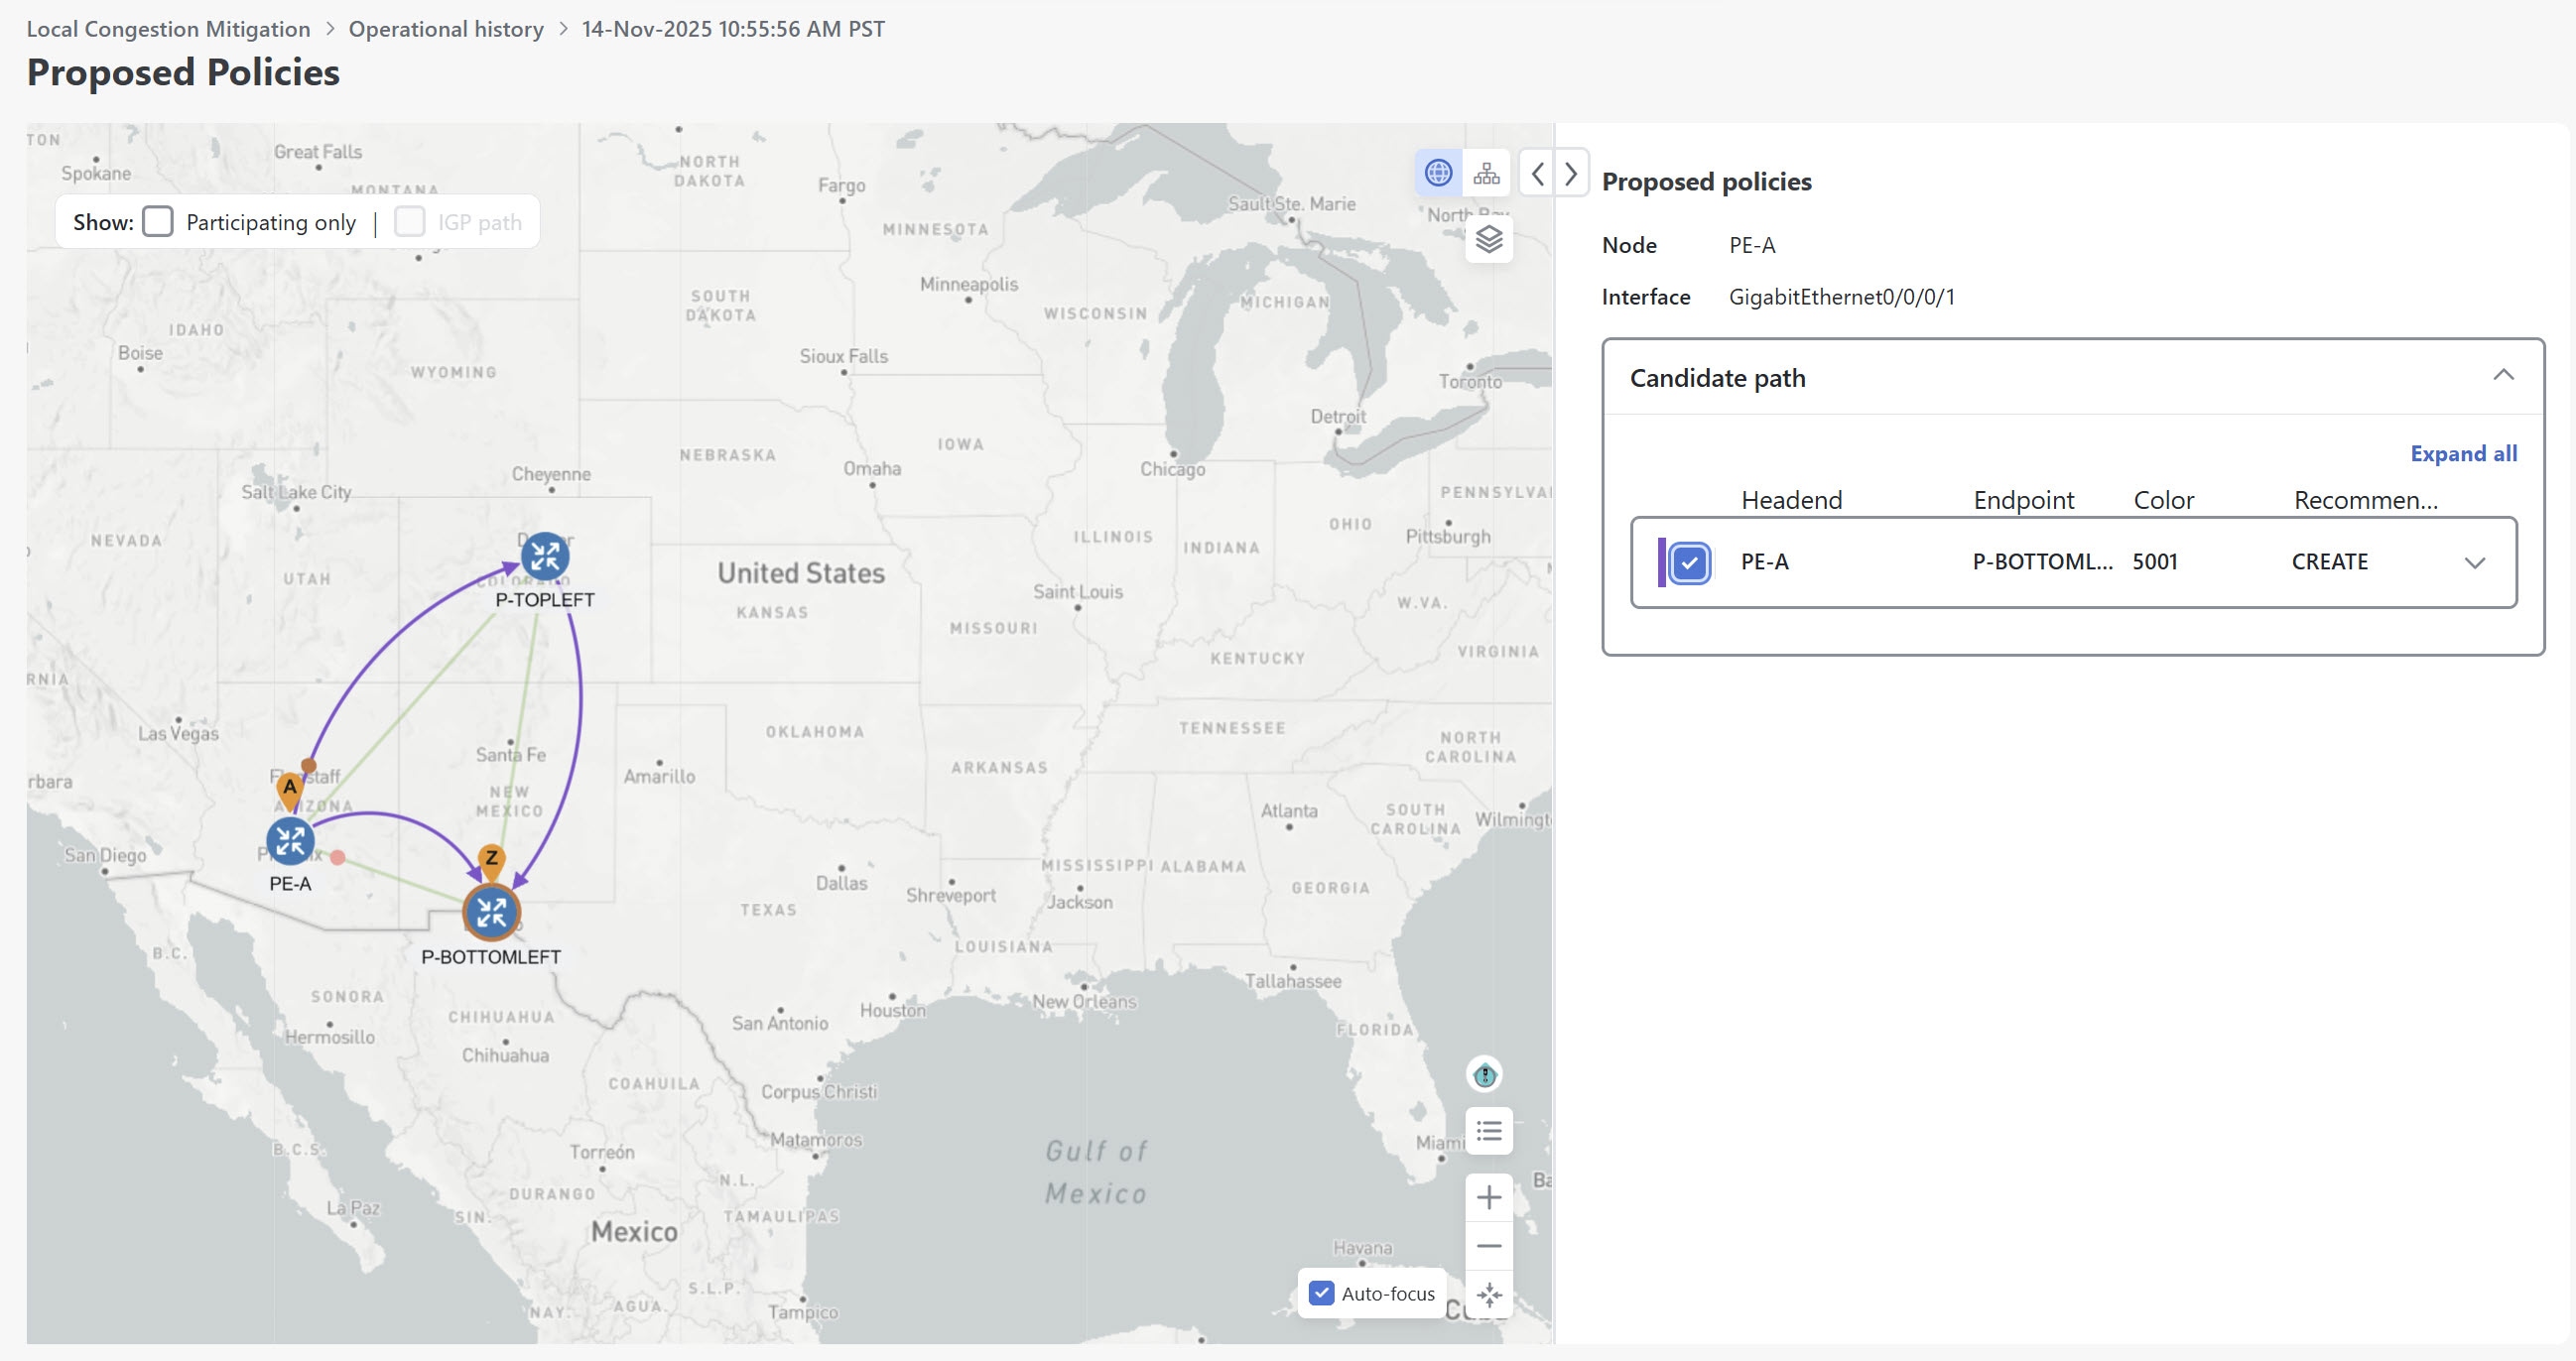
The Proposed policies page displays the policies that were proposed to mitigate congestion for that event.
Figure 4. Operational history event snapshort - proposed policies
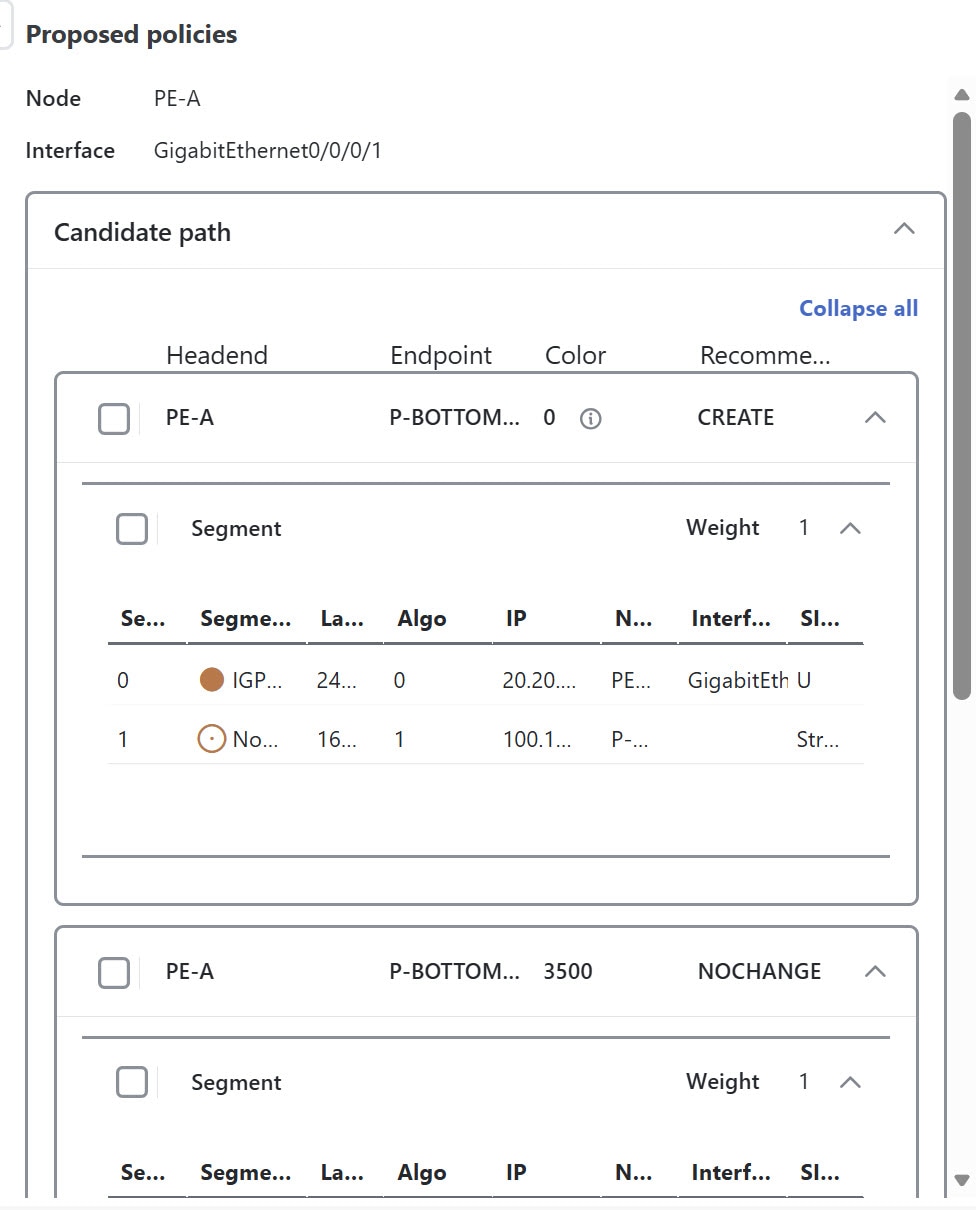
In the Candidate Path area, click Expand All to view the proposed policies along with segment list details. For headends that support MSL policies, you may see MSL-based policies as a proposed solution.
Figure 5. Proposed policy with multiple segment list
LCM solution events
The LCM generation of events are tied closely to the states of evaluation, user actions, and congestion check intervals.
Table 1. LCM solution events and descriptions
LCM event
Description
Evaluation
Indicates that a new recommendation is available, after LCM detects congestion and computes mitigation policies. At this stage, you can pause or commit the solution.
Once the congestion check suspension interval has passed, depending on the action taken, the state will change to either mitigated if congestion is resolved, or degraded if issues persist.
Note
Policy preview colors may change after commit.
Commit
Indicates that the recommendations has been committed (deployed) to mitigate congestion.
Note
Policy preview colors may change if used by another policy.
Degraded
Indicates that the mitigation solution has not fully resolved congestion on the interface, or that congestion has worsened despite the committed policies.
Mitigated
Indicates that the committed recommendation has successfully resolved congestion after the congestion check suspension interval has passed. The interface is no longer congested.
Pause
Indicates that a request to pause the solution has been received. The interface is temporarily excluded from mitigation calculations.
Pausing triggers two events in operational history: one indicating the evaluation of the policies for removal, and another for the commit of that removal. LCM waits until the congestion check suspension interval has passed before computing the solution. The user can later resume the interface, which also generates a resume event.
Resume
Indicates that a request to resume the solution has been received. The interface is re-included in mitigation calculations. In the Operational history, you will see an evaluation event preceding the commit event. If LCM is in a congestion check suspension interval, the operational history will display a resume event but will wait until the interval has passed before computing the solution.