Monitor Network Performance

Dashboard network statistics

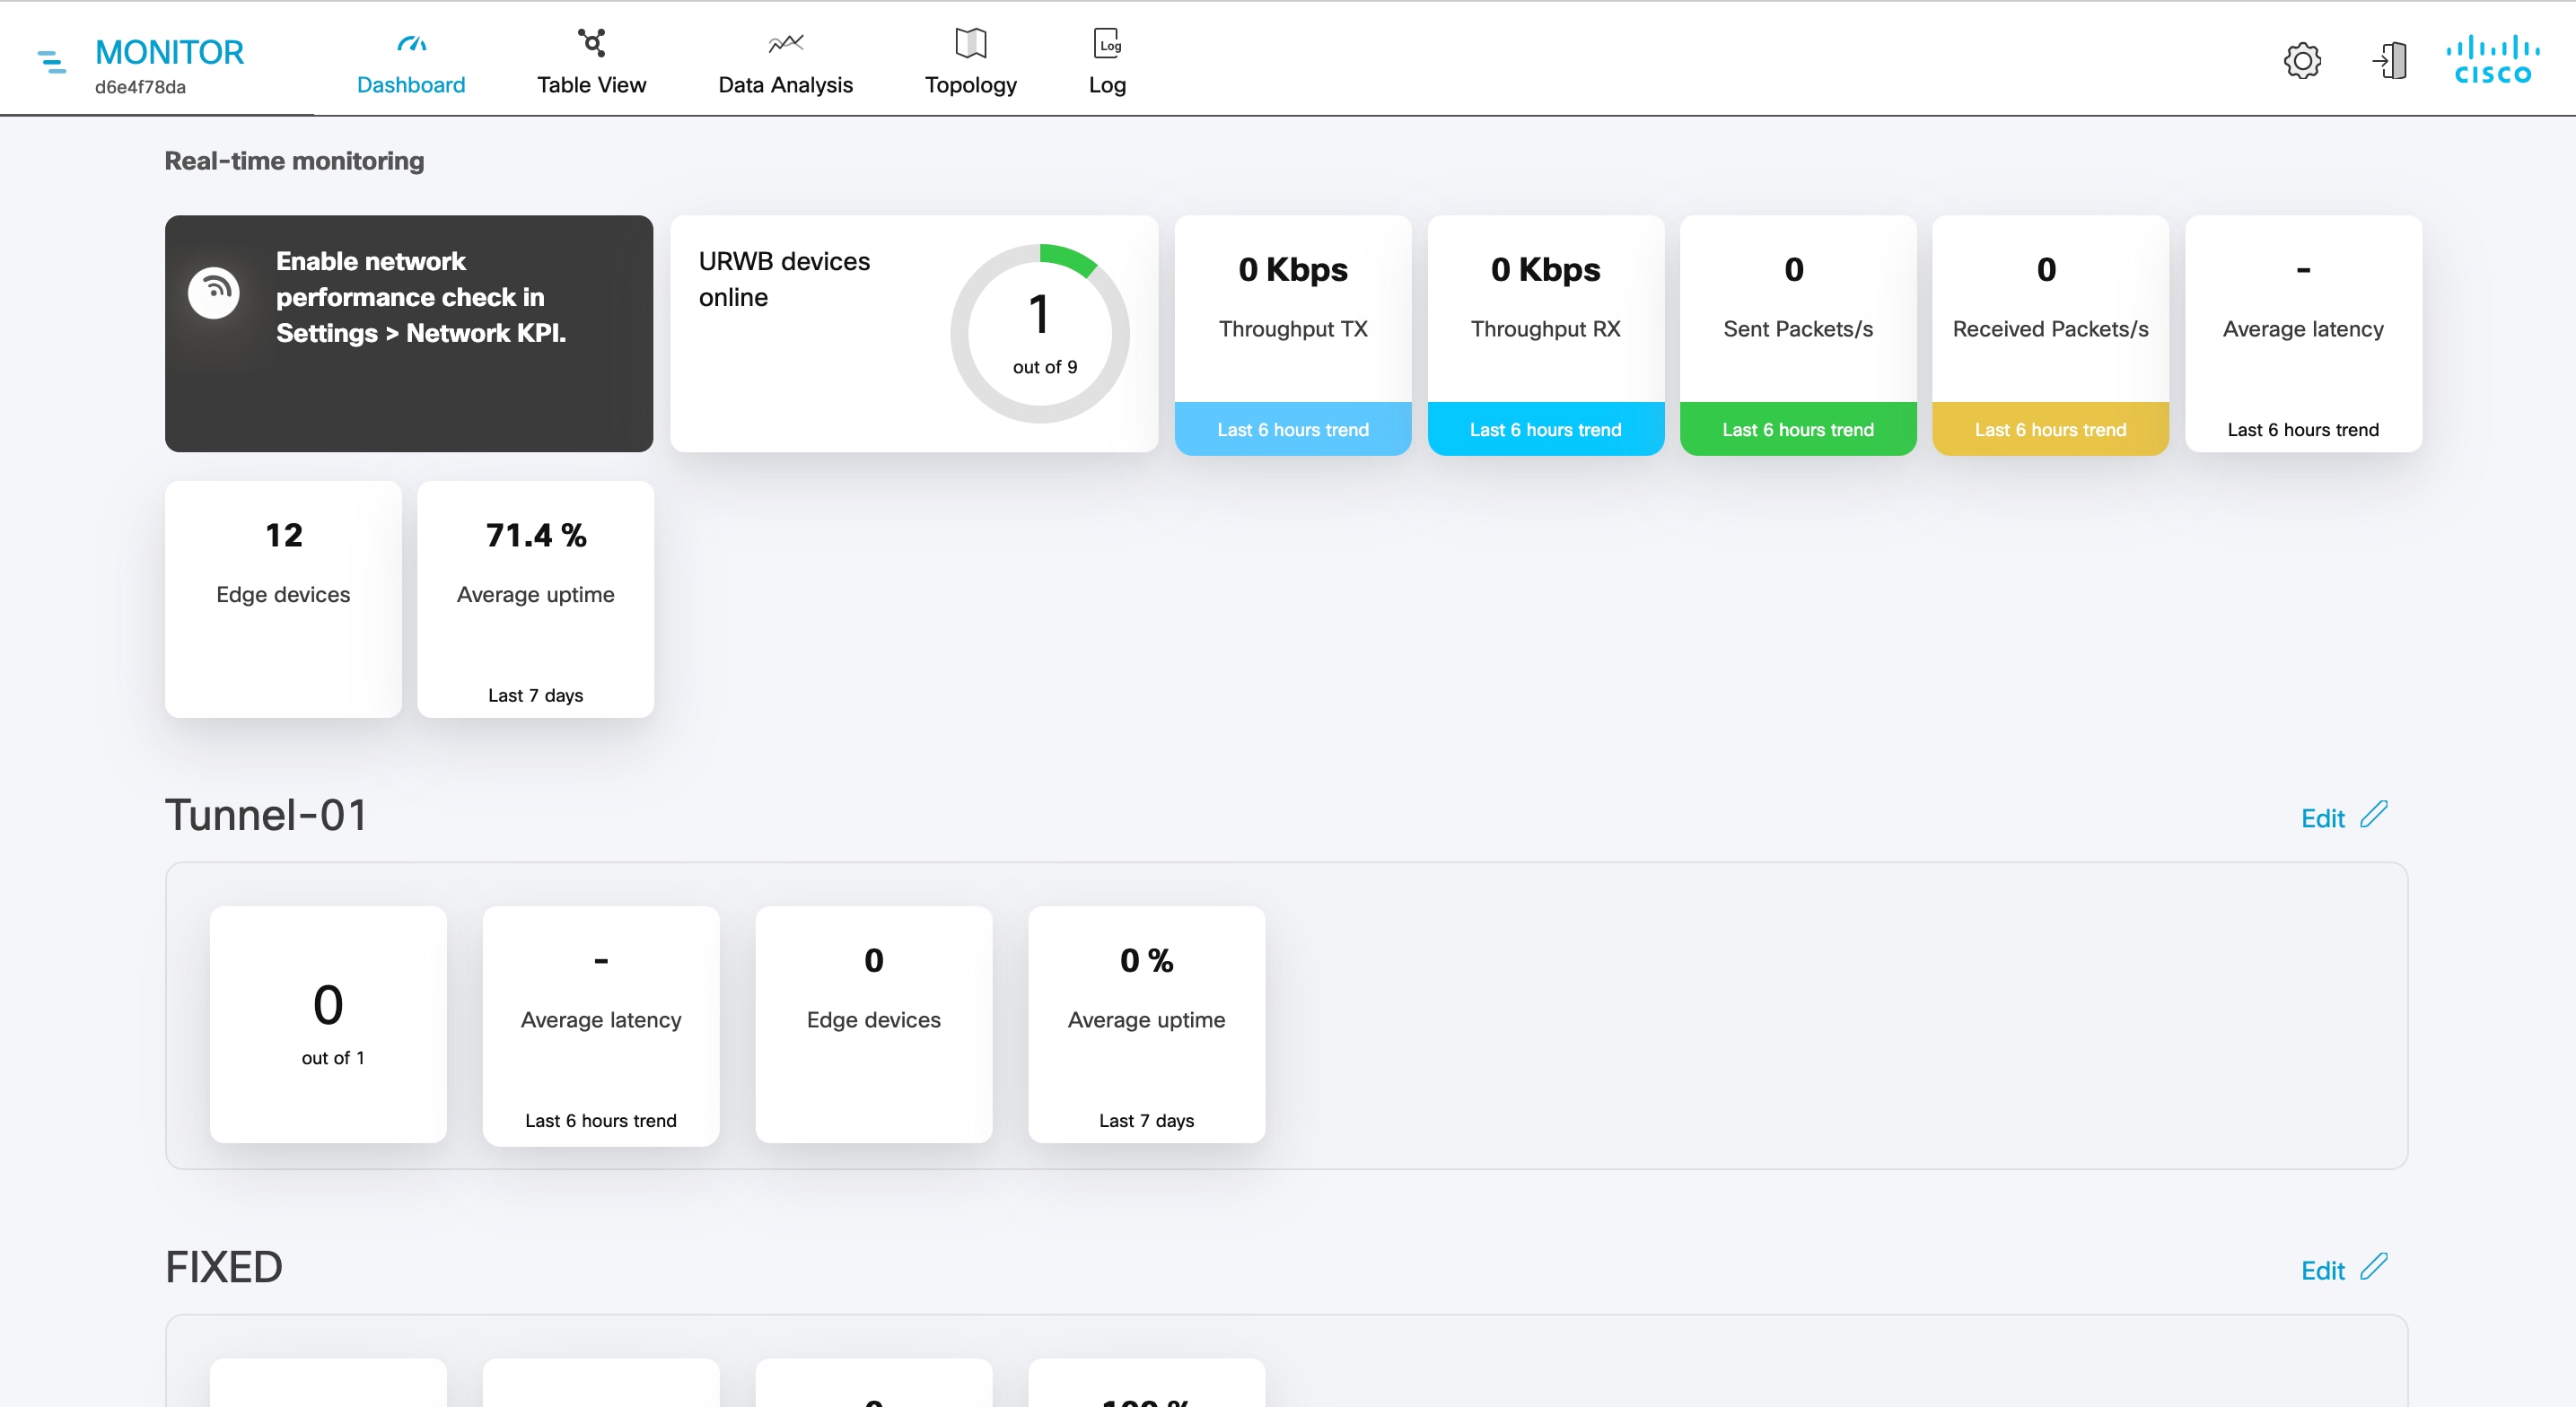
The network statistics view is a real-time monitoring interface that displays the performance and operating parameters of devices across different network sections.

  • Shows the number of devices currently connected to IW Monitor, compared to the total associated devices.

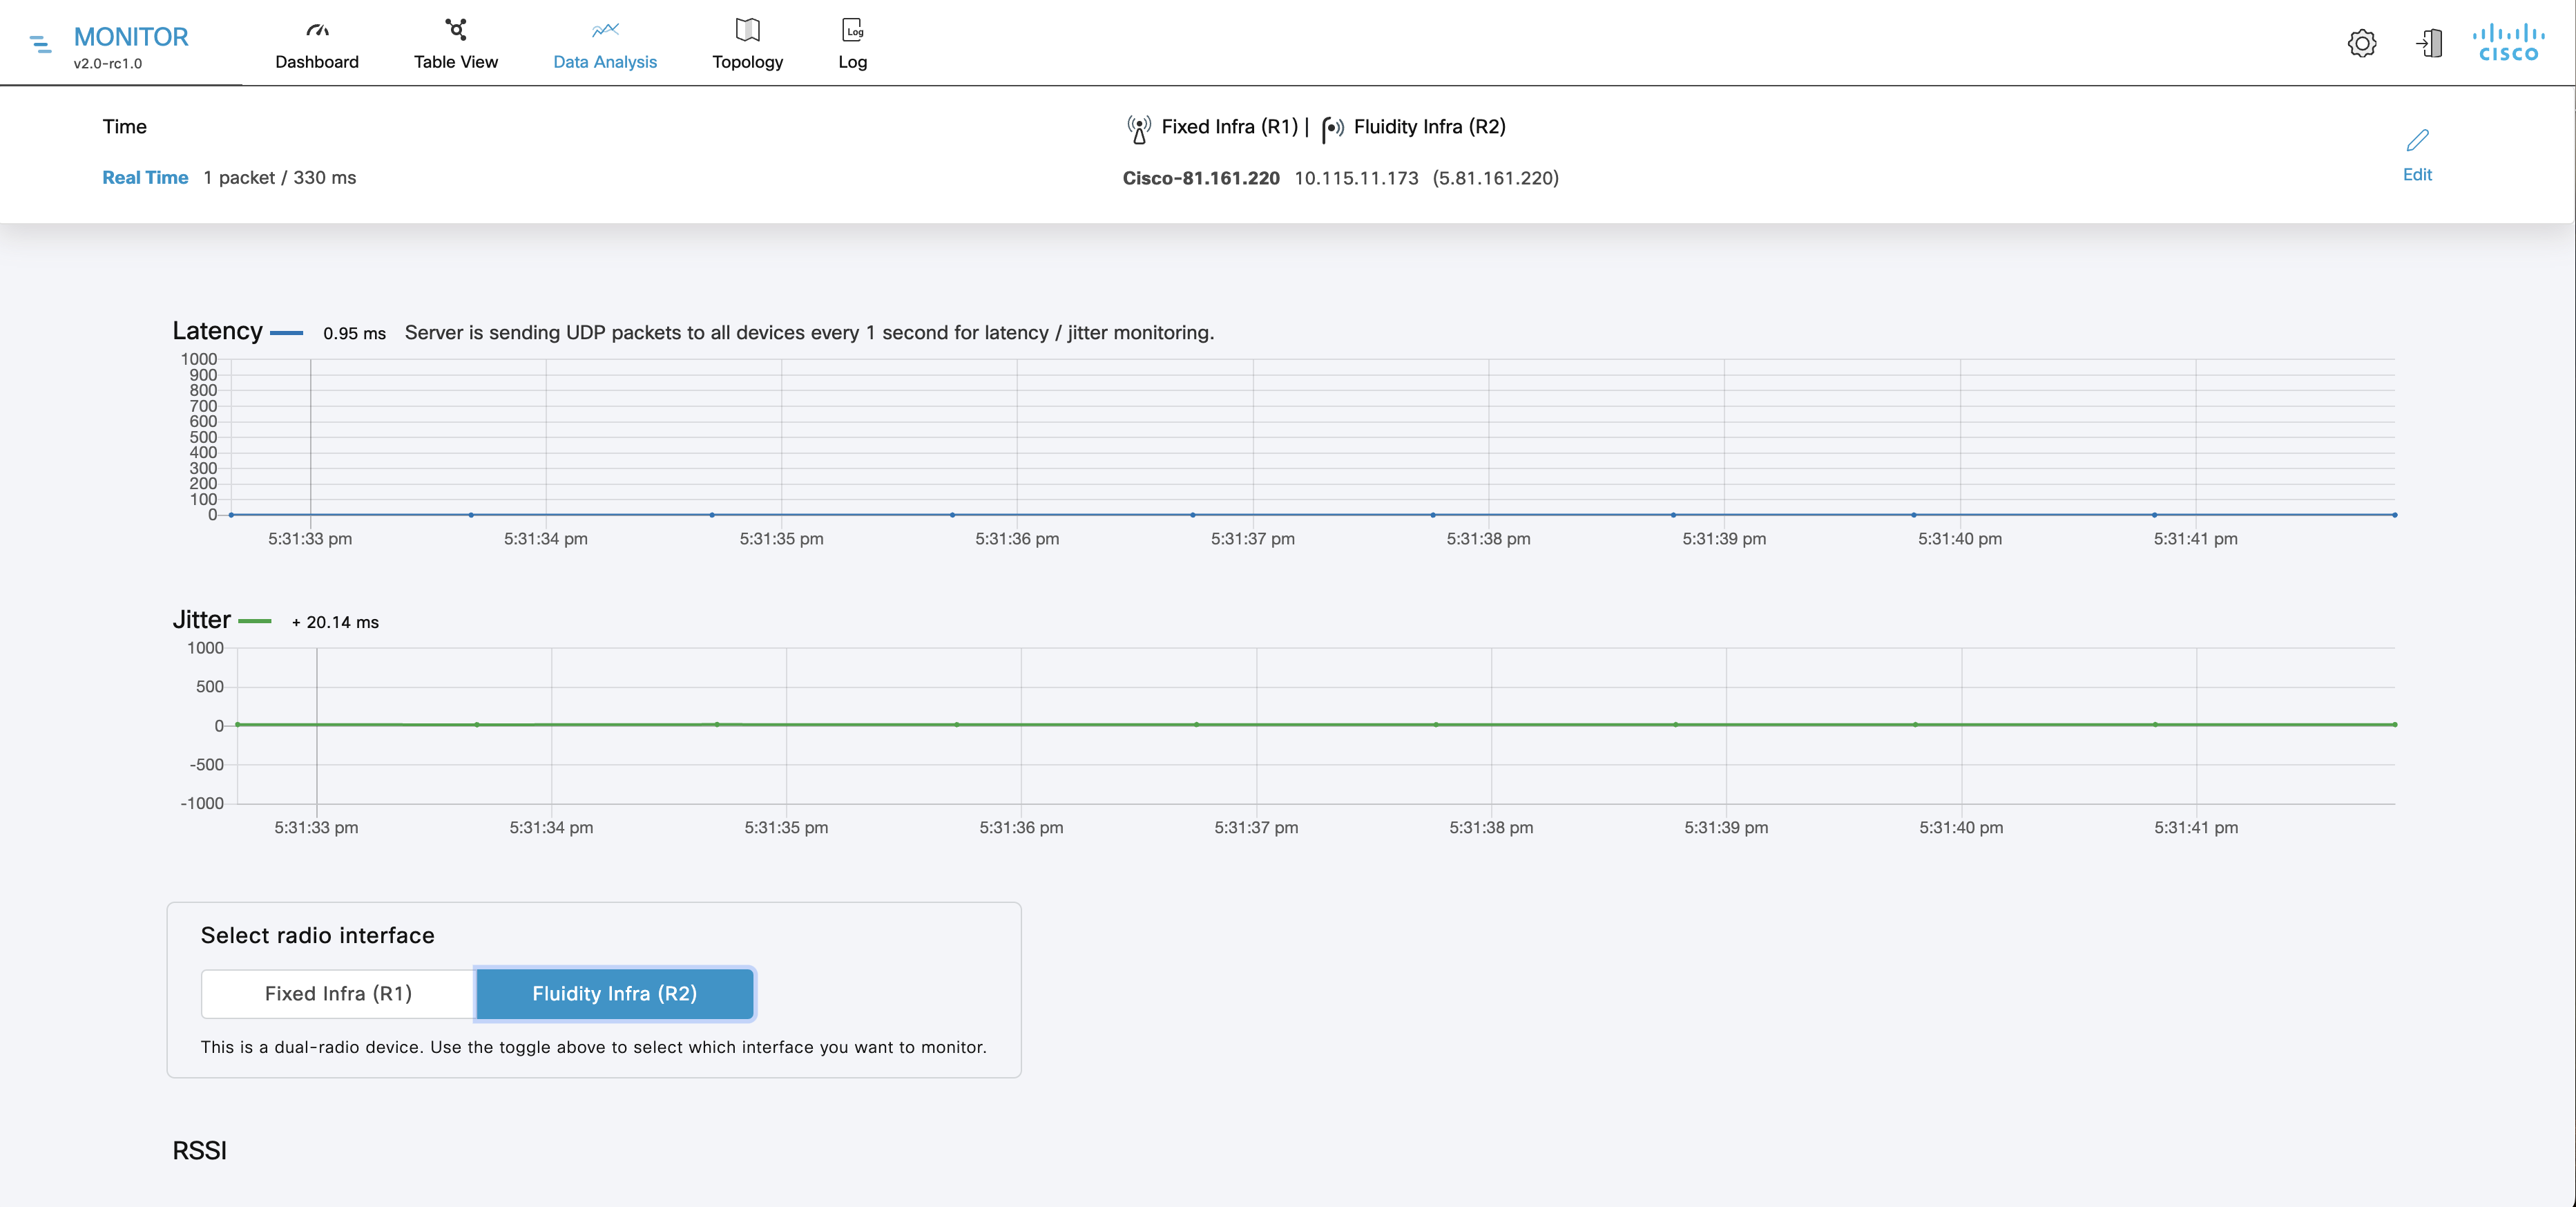
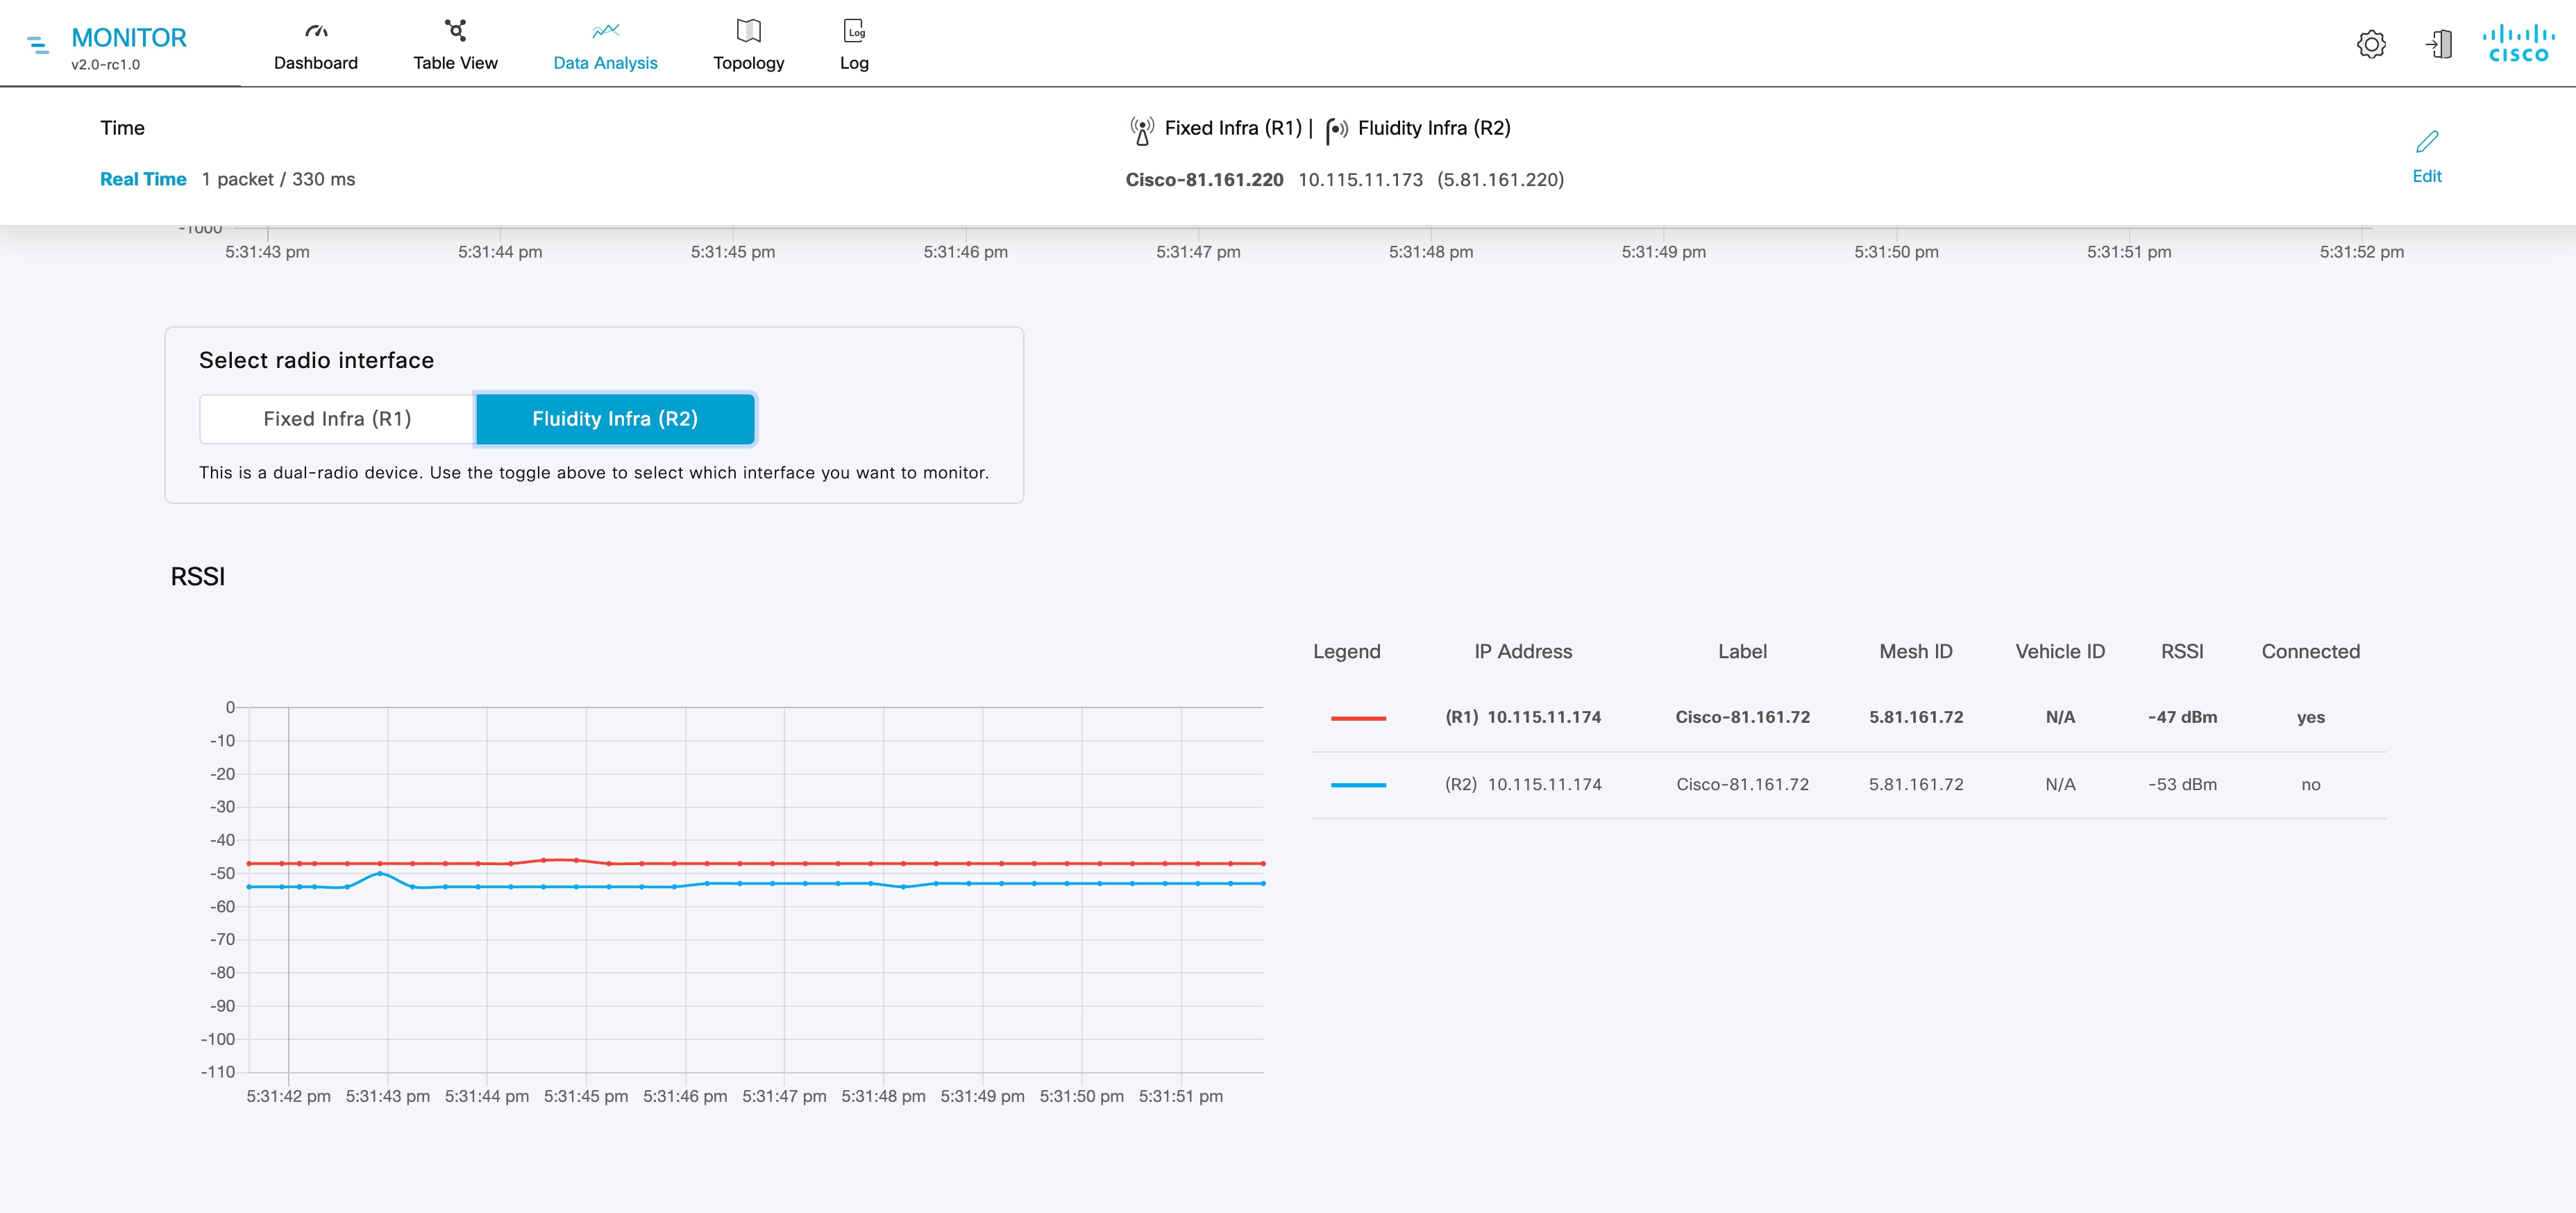
  • Displays device latency (Average latency) values across the network or section for the last six hours.

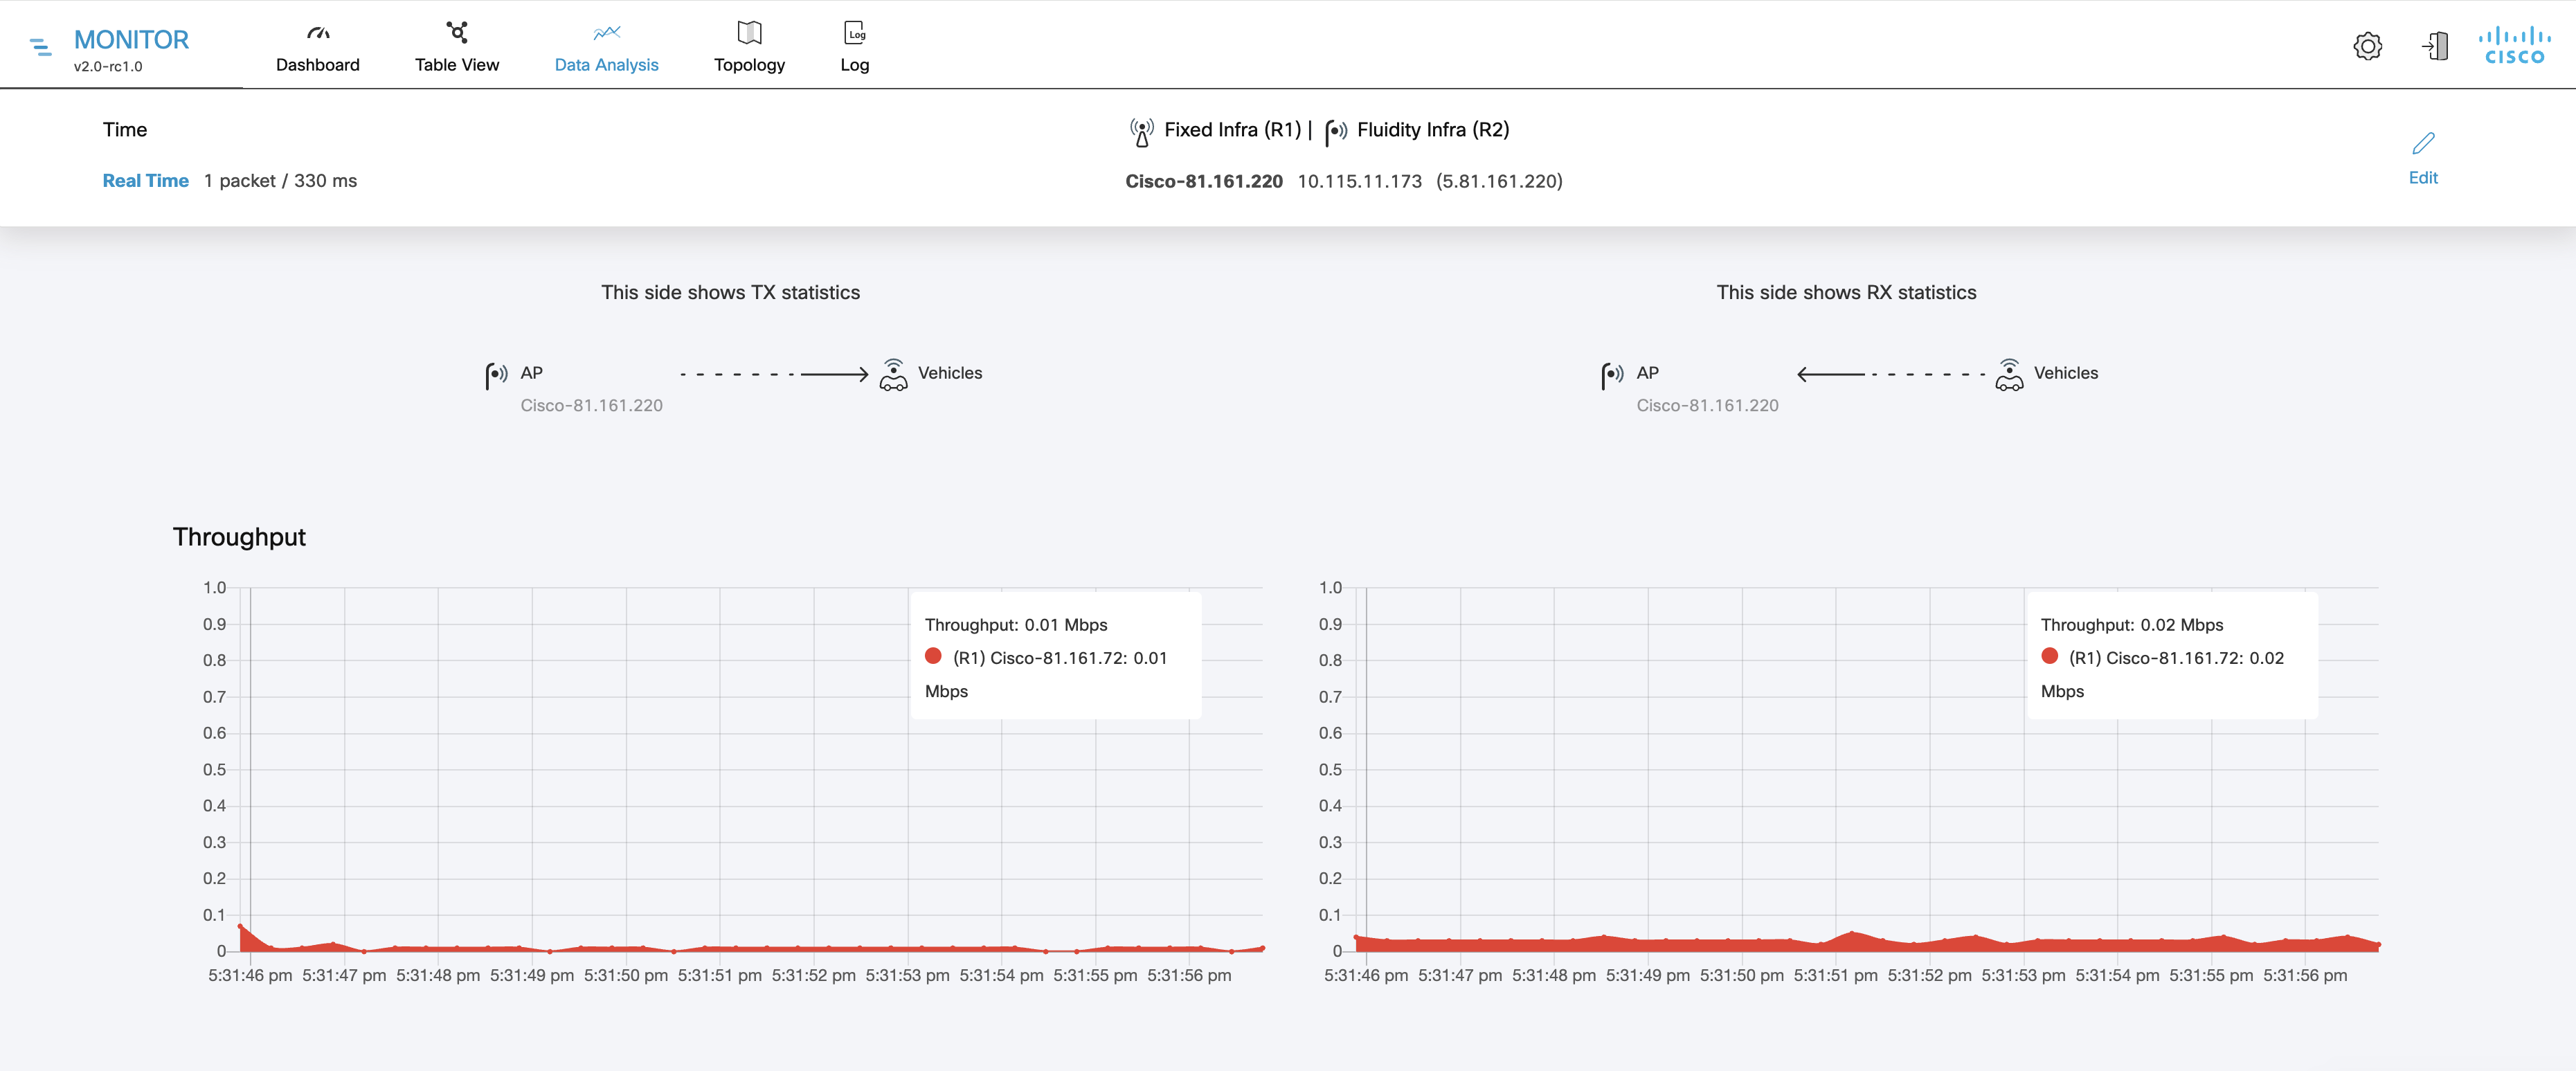
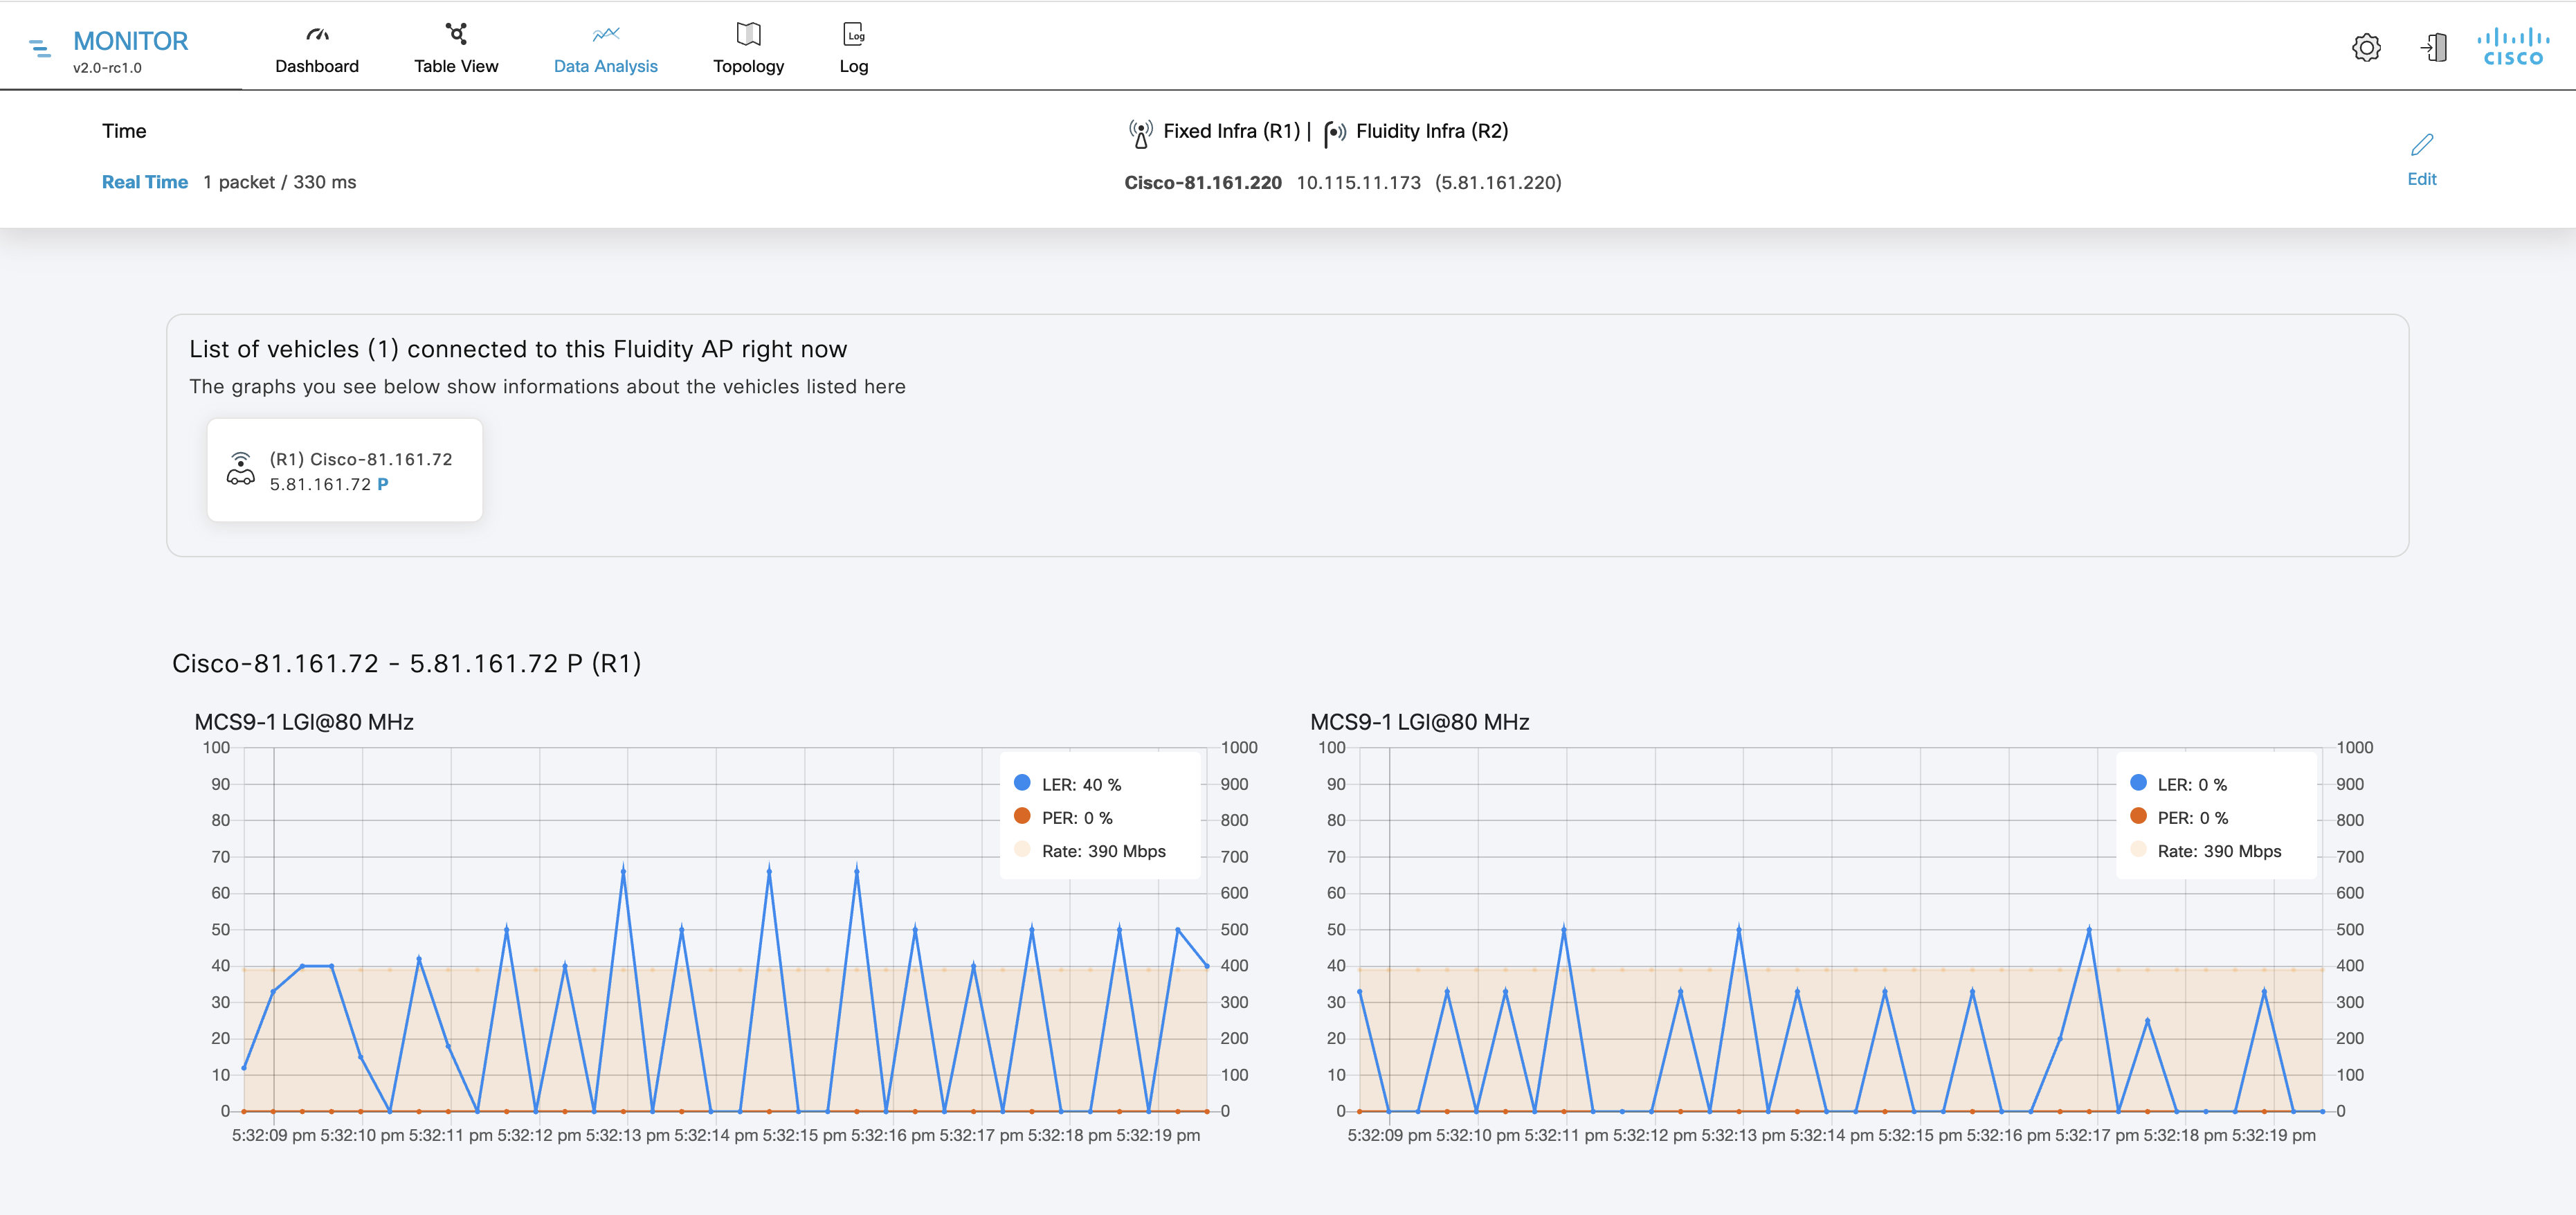
  • It provides aggregate throughput for TX and RX, the number of sent and received packets per second, the current number of edge devices, and average uptime values for each network section.

Network Statistics Reference Information

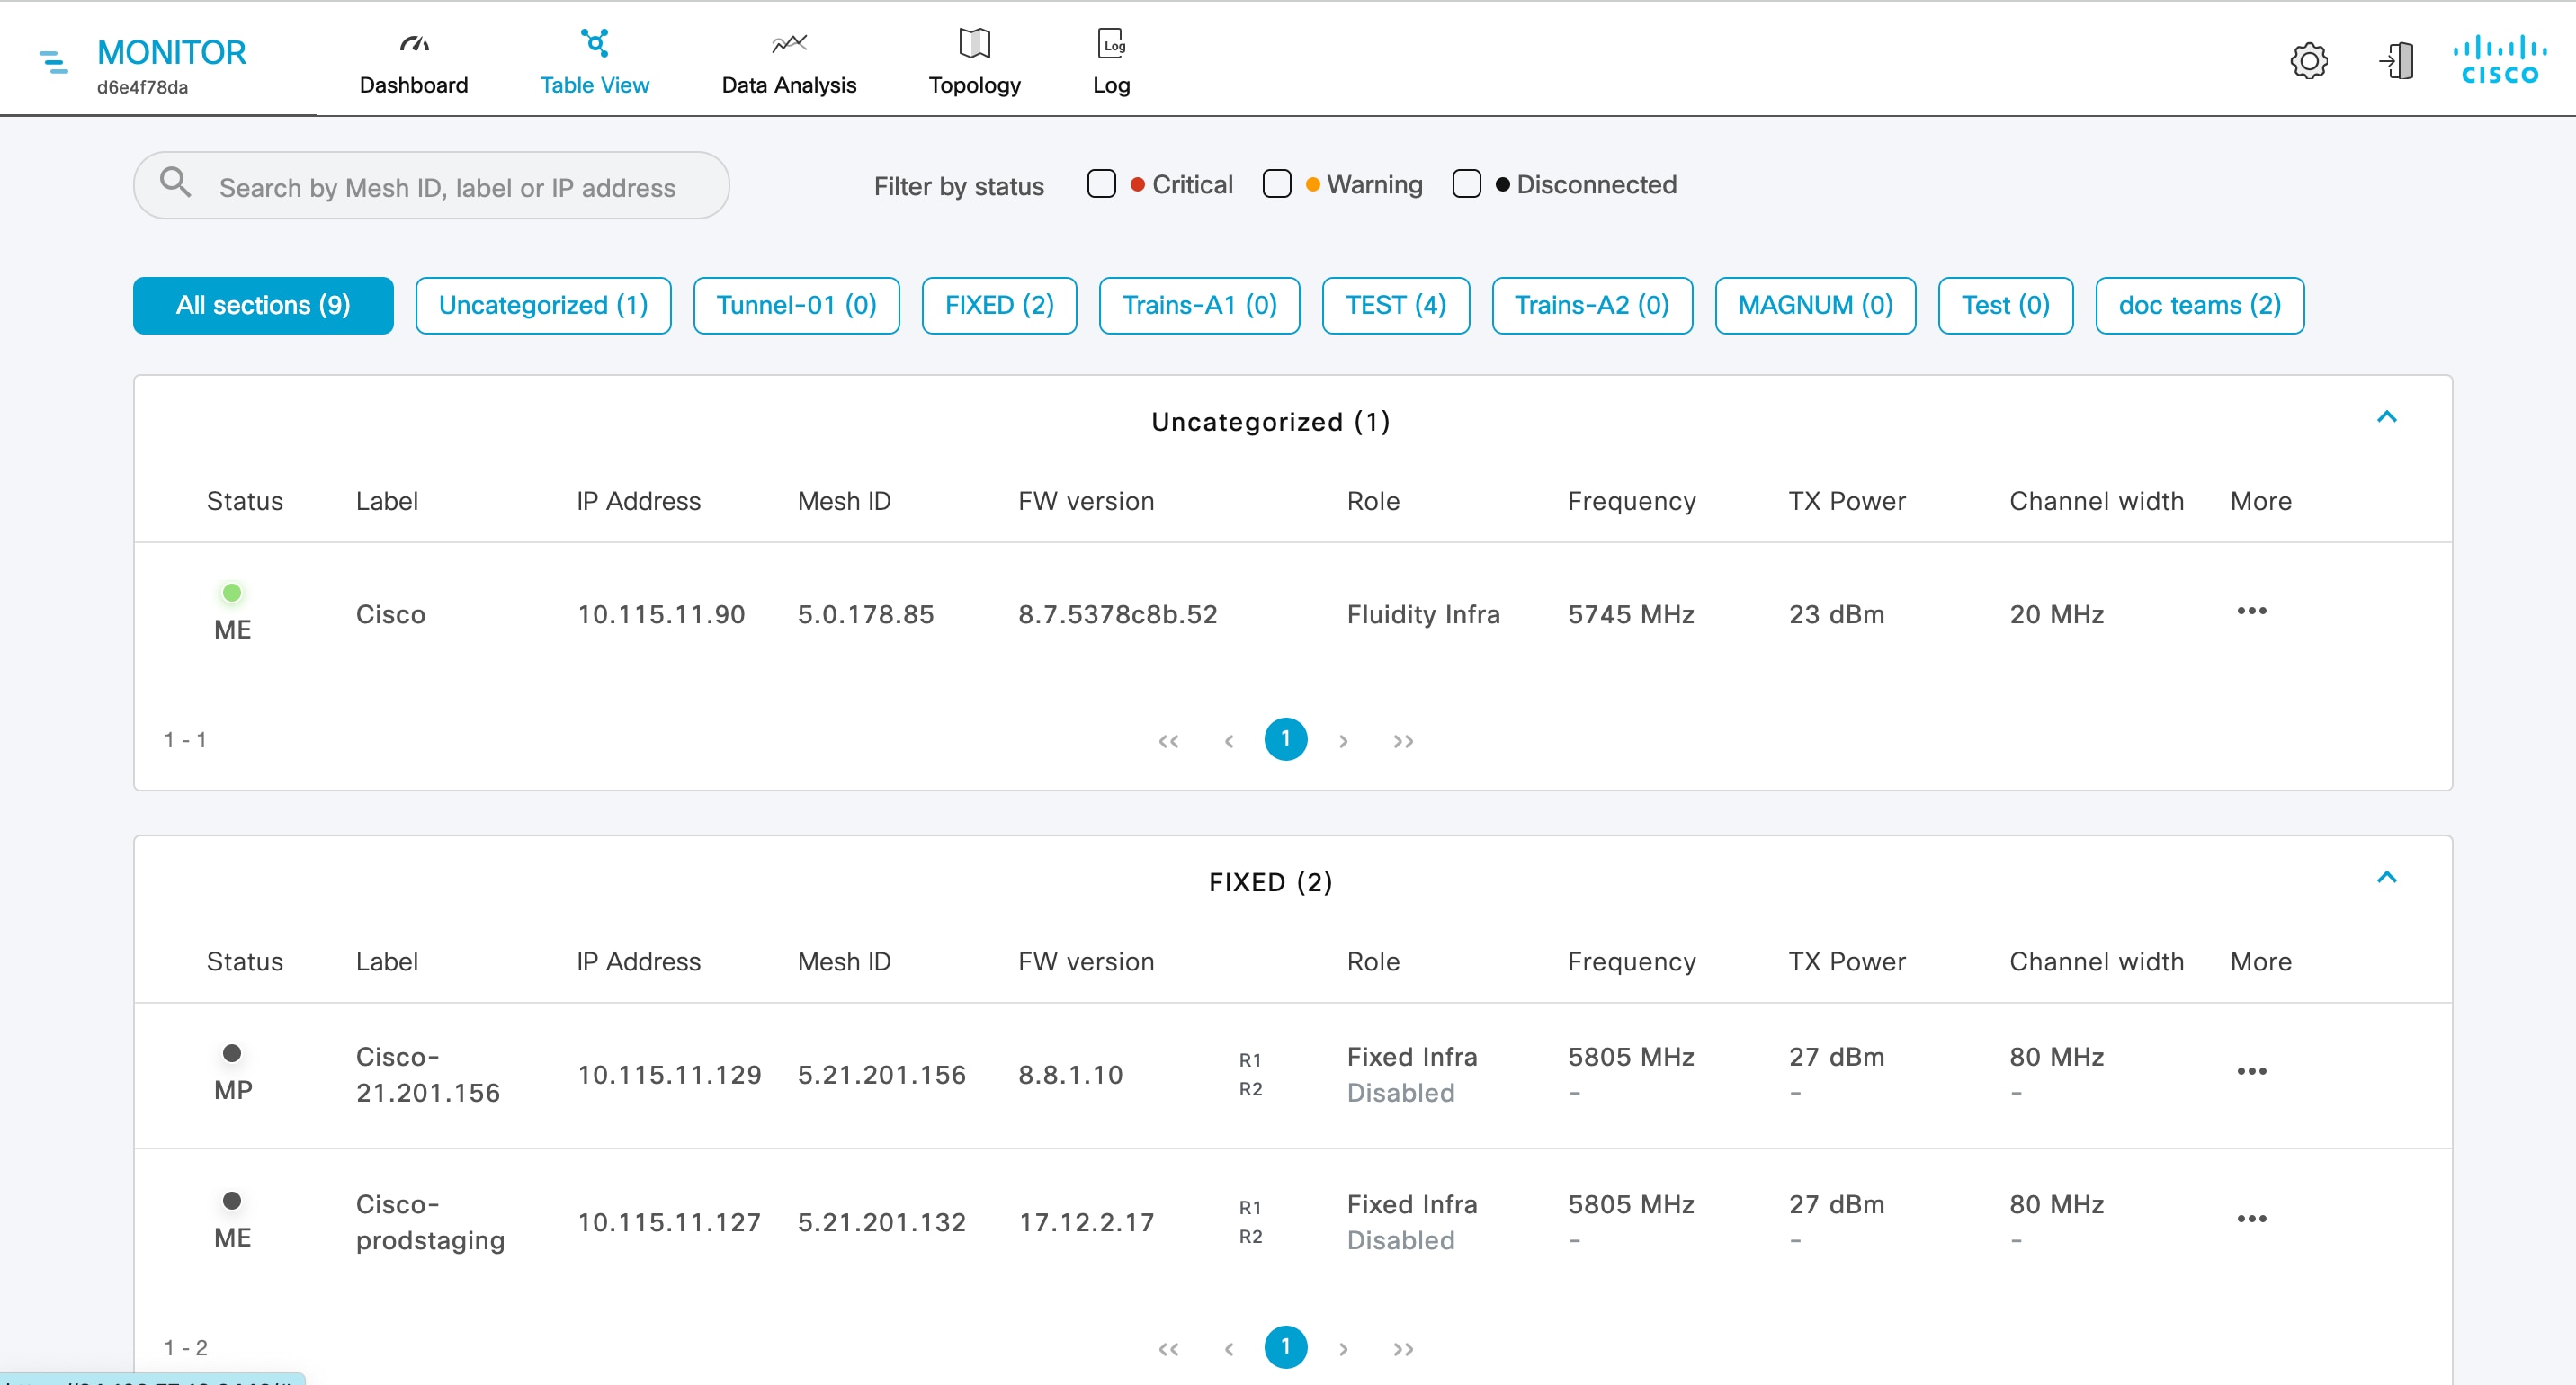
The network statistics view provides detailed information about the performance and health of each network section and its devices.

  • Number of devices currently connected to IW Monitor, in relation to the total number of devices associated with IW Monitor.

  • Device latency (Average latency) values across the network or section during the last six hours.

  • Aggregate network throughput transmitted (Throughput TX) by all devices in the network during the last six hours.

  • Aggregate network throughput received (Throughput RX) by all devices in the network during the last six hours.

  • Aggregate number of data packets sent (Sent Packets/s) by all devices in the network during the last six hours.

  • Aggregate number of data packets received (Received Packets/s) by all devices in the network during the last six hours.

  • Current number of edge devices (Edge devices).

  • Average network or section uptime value (Average uptime). The average uptime value is the combined percentage of time for each network device or section connected to the IW Monitor in the last seven days.

Figure 1. Network Statistics Overview

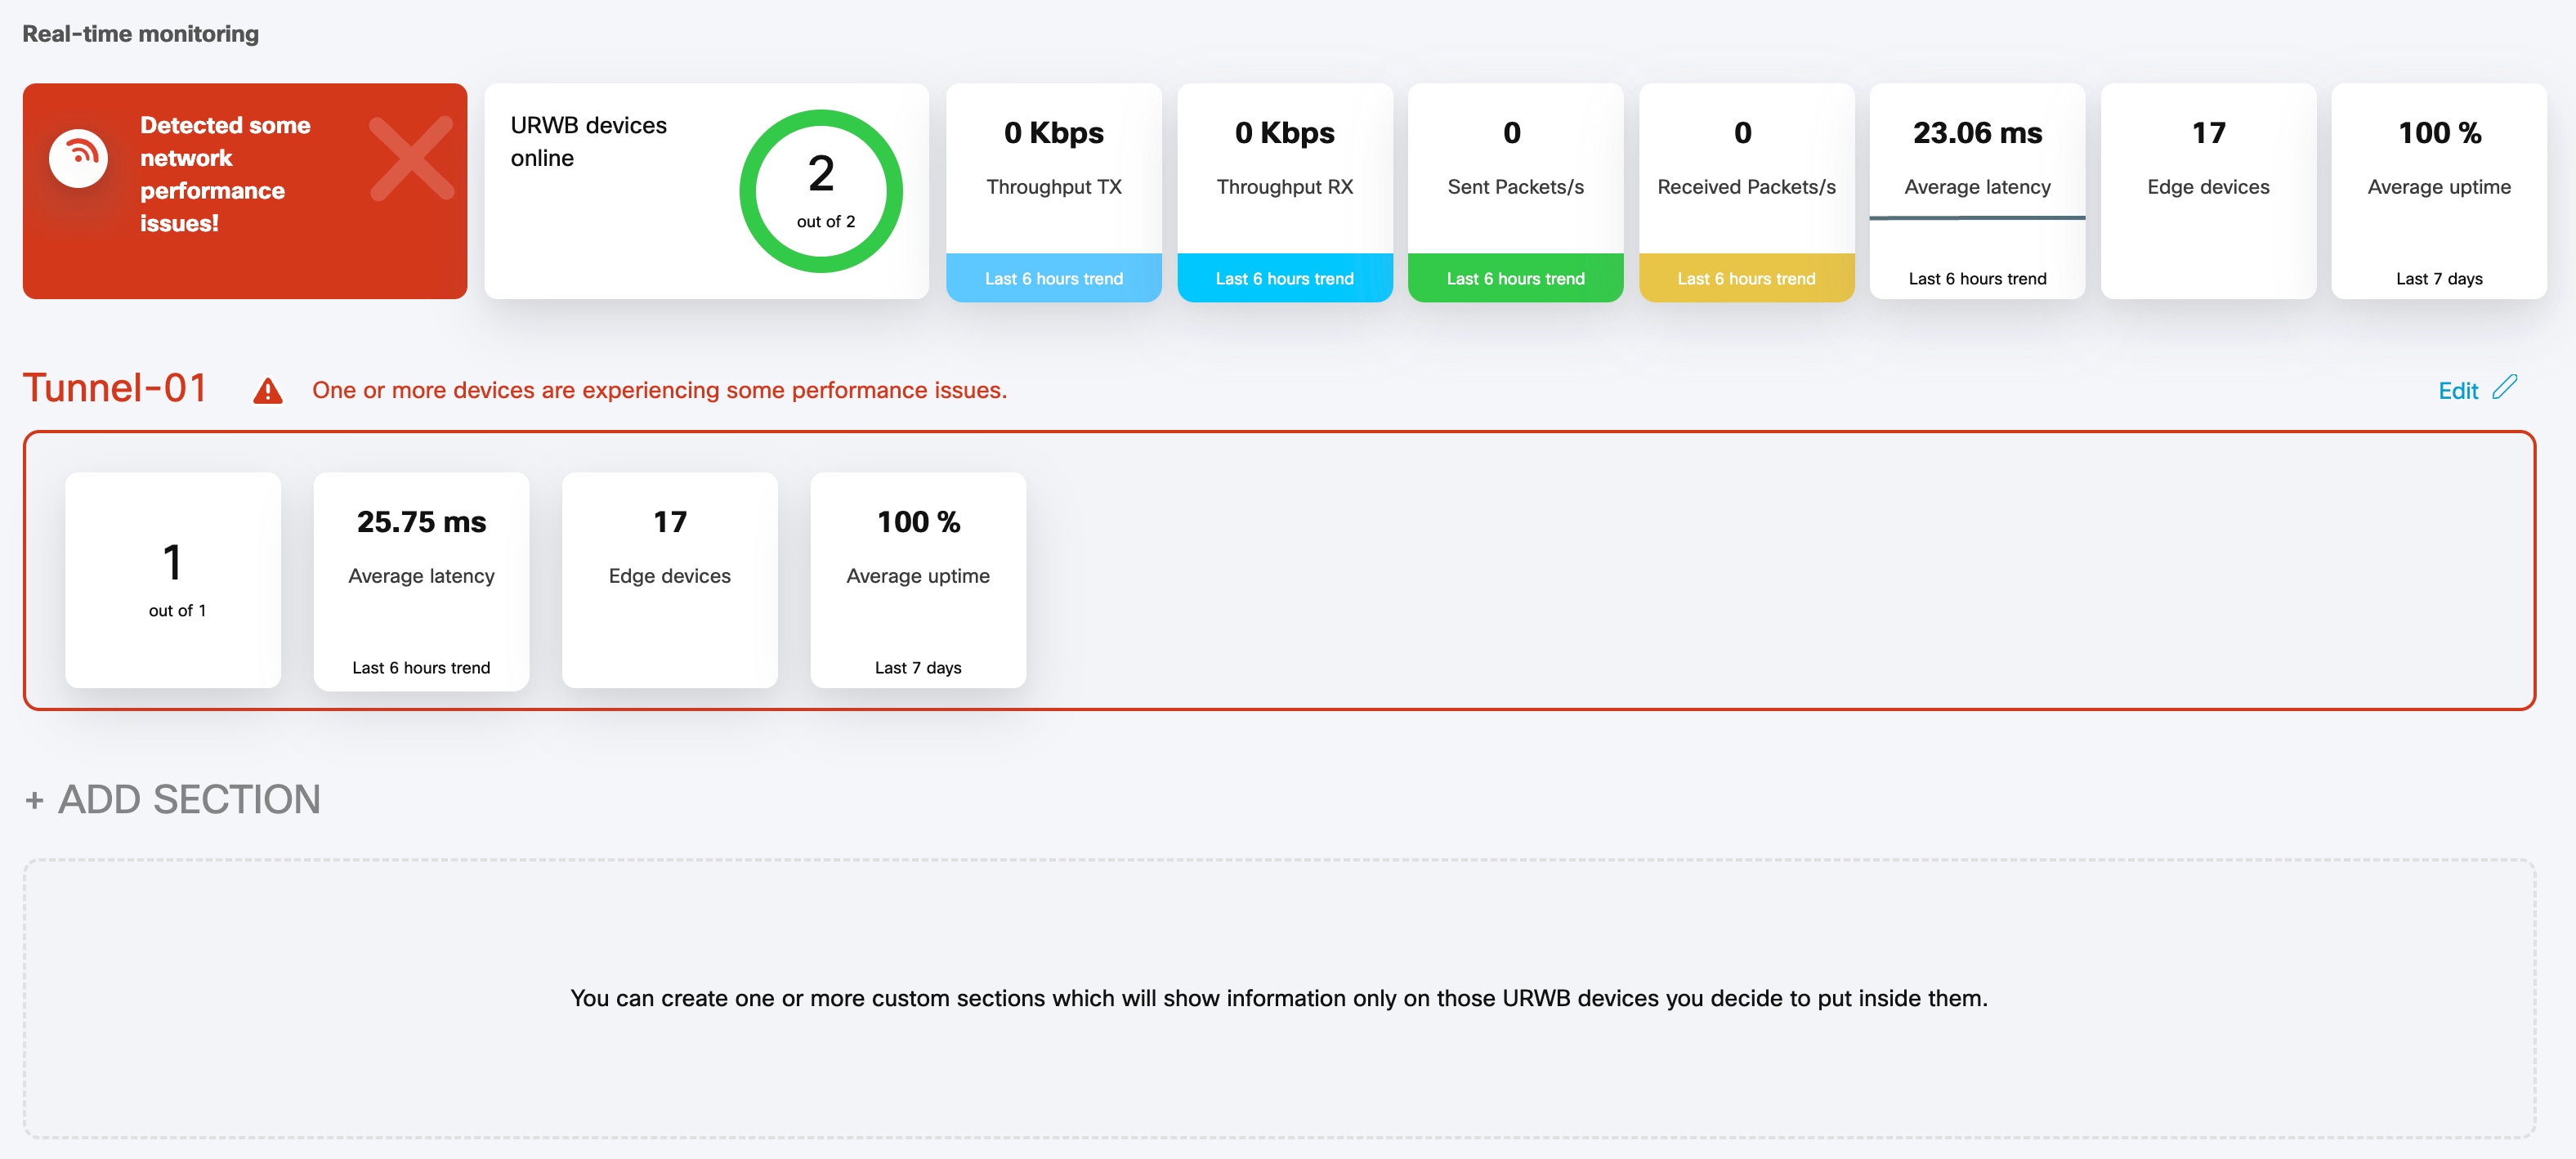
When a performance-related fault occurs, a thin red box appears around the affected section to indicate the need for immediate investigation.

The + ADD SECTION button at the bottom allows you to customize the section with the device information you want to monitor. To add a new section to an existing network, see Create a new section.

Figure 2. Section Customization Example

Use the Table View to monitor devices

The Table View is a feature in IW Monitor that displays all devices in a tabular format, showing their status, attributes, and section assignments.

  • Devices without an assigned section appear under Uncategorized .

  • Devices assigned to specific network sections appear in their respective sections.

  • Each device entry displays parameters including Status, Mode, Label, IP Address, Mesh ID, Firmware Version, Role, Frequency, TX Power, Max TX Power, and Channel width.

Device Table View Reference Information

The Table View provides a comprehensive overview of all devices with their current status and key operational parameters. Users can search for devices, filter by status, and review detailed attribute descriptions.

  • Users can search for devices by Mesh ID, assigned device name, or IP address.

  • Users can filter devices by status: Critical , Warning , or Disconnected .

  • Device attributes and their descriptions are provided in the table.

Table 1. Device Attribute Descriptions

Parameter

Description

Status

Icon colors represent device status:

  • Green : Device is online and connected to an IW Monitor with all performance levels in an acceptable range.

  • Gray : Device is disconnected from IW Monitor.

  • Orange : Device is online and connected to the IW Monitor but has one or more problems causing lower-than-optimal performance.

  • Red : Device is online and connected to IW Monitor but has one or more problems causing unacceptably low performance.

    • High packet error rate

    • High link error rate

    • Low received signal strength

    • High traffic latency

Mode

Terminology for devices configured for Fluidmesh and standalone URWB:

  • Mesh End

  • Mesh Point

  • PONTE

  • Global Gateway

  • Bridge (used for Fluidmesh only)

Terminology for Cisco Wireless (Wi-Fi-enabled) with URWB configured devices:

  • Coordinator

  • Node

Label

User-assigned device name.

Note


You cannot change the device name using IW Monitor. Use IoT OD IW service, the device offline web interface (Configurator), or the device's command-line interface (CLI) to change the device's name.

IP Address

Shows the IP address of the device.

Mesh ID

Unique, factory-set mesh identification number (for example, 5.a.b.c).

  • If set as the primary vehicle-mounted network device, letter P is shown next to the Mesh ID.

  • If set as a secondary device, letter S is shown next to the Mesh ID.

FW Version

Firmware release number.

Role

Role designations for URWB-configured device status include:

  • Fixed Infra : Device is part of a fixed-based infrastructure.

  • Fluidity Vehicle : Device is part of a Fluidity network, installed in a moving vehicle.

  • Fluidity Infra : Device is part of a Fluidity network, installed as part of a fixed infrastructure.

Role designations for Cisco Wireless (Wi-Fi-enabled) with URWB configured device status include:

  • Fixed : Device is part of a fixed-based infrastructure.

  • Mobility Client : Device is part of a Mobility network, installed in a moving vehicle.

  • Mobility Base : Device is part of a Mobility network, installed as part of a fixed infrastructure.

Note


For dual-radio devices, the Role parameter is specified for each radio interface. If the radio interface is disabled, the interface status shows Disabled .

Frequency

Current operating frequency of the device.

Note


For dual-radio devices, the Frequency parameter is shown for each radio interface.

TX Power

Current value in dBm of the radio device's transmission power.

Note


For dual-radio devices, the TX Power parameter is shown for each radio interface.

Max TX Power

User-defined value of the radio device’s maximum transmission power level.

Note


For dual-radio devices, the Max TX Power parameter is shown for each radio interface.

Channel width

Operating channel width of the radio device.

Note


For dual-radio devices, the Channel width parameter is shown for each radio interface.


Note


Use the filter options to quickly identify devices with critical, warning, or disconnected status for efficient monitoring and troubleshooting.


Figure 3. Table View and Filter Visuals

Using Table View to Monitor Devices

For example, to view all devices with a critical status, select the Critical filter. The Table View will display only those devices whose thresholds are beyond the upper threshold limit. Similarly, use the search bar to locate a device by its Mesh ID or IP address.

View device statistics in real time

IW Monitor provides network statistics that allow you to view the network-related performance of any device in the current network. You can view device statistics as events occur in real time. You can also view a performance graph showing the device's historical performance over time.

Procedure


Step 1

Click Data Analysis.

Step 2

In the TIME field, you can switch between real-time and historical data for analysis.

  1. To view statistics for a device during a specific period, select the History tab.

  2. In the Custom time range field, select the start and end dates and times for the range.

    Note


    The selected duration can't be more than 1 hour.

Step 3

In the SEARCH DEVICE field, search for a device by mesh ID, assigned device name, or IP address.

Step 4

In the ANALYSE field, click Confirm to proceed.

A real-time statistical view of the device appears. If you select the History tab, a time slider for the chosen period is also displayed.

  1. The first graph shows the received signal strengths for the device and other radio units that it could connect to.

    • The upper left corner of the graph shows whether the device currently accepts handoff requests.

    • If the chosen device is currently connected to a Fluidity-enabled (vehicle-mounted) radio unit, a thick, dashed black line is superimposed over the Fluidity device's RSSI line. This line is the RSSI envelope and represents the strongest available signal.

      Note


      In the right-hand section of the graph, devices to which the current device is connected are listed in descending order of received signal strength (RSSI).

  2. The throughput graphs display throughput statistics over time in Mbps, shown for the selected device and its current connection.

    Note


    The left graph shows uplink statistics (data flow from the current unit), while the right graph shows downlink statistics (data flow to the current unit).

  3. The LER/PER graphs show the current link error rates, packet error rates (expressed as percentages over time), and comparative signal modulation rates. LER and PER are shown for both the selected device and its current connection.

    Note


    The left graph shows uplink statistics (data flow from the current device), while the right graph shows downlink statistics (data flow to the current device).

  4. The graphs in the fourth row show the modulation and coding schemas (MCS) for the selected device and its current connection.

    Note


    The left graph shows uplink MCS statistics for the current device, while the right graph shows downlink MCS statistics for the unit to which the current device is connected.

  5. The upper left corner of the graph shows whether the device currently accepts handoff requests.

    Note


    This graph is shown only for vehicles.

Step 5

Click Edit to view statistics for a different device.


View devices from Topology

Follow these steps to view and configure devices in Topology:

Procedure


Step 1

Click Topology to view network device layout.

Step 2

Click a device to view its details.

  • Terminology for devices configured for Fluidmesh and standalone URWB:

    • ME - Mesh End

    • MP - Mesh Point

    • GGW - Global Gateway

    • BR - Bridge (used for Fluidmesh only)

  • Wireless devices with URWB on Cisco Wireless:

    • C- Coordinator

    • N - Node

Step 3

Click a wireless link or a mobile unit for link details.

Step 4

Click the Fluidity Vehicle Unit for mobile asset information.

Step 5

Click Web pageto open a separate device configurator login page.

Step 6

Click Settingsto adjust topology view settings:

  1. In the Appearance toggle:

    • EDIT MODE : to lock/unlock device positions on the topology map.

    • SHOW LINKS : to display inactive links not in use as routes are shown.

    • KPI VALUES ON ROUTES : to show performance metrics. ( L.E.R , P.E.R , RSSI , and Link Utilization) will be shown for all wireless routes.

    • RESET TOPOLOGY SETTINGS : to restore default settings.

  2. In the Layout tab, select a view template.

  3. In the Background tab, customize the topology background.

  4. In the Positioning tab, choose automatic or CSV-based positioning.

    • Automatic (hierarchy) - Allows the devices to be positioned automatically as a tree.

    • Coordinates (CSV file) - You can upload a CSV file with the list of coordinates for each device (latitude and longitude). Then, position any two devices in the panel and all the other devices will be automatically positioned based on the geo coordinates in the CSV file.

Step 7

Click Edit Mode to modify device or background positions.

  1. Click Continue to Edit Mode and make desired changes to devices or background..

    • In Devices view, you will see the devices.

    • In Background view, you can adjust the background scale and transparency to concentrate on a particular section of the topology view.

  2. Click Save changes to apply modifications.

Step 8

Click Zoom to adjust the topology view.


Enable MPO processing to check in topology

Procedure


Step 1

Navigate to Settings > MPO.

Step 2

Enable MPO Processing.

Step 3

Select the time unit (Minutes or Hours) from the TIME WINDOW dropdown list.

Step 4

Set the time window to compute the number of packets lost or received on the primary path. For example, 1minute to 59 minutes and 1hour to 24hours.

Step 5

Save your changes.

Enable MPO telemetry on both Mesh Ends and Fluidity. To use CLI commands, see the Software Configuration Guide.

Step 6

To view MPO telemetry metrics, go to the Topology screen and select Fluidity Vehicle Unit.

  • If MPO telemetry is not enabled, a warning messages.

  • If MPO telemetry is enabled, these metrics appear:

    Metrics

    Description

    Lost on Primary Path only

    These metrics provide details about the number of packets lost or received out of order on the primary MPO path, divided by the total number of packets sent on the primary path.

    Received on alternate paths

    These metrics provide details about the number of packets accepted on any MPO alternate path divided by the number of packets sent on all paths.


View network event logs

Procedure


Step 1

Access the Log to view network events for the current device.

Step 2

In the Custom time range field, set the start and end dates and times for the range.

Step 3

Click Confirm to proceed.

A log of network related events is shown for the chosen date/time range.

Step 4

In the Level dropdown, choose the level of criticality of network events.

  • Critical - Critical level events have an immediate, negative impact on system performance or on system integrity and must be addressed immediately.

  • Warning - Warning level events have a potentially negative impact on system performance and should be addressed as soon as practically possible.

  • Info - Info level events are normal system events. This is the default event display level.

  • Trace - Trace level events are considered trivial, but can be useful for diagnostic troubleshooting.

Step 5

In the Events dropdown, select the relevant category from the left pane and then select the checkboxes for the required network event.

  1. (Optional) To clear the applied filters, click Clear Filters.

  2. (Optional) To edit the time range of the log, click Edit.


Export a network event log

Procedure


Step 1

Click Export.

Step 2

Review and confirm the date/time range in Export Log pop-up screen. Then click Export again.

Step 3

Select the save location.