Change the interval at which statistical data is logged
Procedure
|
Step 1 |
Go to . 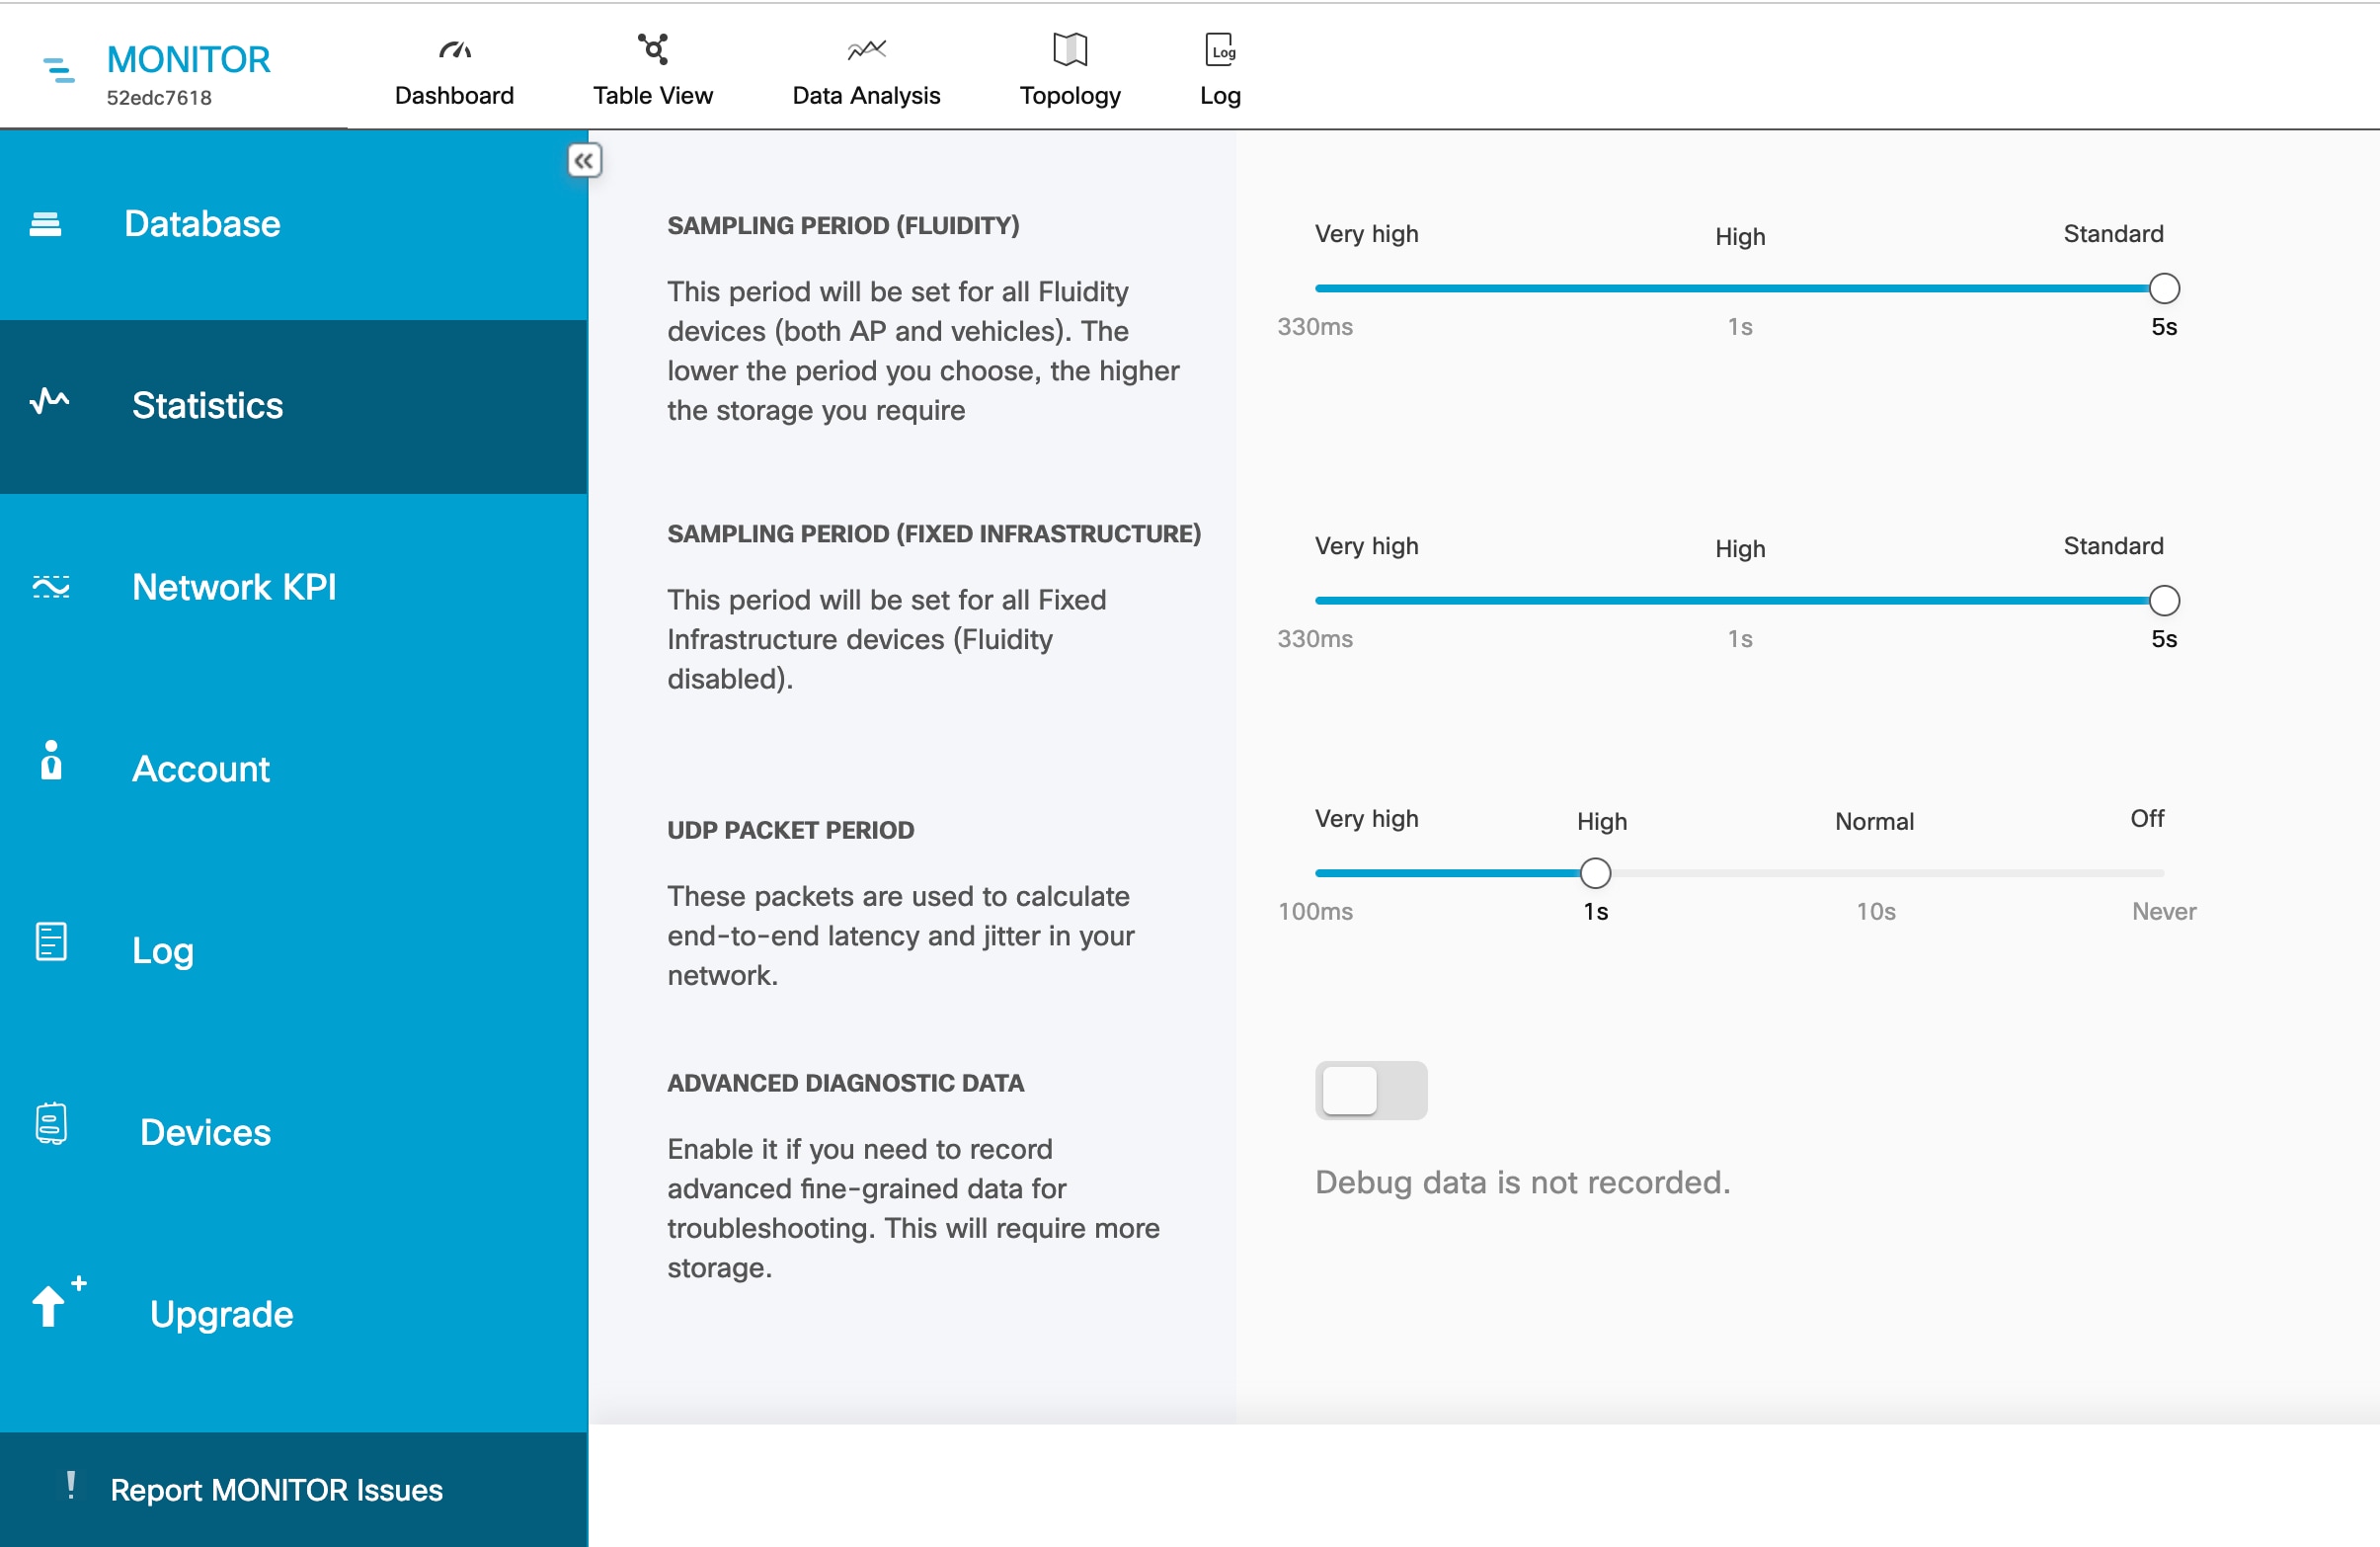
|
||
|
Step 2 |
Set the SAMPLING PERIOD (FLUIDITY) and SAMPLING PERIOD (FIXED INFRASTRUCTURE) value to change the time interval at which statistical data is logged. The recommended data-logging frequency intervals are:
|
||
|
Step 3 |
Set the UDP PACKET PERIOD value to increase the accuracy with which the IW Monitor host calculates network latency and jitter in the network. |
||
|
Step 4 |
Enable ADVANCED DIAGNOSTIC DATA to log debugging data for faster, more detailed information for technical support. This requires more storage. |
 Feedback