Streaming telemetry
A telemetry stream is a network monitoring method that:
-
streams configuration and operational data from controllers in real time
-
transmits data in a structured format to remote management stations
-
enables efficient monitoring and troubleshooting of Wi-Fi and system health
-
Telemetry feed: a specific subscription within a telemetry stream that delivers the selected data elements.
-
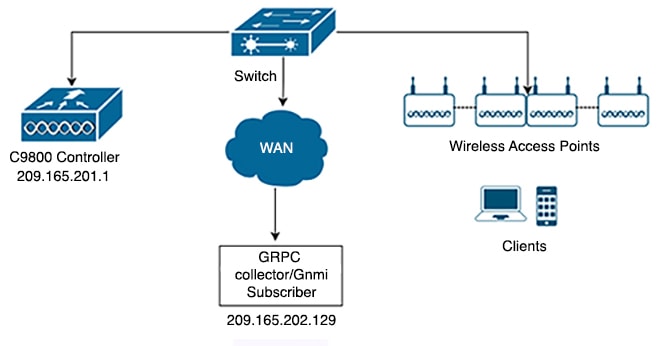
Collector: the remote management station that receives telemetry data for analysis.
Streaming telemetry capabilities and usage
You can use streaming telemetry for scalable and efficient monitoring of access points and clients through native Cisco wireless models.
-
You can enhance telemetry support to monitor up to 1,000 access points and 15,000 clients.
-
Use a single collector setup to subscribe to the required XPaths.
-
Use a telemetry feed to subscribe to data elements and monitor access points and clients.
-
You receive data through the native Cisco wireless models.
Gather points
A gather point is a data grouping mechanism that
-
represents a top-level XPath in the telemetry data model
-
acts as the smallest unit of data exported by a target device, and
-
ensures subscriptions receive all data leaves defined beneath that point.
Supported gather points and subscription intervals
This table lists supported gather points and the minimum subscription intervals for each:
|
Supported gather point |
Subscription interval |
|---|---|
|
wireless-access-point-oper:access-point-oper-data/ethernet-mac-wtp-mac-map |
>=15 mins |
|
/wireless-access-point-oper:access-point-oper-data/capwap-data |
>=15 mins |
|
/wireless-access-point-oper:access-point-oper-data/cdp-cache-data/ |
>=15 mins |
|
/wireless-access-point-oper:access-point-oper-data/radio-oper-stats |
>=60 secs |
|
/wireless-access-point-oper:access-point-oper-data/radio-oper-data |
>=180 secs |
|
/wireless-access-point-oper:access-point-oper-data/oper-data |
>=180 secs |
|
/wireless-rrm-oper:rrm-oper-data/rrm-measurement |
>=180 secs |
|
/wireless-client-oper:client-oper-data/dot11-oper-data |
>=180 secs |
|
/wireless-client-oper:client-oper-data/common-oper-data |
>=15 mins |
|
/wireless-client-oper:client-oper-data/policy-data |
>=60 secs |
|
/wireless-client-oper:client-oper-data/sisf-db-mac/ipv4-binding/ip-key/ip-addr |
>=15 mins |
|
/wireless-client-oper:client-oper-data/traffic-stats |
>=180 secs |
|
/lldp-ios-xe-oper:lldp-entries/lldp-state-details |
>=60 secs |
|
/device-hardware-xe-oper:device-hardware-data/device-hardware |
>=15 mins |
|
/wireless-mobility-oper:mobility-oper-data/mobility-node-data/ulink-status |
>=60 secs |
|
/process-cpu-ios-xe-oper:cpu-usage/cpu-utilization/one-minute |
>=60 secs |
|
/platform-sw-ios-xe-oper:cisco-platform-software/control-processes |
>=60 secs |
|
/environment-ios-xe-oper:environment-sensors/environment-sensor |
>=60 secs |
|
/lldp-ios-xe-oper:lldp-entries/lldp-intf-details |
>=60 secs |
|
/interfaces-ios-xe-oper:interfaces/interface |
>=60 secs |
|
/platform-ios-xe-oper:components/component |
>=60 secs |
|
/mdt-oper-v2:mdt-oper-v2-data |
>=60 secs |
|
/wireless-access-point-oper:access-point-oper-data/radio-oper-data/radio-band-info |
>=180 secs |
Example of gather point subscription
When you subscribe to an XPath such as /access-point-operdata/radio-oper-data/vap-oper-config/ssid, which is part of the gather point /access-point-operdata/radio-oper-data/vap-oper-config, the reply will include all attributes that are part of the gather point, such as AP-VAP-ID, SSID, and WLAN ID.
Subscription
A subscription is a configuration that
-
binds one or more gather points and destinations
-
streams data for each gather point using MDT, and
-
operates at a configured cadence (frequency).
Transport
A transport is a protocol that:
-
enables a connection between a publisher and a receiver
-
determines how data is transmitted
-
operates independently from the management protocol used for configured subscriptions
-
The choice of transport protocol affects compatibility and the data formats exchanged between systems.
-
The supported transport protocols are gNMI (gRPC Network Management Interface) and gRPC (Google Remote Procedure Call).
-
The gNMI transport protocol supports JSON encoding of data.
-
The gRPC transport protocol supports key value Google Protocol Buffers (kvGPB: key value Google Protocol Buffers) encoding.
Scale considerations
This table provides the scale numbers that are applicable to the native model for an XPath set.
|
Attribute |
Scale |
|---|---|
|
AP |
4000 |
|
Client |
15000 |
|
SSID per AP |
6 |
|
BSSID per AP |
12 |
|
Neighbors per AP |
60 (30x2) |
|
Number of physical neighbor APs |
49 |
|
Number of neighbor records |
60000 records |
Session
A session is a telemetry connection that
-
enables data exchange between the controller and the receiver
-
may be initiated by the user, and
-
supports two modes: gNMI Dial-In and gRPC Dial-Out.
Session initiation modes
You can initiate a session between the controller and the receiver using these modes:
-
gNMI Dial-In Mode
-
gRPC Dial-Out Mode
gNMI dial-in modes
A gNMI dial-in mode is a telemetry subscription mechanism that:
-
enables a Model-Driven Telemetry (MDT) receiver to connect directly to the controller
-
allows the receiver to dynamically subscribe to one or more gather points or subscriptions, and
-
streams telemetry data from the controller to the receiver over the established session until the subscription is canceled or the session is terminated
Reference Information for gNMI Dial-In Mode
In gNMI dial-in mode, the MDT receiver (client) initiates a connection ("dials in") to the controller (server). After connecting, the receiver can select and change the telemetry data it wants to receive by subscribing to specific gather points (subscriptions).
The controller streams the selected telemetry data to the receiver over the same session. Subscriptions in dial-in mode are temporary. They end when the receiver cancels the subscription or disconnects. This differs from persistent, controller-initiated subscriptions.
Example of gNMI Dial-In Mode
A network operations system uses gNMI dial-in mode to gather real-time interface statistics from a controller. The system connects as a client, subscribes to the desired telemetry data, and continues receiving updates until it cancels the subscription and terminates the session.
gRPC dial-out modes
A gRPC dial-out mode is a telemetry delivery method that:
-
enables the controller to act as a client and initiate outbound connections to receivers
-
binds gather points and destinations into subscriptions that continually deliver telemetry data
-
streams data to receivers and continually maintains sessions for each configured destination
Additional reference information
In dial-out mode, the controller contacts the receiver, which acts as a server. Configure gather points and destinations and link them into one or more subscriptions.
The controller establishes and maintains sessions with each destination in the subscription to ensure continuous data streams. Subscriptions in this mode remain persistent.
 Note |
If you remove a VRF (Virtual Routing and Forwarding) definition and link it to a telemetry source interface, configure these commands with the name server settings to ensure DNS resolution works correctly: |
Configure telemetry on controllers
Summary
You enable gNXI in different modes. You verify the status of telemetry subscriptions. You manage existing subscriptions on the controller.
Workflow
You can configure telemetry on a controller by completing these steps.
- Enable gNXI in insecure mode.
- Enable gNXI in secure mode.
- Verify the status of the subscription.
- Manage configured subscriptions.
Result
The controller is configured for telemetry. You can validate and manage the desired subscriptions.
This configuration supports real-time monitoring and reporting.
Enable the gRPC Network Operations Interface (gNXI) in Insecure Mode (CLI)
Enable the gNXI server in insecure mode. Use this mode for testing or non-production environments that do not require certificate-based security.
The gRPC Network Operations Interface (gNXI) is a network management protocol. In insecure mode, the server does not use certificate-based authentication or encrypted communication.
Procedure
|
Step 1 |
Enable privileged EXEC mode. Example:Enter your password if prompted. |
|
Step 2 |
Enter global configuration mode. Example: |
|
Step 3 |
Start the gNXI process. Example: |
|
Step 4 |
Enable the gNXI server in insecure mode. Example: |
|
Step 5 |
Set the gNXI port. Example:The default insecure gNXI port is 9339. |
|
Step 6 |
Return to privileged EXEC mode. Example: |
|
Step 7 |
View the status of the gNXI server. Example: |
The gNXI server operates in insecure mode. It listens for incoming connections on the specified port.
Verify the status using the show gnxi state command.
This example shows sample output from the show gnxi state command:
Device# show gnxi state
State Status
--------------------------------
Enabled Up
Enable gNXI in Secure Mode (CLI)
Enable gNXI in secure mode so your device securely interfaces with gNXI clients. This setup uses certificate-based authentication and encrypted communication.
gRPC Network Operations Interface (gNXI) is a modern protocol for network management. Secure mode encrypts and authenticates all gNXI communication.
Use this task if you deploy devices in environments where security is critical or compliance mandates certificate-based authentication for management protocols.
Procedure
|
Step 1 |
Enable privileged EXEC mode. Example:Enter your password if prompted. |
|
Step 2 |
Enter global configuration mode. Example: |
|
Step 3 |
Start the gNXI process. Example: |
|
Step 4 |
Enable the gNXI server in secure mode. Example: |
|
Step 5 |
Specify the trustpoint and certificate set that gNXI uses to authenticate clients. Example: |
|
Step 6 |
(Optional) Enable client certificate authentication. Example:gNXI authenticates client certificates against the root certificate you configure. |
|
Step 7 |
(Optional) Set the gNXI port number. Example:If you do not enable secure mode, gNXI uses port 9,339 by default. |
|
Step 8 |
Return to privileged EXEC mode. Example: |
|
Step 9 |
Display the gNXI server's status to confirm your configuration. Example: |
The device enables gNXI in secure mode using the configured trustpoint and port. The device allows secure, certificate-authenticated connections from gNXI clients.
This is sample output from the show gnxi state command:
Device# show gnxi state
State Status
--------------------------------
Enabled Up
Verify the status of a telemetry subscription on a controller
To verify the status of a subscription, use these commands:
Device# show telemetry ietf subscription all
Device# show telemetry ietf subscription 101
Device# show telemetry ietf subscription 101 detail
Device# show telemetry ietf subscription 101 receiver
Device# show telemetry internal connection
Device# show telemetry internal subscription all stats
Device# show telemetry receiver all
Device# show telemetry receiver name <receivers-name>
Device# show telemetry connection all
Manage configured subscriptions on a controller (CLI)
Configure telemetry subscriptions to collect data from supported YANG models and stream data to remote receivers on a controller.
Use the show platform software ndbman switch { switch-number | active | standby } models command to display the list of YANG models that support on-change subscription.
Note |
Currently, you can only use the gRPC protocol for managing configured subscriptions. |
Procedure
|
Step 1 |
Enable privileged EXEC mode. Example:Enter your password, if prompted. |
|
Step 2 |
Enter global configuration mode. Example: |
|
Step 3 |
Create a telemetry subscription and enter telemetry-subscription mode. Example: |
|
Step 4 |
Specify the Key-value Google Protocol Buffers (kvGPB) encoding. Example: |
|
Step 5 |
Specify the XPath filter for the subscription. Example: |
|
Step 6 |
Configure the source IP address on the telemetry subscription interface. Example: |
|
Step 7 |
Configure a stream for the subscription. Example: |
|
Step 8 |
Configure a periodic update policy for the subscription. Example: |
|
Step 9 |
Configure a periodic update policy for the subscription. Example:Example: |
|
Step 10 |
Exit telemetry-subscription configuration mode and return to privileged EXEC mode. Example: |
The telemetry subscription is configured, and the controller pushes YANG model data to the defined receiver using the gRPC protocol.
Configure zero trust telemetry
Summary
Zero trust telemetry provides enhanced monitoring and security by collecting and transmitting telemetry data from the controller.
Workflow
The stages describe the steps to configure zero trust telemetry on the controller.
- Define a protocol for telemetry communication on the controller.
- Define a named receiver to receive telemetry data.
- Configure the telemetry subscription to enable data collection and transmission.
Define a protocol (CLI)
Securely configure telemetry data export protocols by defining protocol profiles with appropriate trustpoints.
Before you begin
Define crypto trustpoints (CAforMDTserver and IDforWLCclient) and certificates before the telemetry configuration.
Procedure
|
Step 1 |
Enter global configuration mode. Example: |
|
Step 2 |
Configure the protocol gRPC profile and enter gRPC profile name. Example: |
|
Step 3 |
Add the server CA trustpoint. Example: |
|
Step 4 |
Add the client ID trustpoint. Example: |
The telemetry protocol profile is configured with the specified trustpoints.
Define a named receiver (CLI)
Define a named receiver and associate an FQDN and TLS profile for telemetry data delivery.
This procedure defines:
-
FQDN DNS name
-
Crypto protocol definition
Procedure
|
Step 1 |
Enter global configuration mode. Example: |
|
Step 2 |
Configure the receiver name. Example: |
|
Step 3 |
Add FQDN DNS name of receiver. Example: |
|
Step 4 |
Define the gRPC TLS profile named mtlsyang. Example: |
The device is now configured with a named telemetry receiver with the specified parameters.
Configure a telemetry subscription (CLI)
Set up telemetry subscriptions to send device data to external receivers for analysis and monitoring.
This procedure configures:
-
Xpath
-
Named receiver
-
Protocol
Procedure
|
Step 1 |
Enable privileged EXEC mode. Enter your password, if prompted. Example: |
|
Step 2 |
Enter global configuration mode. Example: |
|
Step 3 |
Create a telemetry subscription and enter telemetry-subscription mode. Example: |
|
Step 4 |
Specify the key-value Google Protocol Buffers (kvGPB) encoding. Example: |
|
Step 5 |
Specify the XPath filter for the subscription. Example: |
|
Step 6 |
Configure the source IP address on the telemetry subscription interface. Example: |
|
Step 7 |
Configure a stream for the subscription. Example: |
|
Step 8 |
Configure a periodic update policy for the subscription. Example: |
|
Step 9 |
Configure type protocol for receiver. Example: |
|
Step 10 |
Specify the receiver name. Example: |
|
Step 11 |
Exit telemetry-subscription configuration mode and return to privileged EXEC mode. Example: |
The device is configured to stream selected data to the named receiver using the specified encoding and update policy.
On-Change Telemetry Support
From Cisco IOS XE Cupertino 17.7.1 onwards, on-change telemetry support is provided to a subset of XPaths.
Supported XPaths for on-change subscription
The tables list the supported XPaths for on-change subscription. Each section provides the relevant gather points, EXEC CLIs, or telemetry feeds associated with Cisco IOS XE YANG models.
Supported gather points and XPaths
This table lists the supported XPaths for on-change subscription.
|
Gather points |
XPaths |
|---|---|
|
/access-point-oper-data/radio-operdata/ |
/access-point-oper-data/radio-operdata/ phy-ht-cfg/cfg-data/curr-freq |
|
/access-point-oper-data/radio-operdata/ phy-ht-cfg/cfg-data/chan-width |
|
|
/access-point-oper-data/radio-oper-data/current-band-id |
|
|
/access-point-oper-data/capwap-data |
/access-point-oper-data/capwap-data/name |
|
/access-point-oper-data/capwapdata/ device-detail/wtp-version/sw-ver/version |
|
|
/access-point-oper-data/capwap- data/device-detail/wtp-version/sw-ver/release |
|
|
/access-point-oper-data/capwapdata/ device-detail/wtp-version/sw-ver/maint |
|
|
/access-point-oper-data/capwapdata/ device-detail/wtp-version/sw-ver/build |
|
|
/access-point-oper-data/capwap-data/ap-state/ap- operation-state |
|
|
/access-point-oper-data/capwapdata/ device-detail/static-info/board-data/wtp-serial-num |
|
|
/access-point-oper-data/oper-data |
/access-point-oper-data/oper-data/ap-ip-data/ap-ip-addr |
|
/access-point-oper-dat/oper-data/ap-pow/power-type |
Supported gather points and XPaths (Cisco-IOS-XE-wireless-ap-global-oper-transform.yang)
|
Gather oints |
XPaths |
|---|---|
|
/ap-global-oper-data/ap-join-stats/wtp-mac |
/ap-global-oper-data/ap-join-stats/ap-join-info/ap-ethernet-mac |
|
/ap-global-oper-data/ap-join-stats/ap-join-info/ap-name |
|
|
/ap-global-oper-data/ap-join-stats/ap-join-info/ap-ip-addr |
|
|
/ap-global-oper-data/ap-join-stats/ap-join-info/is-joined |
|
|
/ap-global-oper-data/ap-join-stats/ap-join-info/last-error-type |
|
|
/ap-global-oper-data/ap-join-stats/ap-disconnect-reason |
Supported gather points and XPaths (Cisco-IOS-XE-aaa-oper.yang)
|
Gather Points |
Xpaths |
|---|---|
|
/aaa-data/aaa-radius-stats/ |
/aaa-data/aaa-radius-stats/radsec-pkt-cnt-idletime |
|
/aaa-data/aaa-radius-stats/radsec-send-hs-start-cnt |
|
|
/aaa-data/aaa-radius-stats/radsec-hs-success-cnt |
|
|
/aaa-data/aaa-radius-stats/radsec-total-tx-pkt-cnt |
|
|
/aaa-data/aaa-radius-stats/radsec-total-rx-pkt-cnt |
|
|
/aaa-data/aaa-radius-stats/radsec-total-conn-rst-cnt |
|
|
/aaa-data/aaa-radius-stats/radsec-conn-rst-cnt-idle /aaa-data/aaa-radius-stats/radsec-conn-rst-cnt-noresp |
|
|
/aaa-data/aaa-radius-stats/radsec-conn-rst-cnt-malpkt |
|
|
/aaa-data/aaa-radius-stats/radsec-conn-rst-cnt-err |
|
|
/aaa-data/aaa-radius-stats/radsec-conn-rst-cnt-peer |
|
|
/aaa-data/aaa-radius-stats/num-aaa-lib-inst |
|
|
/aaa-data/aaa-radius-stats/server-detail |
|
|
/aaa-data/aaa-radius-global-stats |
/aaa-data/aaa-radius-global-stats/access-rejects |
|
/aaa-data/aaa-radius-global-stats/access-accepts |
|
|
/aaa-data/aaa-radius-global-stats/authen-responses-seen |
|
|
/aaa-data/aaa-radius-global-stats/authen-with-response |
|
|
/aaa-data/aaa-radius-global-stats/authen-without-response |
|
|
/aaa-data/aaa-radius-global-stats/authen-avg-response-delay |
|
|
/aaa-data/aaa-radius-global-stats/authen-max-response-delay |
|
|
/aaa-data/aaa-radius-global-stats/authen-timeouts |
|
|
/aaa-data/aaa-radius-global-stats/authen-duplicate-id |
|
|
/aaa-data/aaa-radius-global-stats/authen-bad-authenticators |
|
|
/aaa-data/aaa-radius-global-stats/acct-responses-seen |
|
|
/aaa-data/aaa-radius-global-stats/acct-with-response |
|
|
/aaa-data/aaa-radius-global-stats/acct-without-response |
|
|
/aaa-data/aaa-radius-global-stats/acct-avg-response-delay |
|
|
/aaa-data/aaa-radius-global-stats/acct-max-response-delay |
|
|
/aaa-data/aaa-radius-global-stats/acct-timeouts |
|
|
/aaa-data/aaa-radius-global-stats/acct-duplicate-id |
|
|
/aaa-data/aaa-radius-global-stats/acct-bad-authenticators |
|
|
/aaa-data/aaa-radius-global-stats/stats-time |
Supported EXEC CLIs and XPaths (Cisco-IOS-XE-wireless-mesh-rpc.yang)
|
EXEC CLI |
XPath |
|---|---|
|
ap name <ap-name> [no] mesh ethernet [0|1|2|3] mode trunk vlan allowed <vlan-id> |
/set-rad-mesh-ethernet-trunk-allowed-vlan |
|
ap name <ap-name> [no] mesh ethernet [0|1|2|3] mode trunk vlan native |
/set-rad-mesh-ethernet-trunk-native-vlan |
|
ap name <ap-name> mesh linktest <dst AP MAC> <data rate> <packets/sec> <packet size> <duration> |
/exec-linktest-ap |
|
ap name <ap-name> [no] mesh ethernet [0|1|2|3] mode access <vlan-id> |
/set-rad-mesh-ethernet-access-vlan |
|
ap name <ap-name> [no] mesh block-child |
/set-rad-mesh-block-child |
|
ap name <ap-name> [no] mesh vlan-trunking |
/set-rad-mesh-trunking |
|
ap name <ap-name> [no] mesh daisy-chaining strict-rap |
/set-rad-mesh-daisy-chain-strict-rap |
|
ap name <ap-name> [no] mesh daisy-chaining |
/set-rad-mesh-daisy-chain-mode |
|
ap name <ap-name> [no] mesh parent preferred |
/set-rad-mesh-preferred-parent-ap |
|
ap name <ap-name> mesh backhaul rate dot11ac mcs <mcs-index> ss <1-4> |
/set-rad-mesh-bhaul-tx-rate |
|
ap name <ap-name> mesh backhaul radio dot11 5ghz [slot <slot-id> ] |
/set-rad-mesh-bhaul-radio |
|
ap name <ap-name> mesh security psk provisioning delete |
/set-rad-mesh-security-psk-provisioning-delete |
|
ap name <ap-name> mesh vlan-trunking native <vlan-id> |
/set-rad-mesh-trunking-vlan |
Supported EXEC CLIs and XPaths (Cisco-IOS-XE-aaa-oper.yang)
|
EXEC CLIs |
XPaths |
|---|---|
|
show radius statistic |
/aaa-data/aaa-radius-global-stats/ |
Troubleshooting Telemetry Support
This document outlines a set of commands and procedures to help you systematically gather data and diagnose telemetry-related issues.
Key factors to consider before troubleshooting
-
Provide a clear problem description.
-
Identify any recent changes in the network.
-
Determine the previous known good state.
-
Assess the overall impact of the problem.
Timestamp logging recommendation
Run all the show commands with show clock or terminal exec prompt timestamp once to log timestamps automatically.
General commands for all telemetry cases
For every issue, run these commands:
-
Device# terminal length 0 -
Device# show clock -
Device# show tech-support wireless -
Device# request platform software trace archive last 1
Basic checks for telemetry function
-
Verify that the requisite processes (particularly pubd) are running using this commands:
show platform software yang-management process -
Capture and validate the telemetry-specific configuration using this command:
show running-config | section telemetry -
Check the validity of any subscriptions using this command:
show telemetry ietf subscription all -
Check the validity of any named receivers using this command:
show telemetry receiver all -
Verify the telemetry subscription states using this command:
show telemetry internal subscription all stats
Checking telemetry connectivity
-
Check the state of the subscription receiver using this command:
show telemetry ietf subscription <id> receiver -
Check the state of telemetry connections using the following command:
show telemetry connection all -
Check which subscriptions use a particular connection using the following command:
show telemetry connection <index> subscription
Capture debug logs for telemetry
-
Enable these debug options:
set platform software trace mdt-pubd chassis active r0 mdt-ctrl debug set platform software trace mdt-pubd chassis active r0 pubd debug set platform software trace mdt-pubd chassis active r0 green-be debug set platform software trace mdt-pubd chassis active r0 green-fe debug set platform software trace mdt-pubd chassis active r0 dbal debug set platform software trace mdt-pubd chassis active r0 tdllib debug set platform software trace ios chassis active r0 green-be debug set platform software trace ios chassis active r0 dbal debug set platform software trace ios chassis active r0 tdllib debug -
Recreate the problem.
-
Collect debug logs:
request platform software trace archive last <days> -
Disable debugging using these commands:
set platform software trace mdt-pubd chassis active r0 mdt-ctrl notice
set platform software trace mdt-pubd chassis active r0 pubd notice
set platform software trace mdt-pubd chassis active r0 green-be notice
set platform software trace mdt-pubd chassis active r0 green-fe notice
set platform software trace mdt-pubd chassis active r0 dbal notice
set platform software trace mdt-pubd chassis active r0 tdllib notice
set platform software trace ios chassis active r0 green-be notice
set platform software trace ios chassis active r0 dbal notice
set platform software trace ios chassis active r0 tdllib notice
General telemetry diagnostics
To capture general telemetry diagnostics, use this command:
show telemetry internal diagnosticsGenerate a process core
Generate a core using these commands:
-
show clock -
configure terminal -
service internal -
end -
request platform software process core mdt-pubd chassis active r0
Disable logging
Disable the logging using these commands:
-
configure terminal -
no service internal -
end
Capture CPU and memory data for telemetry processes
To capture CPU memory details use the following commands:
-
show processes cpu platform sorted | i pubd -
show processes memory platform sorted | s pubd
 Feedback