Health monitoring in Firewall Management Center
Health monitoring tracks hardware, software, and critical system functions in Firewall Management Center and its managed appliances. Firewall Management Center runs health modules at configured intervals, evaluates the results, and presents health information for your deployment.
Health monitoring provides two related functions: collecting time series data for metric analysis, and monitoring system health and generating alerts. Use health monitoring to analyze health and performance trends, review health events, identify conditions that require attention, and send selected health notifications to external destinations.
Configure health monitoring
These categories explain various elements of the Firewall Management Center health monitoring model and how they work together.
-
Health policy—Defines what Firewall Management Center monitors for an assigned appliance. A health policy contains enabled health modules and the settings that control how each module operates, such as module-specific criteria, thresholds, and run or collection intervals where applicable. Select modules according to the system conditions and operational outcomes that you need to monitor, and review module applicability before applying the policy. For more information, refer to Health policies.
-
Health module—Tests a specific system function or collects information about it. Alert modules report health status. Metrics modules collect time-series data, and some metrics modules also generate alerts when values cross configured thresholds. For more information, refer to Health modules.
-
Health metrics—Time series data collected over time for a monitored system function. Firewall Management Center displays metrics in health monitor dashboards so that you can analyze changes, trends, and relationships between system conditions.
-
Health status—Indicates the result of a health module test or the compiled condition of a monitored appliance. Health monitor status categories include Error, Critical, Warning, Normal, Recovered, and Disabled as applicable.
-
Health event—A record that Firewall Management Center logs when a health module result meets the configured event conditions. The event contains information about the health module, monitored appliance, reported status, and condition. For more information, refer to Health event views.
-
Health monitor dashboards—Displays the compiled health status for Firewall Management Center and its managed appliances. It also provides an option to create custom dashboards to view specific health information. For more information, refer to About the health monitor.
-
Alert response—Defines how Firewall Management Center sends information to an external destination.
-
Health monitor alert—Associates a severity level, one or more health modules, and an alert response. When the selected severity occurs for a selected module, the health monitor alert triggers its associated alert response. For more information, refer to Health monitor alerts.
Health monitoring scope and behavior
-
Firewall Management Center automatically reports its own status using the modules configured in the default health policy. All appliances automatically report hardware status through the Hardware Alarms health module.
Some health modules, such as the Appliance Heartbeat module, run on Firewall Management Center and report the status of managed devices. To provide managed-device status, health policies must be deployed to the devices.
-
If a health policy enables a module that does not apply to the selected appliance, the health monitor reports that module as Disabled. Review module applicability before applying a policy.
-
In a multidomain deployment, you can view a device's health summary in the domain where the device is located. Health event views allow you to search and analyze the events gathered by the health monitor.
-
In a Firewall Management Center high availability deployment, the active peer creates a health monitor page that uses REST APIs to show detailed metric-based information. The standby peer creates the health monitor page that shows the alert information and provide a visual summary of the status of all appliances on your network using pie charts and status tables. The standby peer does not display the metric-based information.
How health monitoring works
Summary
Health monitoring in Firewall Management Center enables you to track appliance health using policies, modules, metrics, events, and notifications, providing visibility and automated alerting for network conditions.
Workflow
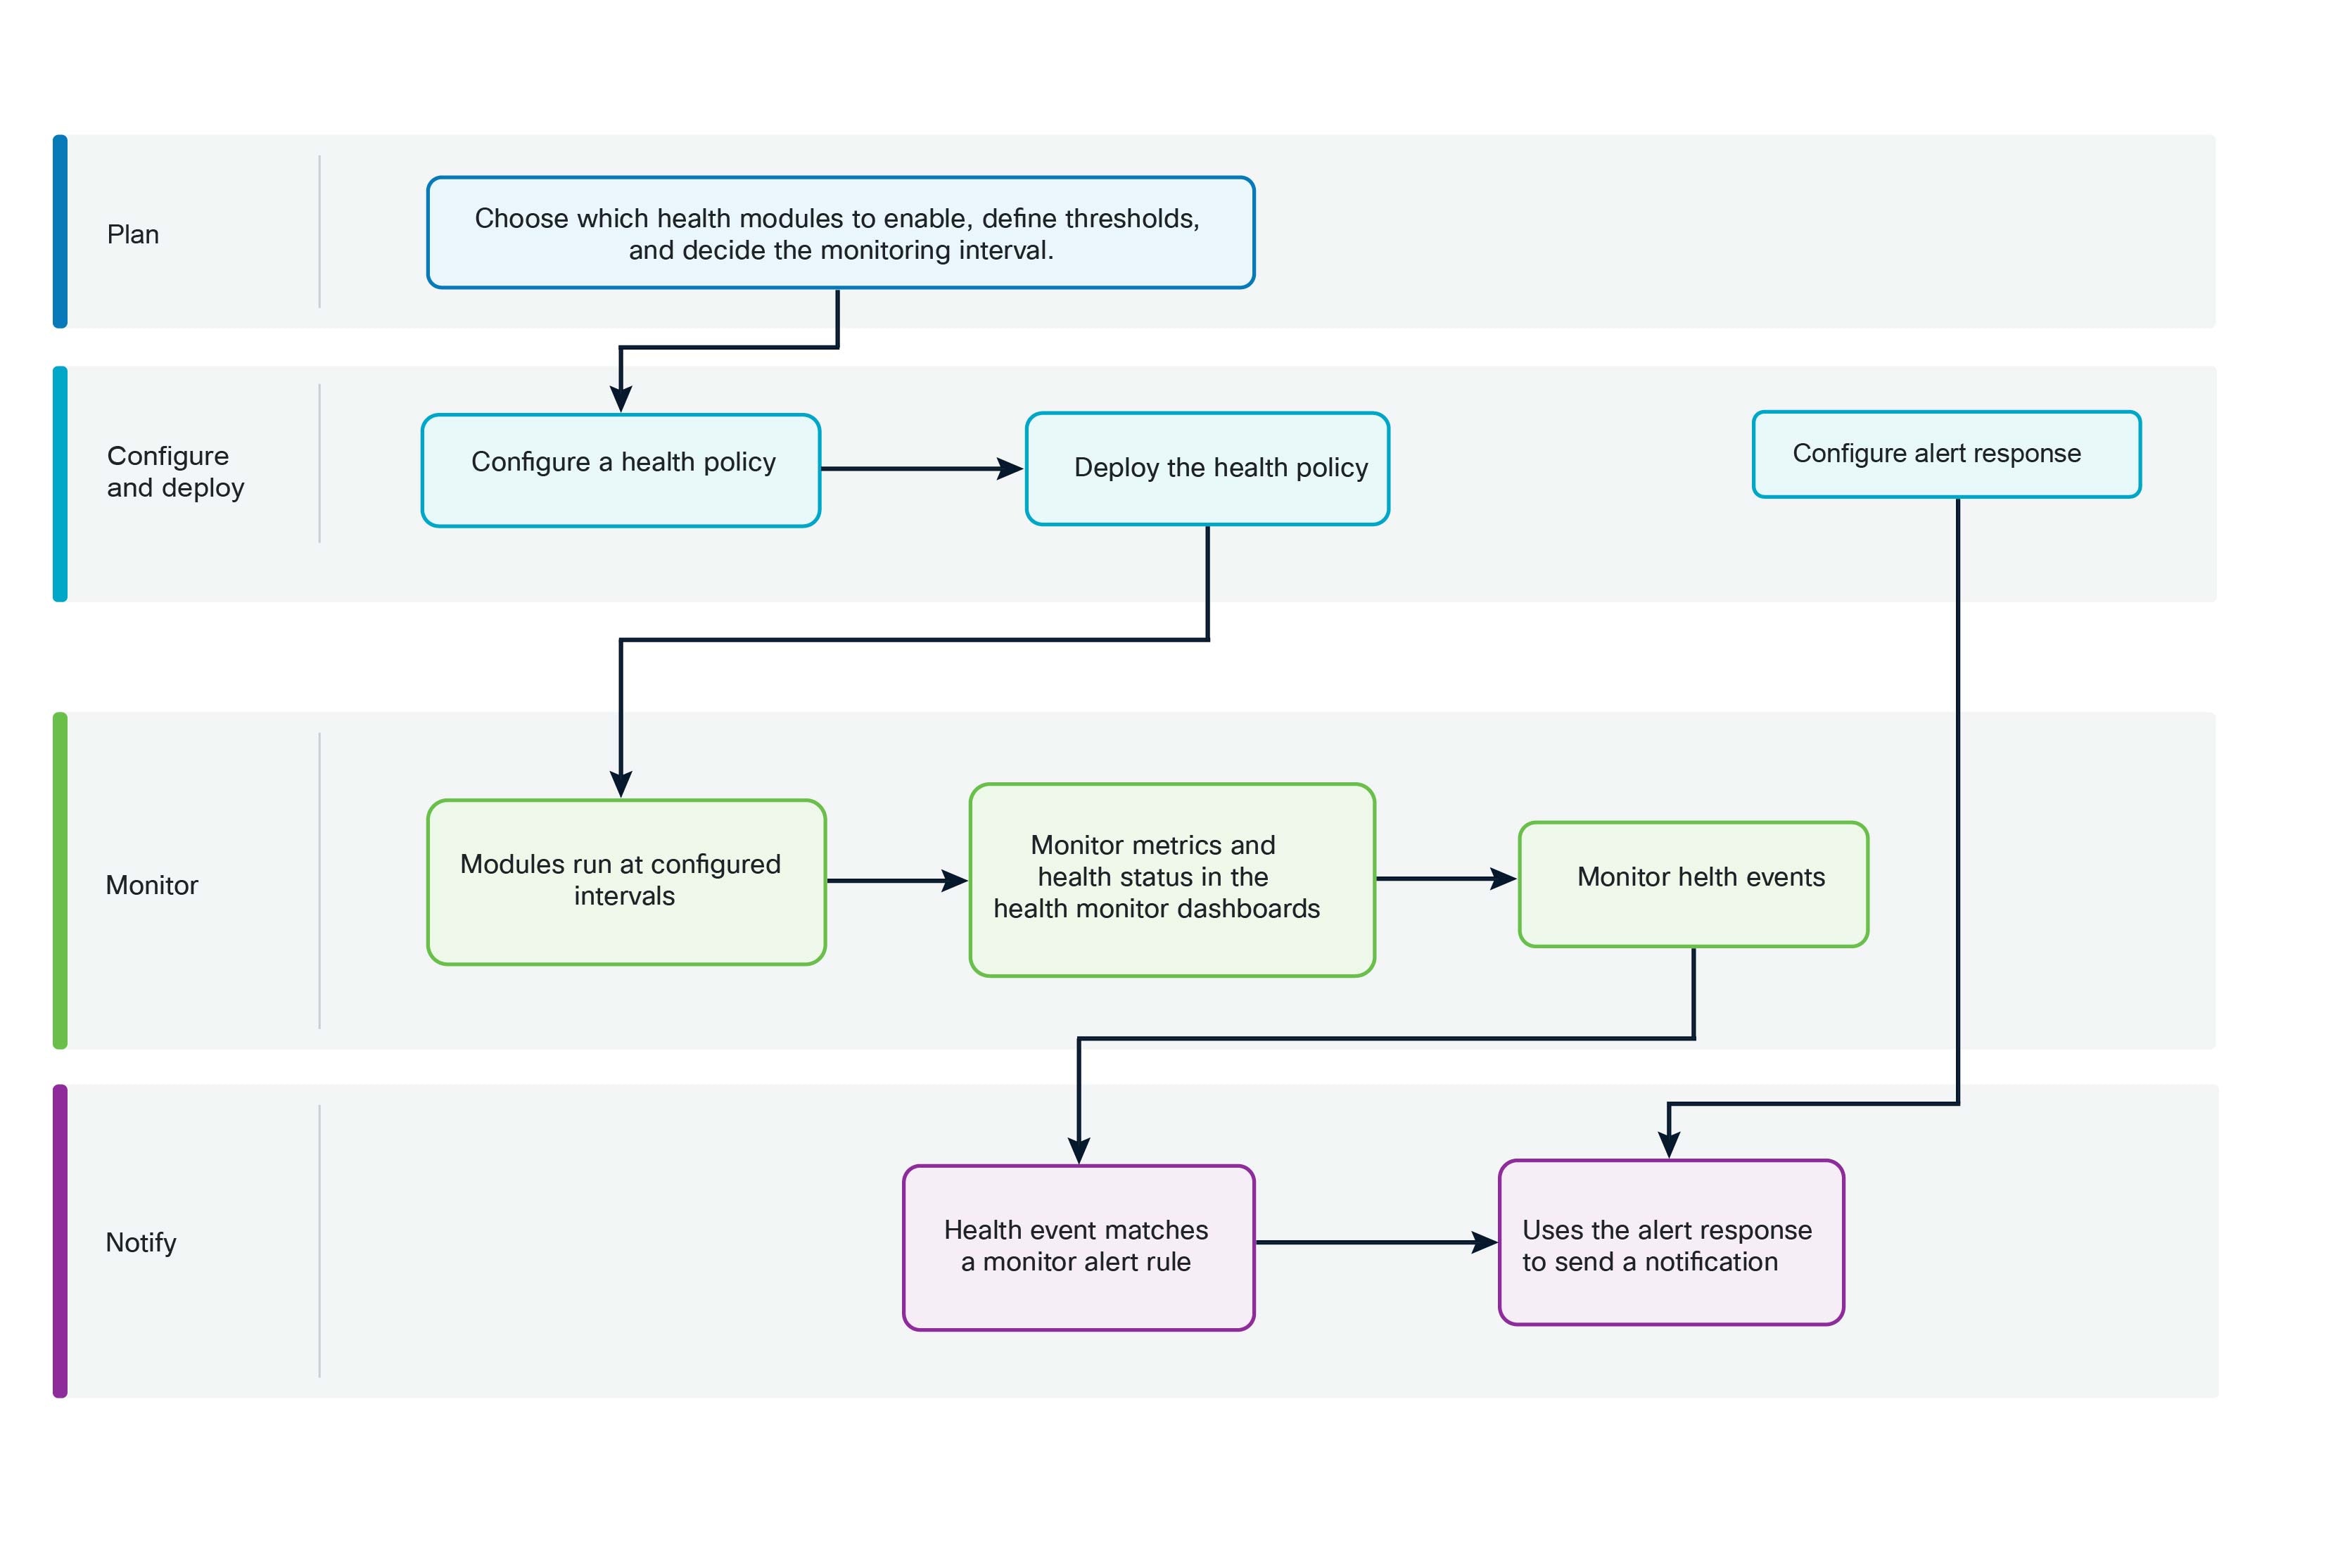
These stages describe how health monitoring information flows from policy configuration to monitoring and notification.
- Choose the health modules that provide the health metrics and alerts required for your monitoring goal. Check that each module supports your appliance type and review its configuration requirements, dependencies, and available thresholds. For more information, refer to Health modules.
- Create or modify a health policy. Enable the selected health modules and configure their settings, run intervals, and thresholds where needed. For more information, refer to Health policies.
- Deploy the health policy to the appropriate managed appliances. Monitoring begins after you successfully deploy the health policy.
- The enabled health modules run at the intervals configured in the health policy. A module can collect metric data, report a health alert, or perform both functions, depending on the module.
- Firewall Management Center displays health statuses and metrics in the health monitor dashboards. Metric data supports analysis over time; it does not necessarily produce a health event for every collected value. For more information, refer to About the health monitor.
- When a module result meets the conditions configured for event generation, Firewall Management Center logs a health event. Note that the health event logs the condition in Firewall Management Center and does not, by itself, send an external notification.
- Firewall Management Center evaluates the health event against configured health monitor alerts. When the event's module and severity match a health monitor alert, Firewall Management Center invokes the alert response associated with that alert.
- The alert response delivers the notification to its configured destination, such as an email server or webhook endpoint.
Result
During operation, you can run all health modules, or a specific module, on demand to investigate a condition. You can also exclude appliances or health modules if you do not want them to generate health information.
Your health policy determines what Firewall Management Center monitors and how often it evaluates the condition. The health monitor displays the results. The health event records a qualifying condition. The health monitor alert determines which conditions require notification, and the alert response determines how and where the notification is delivered.
Health modules
Describes health modules that monitor system conditions and provide alerts or metrics for managing device health and performance.
Health modules, or health tests, test for the conditions that you specify in a health policy.
Health monitoring includes both health alerts or tests and metric or time series data collection. The two types of health modules are alert modules and metrics modules. Alerts modules (sometimes called legacy modules) monitor system infrastructure and report only the health status. When the conditions specified in the health policy for these monitored systems are met, these modules raise health alerts. Metrics modules (sometimes called telegraf modules) collect statistics (sometimes called time series data) that you can view on the health monitoring dashboard. Some alerts are also generated from metric values when they cross the thresholds specified in the health policy. You can create custom dashboards with your preferred health metrics, allowing you to monitor statistics or troubleshoot appliance health issues.
 Note |
The health alerts generated from the Secure Firewall 200 series device is limited to the essential health modules, to optimize performance and ensure effective resource utilization. For more information about the available health modules, refer to Health alerts for Secure Firewall 200 Series device. |
|
Module |
Type |
Description |
||
|---|---|---|---|---|
|
AMP Connection Status |
Metrics |
The module alerts if the device cannot connect to the AMP cloud or Cisco AMP Private Cloud after an initial successful connection, or if the private cloud cannot contact the public AMP cloud. Disabled by default. |
||
|
AMP Threat Grid Connectivity |
Metrics |
The module alerts if the device cannot connect to the AMP Threat Grid cloud after an initial successful connection. |
||
|
ASP Drop |
Alert |
Monitors the connections dropped by the data plane accelerated security path. You can configure this module to generate alerts for selected metrics individually. The module monitors these metrics and detects failures if the difference between ASP drop counter values at any two timestamps exceeds a specified threshold. |
||
|
Automatic Application Bypass |
Alert |
Monitors bypassed detection applications. |
||
|
Certificate Monitoring |
Alert |
Alerts when service authentication certificates are near expiration or have expired, based on a configurable threshold (in days). This alert helps you to identify certificates that are about to expire and renew them before a service disruption occurs. |
||
|
Chassis Environment Status |
Alert |
Monitors chassis parameters such as fan speed and chassis temperature, and enables you to set a warning threshold and critical
threshold for temperature. The Critical Chassis Temperature (Celsius) default value is By default, the CPU temperature threshold for the Firepower 1010 is |
||
|
Cluster/HA Failover Status |
Alert |
For threat defense clusters, alerts when a unit joins, leaves, or is elected primary. |
||
|
Configuration Resource Utilization |
Alert |
Alerts if the size of your deployed configurations puts a device at risk of running out of memory. The alert shows you how much memory your configurations require, and by how much this exceeds the available memory. If this happens, reevaluate your configurations. You may be able to reduce the number or complexity of access control rules or intrusion policies. |
||
|
Connection Statistics |
Metrics |
Monitors connection statistics and NAT translation counts. For standby Firewall Threat Defense devices in a high availability pair, this widget reflects only the statistics of connections replicated from the active device. |
||
|
CPU Core Usage |
Metrics |
Alerts when CPU core use exceeds a configurable threshold. This module allows you to enable or disable receiving health alerts without interrupting the collection of metrics. |
||
|
Critical Process Statistics |
Metrics |
Monitors the state of critical processes, their resource consumption, and the restart counts. |
||
|
Database |
Alert |
Note that the Secure Firewall 200 series device raises alerts only for database integrity issues related to schema or configuration data. |
||
|
Data Plane CPU Usage |
Metrics |
Alerts when data plane CPU use exceeds a configurable threshold. This module allows you to enable or disable receiving health alerts without interrupting the collection of metrics. |
||
|
Data Plane Memory Usage |
Metrics |
Alerts when data plane memory use exceeds a configurable threshold. This module allows you to enable or disable receiving health alerts without interrupting the collection of metrics. |
||
|
Deployed Configuration Statistics |
Metrics |
Monitors statistics about the deployed configuration, such as the number of ACEs and IPS rules. |
||
|
Disk Status |
Alert |
Alerts if there is an issue with the hard disk or RAID controller. If this module alerts, contact Cisco TAC. This will prevent upgrade. |
||
|
Disk Usage |
Metrics |
This module compares disk usage on the appliance’s hard drive to the limits configured for the module and alerts when usage exceeds the thresholds configured for the module. This module also alerts when the system excessively deletes files in monitored disk usage categories, or when disk usage excluding those categories reaches excessive levels, based on module thresholds. For more information, refer to Disk usage and drain of events health monitor alerts for information about troubleshooting scenarios for Disk Usage alerts. The Disk Usage module sends a health alert if the size of device configuration history files exceeds the allowed limit. For more information, refer to Disk Usage for Device Configuration History Files Health Monitoring Alert for information about troubleshooting scenarios for the disk usage alerts. This health alert is not supported on Secure Firewall Management Center Versions 7.2.0-7.2.5, 7.3.x, and 7.4.0. Use the Disk Usage health status module to monitor disk usage for the
Use the Clear disk space option to free up disk space by removing the temporary files from your threat defense device. For more information, refer to Clear disk space |
||
|
File System Integrity Check |
Alert |
This module performs a file system integrity check and runs if the system has CC mode or UCAPL mode enabled, or if the system runs an image signed with a DEV key. |
||
|
Firewall Threat Defense HA |
Alert |
Alerts if a threat defense high availability pair is split brain. |
||
|
Firewall Threat Defense Platform Faults |
Alert |
Monitors Secure Firewall 1000 /3100 /4200 /6100 platform faults and generate health alerts for the faults. A platform fault represents a failure in the Firewall Threat Defense instance or an alarm threshold that has been raised. During the lifecycle of a platform fault, it can change from one state or severity to another. Each fault includes information about the operational state of the affected object at the time the fault was raised. If the fault is transitional and the failure is resolved, then the object transitions to a functional state. For more information, refer to Cisco Firepower 1000/2100 FXOS Faults and Error Messages Guide. |
||
|
Flow Offload Statistics |
Metrics |
Monitors hardware flow offload. |
||
|
FXOS Health |
Alert |
Alerts when the FXOS https service is not running on the device. This will prevent upgrade. |
||
|
Hardware Alarms |
Alert |
This module determines if hardware needs to be replaced on a physical managed device and alerts based on the hardware status. It also reports on the status of hardware-related daemons. |
||
|
Identity Limits Monitor (supported only on Secure Firewall 200 Series devices) |
Alert |
Alerts when the device identity-related mappings and user-to-group mappings exceed the normal limit. Device identity-related mappings include user sessions, SGT Exchange Protocol (SXP) mappings, and dynamic object mappings. For more information, refer to Identity-limits-monitor. |
||
|
Inline Link Mismatch Alarms |
Alert |
Alerts if inline pair interfaces negotiate different speeds. |
||
|
Interface Statistics |
Alert |
Determines if the device currently collects traffic and alerts based on the traffic status of physical interfaces and aggregate interfaces. For physical interfaces, the information includes interface name, link state, and bandwidth. For aggregate interfaces, the information includes interface name, number of active links, and total aggregate bandwidth. For subinterfaces, this module reports health alerts in aggregate rather than generating separate alerts for each affected subinterface. If multiple subinterfaces on the same parent interface experience health issues, Firewall Management Center generates a single summarized alert indicating the number of affected subinterfaces for that parent interface. To view the specific status of individual subinterfaces, refer to the Interfaces tab.
|
||
|
Intrusion and File Event Rate |
Alert |
Alerts if intrusion events per second exceed a configurable threshold. We recommend a warning threshold of 1.5 times your average intrusion event rate, and a critical threshold of 2.5 times. For example, for an average event rate on network segment of 20 events per second, we recommend a warning value of 30 and a critical value of 50. The critical limit must be lower than 1000, and higher than the warning limit. Event rates for your devices are available on . If the rate is zero, the Snort process may be down or the device may not be sending events. |
||
|
Link State Propagation |
Alert |
For the ISA 3000, alerts when an interface in a inline set fails. |
||
|
Memory Usage |
Alert |
Alerts when memory use exceeds configurable thresholds. For appliances with more than 4 GB of memory, the preset alert thresholds are based on a formula that accounts for proportions
of available memory likely to cause system problems. On >4 GB appliances, because the interval between Warning and Critical
thresholds may be very narrow, it is recommended that you manually set the Warning Threshold % value to Complex access control policies and rules can command significant resources and negatively affect performance. |
||
|
Network Card Reset |
Alert |
Alerts when a network card restarts due to hardware failure. |
||
|
NTP Statistics |
Metrics |
Monitors NTP synchronization status. Disabled by default. |
||
|
Out of Band Configuration Changes |
Alert |
Monitors configuration changes made on the Firewall Management Center directly using the configure network management-data-interface command. This module alerts when there is a conflict between the existing Firewall Management Center configuration and the out of band configuration changes made. |
||
|
Path Monitoring |
Metrics |
Monitors data path metrics for the interfaces if path monitoring is enabled on the interfaces. |
||
|
Process Status |
Alert |
Alerts when processes on the appliance exit or terminate outside of the process manager. If a process is deliberately exited outside of the process manager, the module status changes to Warning and the health event message indicates which process exited, until the module runs again and the process has restarted. If a process terminates abnormally or crashes outside of the process manager, the module status changes to Critical and the health event message indicates the terminated process, until the module runs again and the process has restarted. |
||
|
Routing Statistics |
Metrics |
Monitors the current state of routing table. |
||
|
SD-WAN Monitoring |
Metrics |
Monitors the application performance metrics of SD-WAN interfaces. |
||
|
Snort 3 Statistics |
Metrics |
Collects Snort 3 statistics for events, flows, and packets. This module also monitors metrics for sending advanced logging events and generates the following alerts:
|
||
|
Snort CPU Usage |
Metrics |
This module checks that the average CPU usage of the Snort processes on the device is not overloaded and alerts when CPU
usage exceeds the percentages configured for the module. The Warning Threshold % default value is |
||
|
Snort Identity Memory Usage |
Alert |
Enables you to set a warning threshold for Snort identity processing and alerts when memory usage exceeds the level configured
for the module. The Critical Threshold % default value is This health module specifically keeps track of the total space used for the user identity information in Snort. It displays the current memory usage details, the total number of user-to-IP bindings, and user-group mapping details. Snort records these details in a file. If the memory usage file is not available, the Health Alert for this module displays Waiting for data. This could happen during a Snort restart due to a new install or a major update, switch from Snort 2 to Snort 3 or back, or major policy deployment. Depending on the health monitoring cycle, and when the file is available, the warning disappears, and the health monitor displays the details for this module with its status turned Green. |
||
|
Snort Memory Usage |
Metrics |
This module checks the percentage of allocated memory used by the Snort process and alerts when memory usage exceeds the
percentages configured for the module. The Warning Threshold % default value is |
||
|
Snort Reconfiguring Detection |
Metrics |
Alerts if a device reconfiguration has failed. This module detects reconfiguration failure for both Snort 2 and Snort 3 instances. |
||
|
Snort Statistics |
Metrics |
Monitors Snort statistics for events, flows, and packets. |
||
|
SSE Connection Status |
Metrics |
The module alerts if the device cannot connect to the security services exchange cloud after an initial successful connection. Disabled by default. |
||
|
System CPU Usage |
Metrics |
This module checks that the average CPU usage of all system processes on the device is not overloaded and alerts when CPU
usage exceeds the percentages configured for the module. The Warning Threshold % default value is |
||
|
Talos Connectivity Status |
Alert |
Monitors connectivity with Talos cloud services, required to periodically update the URL filtering database for URL reputation and categorization. |
||
|
Threat Data Updates on Devices |
Alert |
Certain intelligence data and configurations that devices use to detect threats are updated on the Firewall Management Center from the cloud every 30 minutes. This module alerts you if this information has not been updated on the devices within the time period you have specified. Note that the Secure Firewall 200 series device does not maintain a local URL database and supports Cloud Only lookup. Local URL database related alerts are not available for this device type. Monitored updates include:
By default, this module sends a warning after 1 hour and a critical alert after 24 hours. If this module indicates failure on the Firewall Management Center or on any devices, verify that the Firewall Management Center can reach the devices. |
||
|
VPN Statistics |
Metrics |
Monitors site-to-site and remote access VPN tunnels between Firewall Threat Defense devices. |
||
|
XTLS Counters |
Metrics |
Monitors XTLS/SSL flows, memory and cache effectiveness. Disabled by default. |
|
Module |
Type |
Description |
||
|---|---|---|---|---|
|
Certificate Monitoring |
Alert |
Alerts when service authentication certificates are near expiration or have expired, based on a configurable threshold (in days). To avoid service disruption, renew certificates before they expire. |
||
|
CPU Core Usage |
Metrics |
This module checks that the CPU usage on all the cores is not overloaded and alerts when CPU usage exceeds the thresholds
configured for the module. The Warning Threshold % default value is |
||
|
Critical Process Statistics |
Metrics |
Monitors the state of critical processes, their resource consumption, and the restart counts. |
||
|
CSDAC Dynamic Attributes Connector Status |
Alert |
This module monitors the operational status of the Dynamic Attributes Connector (CSDAC) service in Firewall Management Center and raises an alert if the CSDAC service is not available. If the CSDAC service is not being used by a related service, try disabling and re-enabling it in the Firewall Management Center UI, and check the health alert again after some time. For more information on how to enable CSDAC service, refer to Enable the dynamic attributes connector. If a related service such as an Azure AD realm is configured, you cannot disable the CSDAC service directly. First delete the Azure AD realm and then disable and re-enable the CSDAC service. For more information, refer to Configure realms and directories. |
||
|
Database |
Alert |
Alerts if the configuration database size is too big. It also monitors the system for database schema or configuration data (sometimes called EO ) integrity issues. If this module alerts, contact Cisco TAC. This will prevent upgrade. |
||
|
Discovery Host Limit |
Alert |
This module determines if the number of hosts the Firewall Management Center can monitor is approaching the limit and alerts based on the warning level configured for the module. For more information, refer to Host limits. |
||
|
Disk Status |
Alert |
This module examines the performance of the hard disk and storage pack (if installed) on the appliance. The disk status health module generates a critical alert (red) if either of the following conditions is detected:
All other disk health conditions generate a warning alert (yellow). For further diagnosis of warning conditions, contact Cisco Technical Assistance Center. |
||
|
Disk Usage |
Metrics |
This module compares disk usage on the appliance’s hard drive and malware storage pack to the limits configured for the module and alerts when usage exceeds the thresholds configured for the module. This module also alerts when the system excessively deletes files in monitored disk usage categories, or when disk usage excluding those categories reaches excessive levels, based on module thresholds. Refer to Disk usage and drain of events health monitor alerts for information about troubleshooting scenarios for Disk Usage alerts. The Disk Usage module sends a health alert if the size of device configuration history files exceeds the allowed limit. Refer to Disk Usage for Device Configuration History Files Health Monitoring Alert for information about troubleshooting scenarios for the disk usage alerts. This health alert is not supported on Secure Firewall Management Center Versions 7.2.0-7.2.5, 7.3.x, and 7.4.0. Use the Disk Usage health status module to monitor disk usage for the Use the Clear disk space option to free up disk space by removing the temporary files from your Firewall Management Center. For more information, refer to Clear disk space |
||
|
eStream Status |
Alert |
Monitors connections to third-party client applications that use the Event Streamer on the Firewall Management Center. |
||
|
Event Backlog Status |
Alert |
Alerts if the backlog of event data awaiting transmission from the device to the Firewall Management Center has grown continuously for more than 30 minutes. To reduce the backlog, evaluate your bandwidth and consider logging fewer events. |
||
|
Event Monitor |
Metrics |
This module monitors overall incoming event rate to Firewall Management Center. |
||
|
File System Integrity Check |
Alert |
This module performs a file system integrity check and runs if the system has CC mode or UCAPL mode enabled, or if the system runs an image signed with a DEV key. This module is enabled by default. |
||
|
Firewall Management Center HA Status |
Alert |
Monitors Firewall Management Center high availability. This module generates alerts if the HA pairs are not synchronized and if there is a discrepancy in the number of managed devices between the active and standby units. |
||
|
Firewall Threat Defense HA Status |
Alert |
Alerts if a threat defense high availability pair is split brain. |
||
|
Hardware Statistics |
Metrics |
Monitors Firewall Management Center hardware: fan speed, temperature, and power supply. Alerts when values exceed configurable thresholds. |
||
|
Memory Usage |
Alert |
This module compares memory usage on the appliance to the limits configured for the module and alerts when usage exceeds the levels configured for the module. When calculating the memory usage, the Firewall Management Center Memory Usage health module monitors and includes the usage of RAM, swap memory, and cache memory. For appliances with more than 4 GB of memory, the preset alert thresholds are based on a formula that accounts for proportions
of available memory likely to cause system problems. On >4 GB appliances, because the interval between Warning and Critical
thresholds may be very narrow, it is recommended that you manually set the Warning Threshold % value to Beginning with Version 6.6.0, the minimum required RAM for Firewall Management Center Virtual upgrades to Version 6.6.0+ is 28 GB, and the recommended RAM for Firewall Management Center Virtual deployments is 32 GB. We recommend you do not decrease the default settings: 32 GB RAM for most Firewall Management Center Virtual instances, 64 GB for the Firewall Management Center Virtual 300 (VMware only).
Complex access control policies and rules can command significant resources and negatively affect performance. |
||
|
MariaDB Statistics |
Metrics |
Monitors the status of the MariaDB database, including the database size, number of active connections, and memory use. |
||
|
MonetDB Statistics |
Metrics |
MonetDB is the database for firewall events and related data, such as connection summaries. This health module monitors the status of the MonetDB, including its size, the number of active connections, and memory usage. Additionally, it enables you to monitor the number of data requests being processed, and identify any slow-running requests. You can access these metrics and create custom dashboard to monitor MonetDB's health. This module generates an alert if MonetDB is not reachable from the Management Center. This alerting is enabled by default. |
||
|
Passive Identity Agent Status Monitor |
Alert |
Displays connection errors between the Firewall Management Center and the machine on which it's installed. The passive identity agent periodically sends updates to the Firewall Management Center. This health alert is displayed if the Firewall Management Center receives an error from the passive identity agent or if the Firewall Management Center has not received an update or response for five minutes or longer. Try verifying the connection between the two, restarting the passive identity agent software, and checking the health alert again in a few minutes. If issues persist, check the configuration at . |
||
|
RabbitMQ Status |
Metrics |
Monitors and collects RabbitMQ statistics. |
||
|
Realm |
Alert |
Allows you to set a warning threshold for realm or user mismatches, which are:
For more information, Cisco Secure Firewall Management Center Device Configuration Guide. This module also displays health alerts when you try to download more users than the maximum number of downloaded users supported per realm. The maximum number of downloaded users for a single realm depends on your management center model. For more information, refer to User Limit in the Cisco Secure Firewall Management Center Device Configuration Guide. |
||
|
RRD Server Process |
Alert |
Alerts if the round robin data (RRD) server that stores time series data has restarted since the last time it updated. You can configure additional warning and critical thresholds for consecutive restarts. |
||
|
Talos Connectivity Status |
Alert |
Monitors connectivity with Talos, required to download URL filtering and event enrichment data. |
||
|
Time Series Data (RRD ) Monitor |
Alert |
This module tracks the presence of corrupt files in the directory where time series data (such as correlation event counts) are stored and alerts when files are flagged as corrupt and removed. |
||
|
Time Server Status |
Alert |
This module monitors the configuration of the NTP servers and alerts when the NTP server is unavailable or if the NTP server configuration is invalid. If you receive critical alert from this module, choose and check the configuration of the NTP server specified in the alert. |
||
|
Web Server Connection Statistics |
Metric |
Alerts you when a single IP address exceeds the configurable limit of concurrent HTTP or HTTPS connections to the management center web server. It warns you when maximum number of browser tabs are opened to connect to management center from single IP address, ensuring optimal performance. |
||
|
Zero-Touch Provisioning |
Alert |
Alerts if there is a failure when registering a device using the serial number. It also shows errors related to zero-touch provisioning capable Firewall Management Center s in high availability. |


 )
)

 )
)

 )
)
 Feedback