Connection logging
Connection logging is a system feature that
-
generates logs of connections detected by managed devices known as connection events,
-
provides granular control through rules and policies over which connections to log, when to log them, and where to store the data, and
-
creates special connection events called security-related connection events that represent connections blocked by the reputation-based Security Intelligence feature.
Connection event data
Connection events contain data about the detected sessions. The specific data available for any event can vary, but generally includes:
-
Basic connection properties: timestamp, source and destination IP address, ingress and egress zones, the device that handled the connection, and so on
-
Additional connection properties discovered or inferred by the system: applications, requested URLs, or users associated with the connection, and so on
-
Metadata about why the connection was logged: which configuration handled the traffic, whether the connection was allowed or blocked, details about encrypted and decrypted connections, and so on
Log connections according to the security and compliance needs of your organization. When setting up connection logging, remember that the system can log a connection for multiple reasons. Disabling logging in one place does not guarantee that matching connections will not get logged elsewhere.
The information contained in a connection event depends on factors such as traffic characteristics and relevant configuration.
 Note |
You can supplement the connection logs gathered by your managed devices with connection data generated from exported NetFlow records. This is particularly useful if you have NetFlow-enabled routers or other devices monitoring networks that managed devices cannot access. |
Logged connections
Logged connections are network connections that
-
are automatically saved to the Firewall Management Center database as end-of-connection events,
-
generate logs regardless of other logging configurations unless connection event storage is disabled, and
-
include connections associated with intrusions, file and malware events, intelligent application bypass, and monitored traffic.
Connection types and logging behavior
The system automatically logs specific connection types based on their association with security events and traffic monitoring.
Connection types that generate automatic logs:
-
Connections associated with intrusions: The system automatically logs connections associated with intrusion events, unless the connection is handled by the access control policy's default action.
-
Connections associated with file and malware events: The system automatically logs connections associated with file and malware events.
-
Connections associated with intelligent application bypass: The system automatically logs bypassed and would-have-bypassed connections associated with IAB.
-
Monitored connections: The system always logs the ends of connections for monitored traffic, even if the traffic matches no other rules and you do not enable default action logging.
Note |
File events generated by inspecting NetBIOS-SSN (SMB) traffic do not immediately generate connection events because the client and server establish a persistent connection. The system generates connection events after the client or server ends the session. |
Special behavior for default action connections:
-
When an intrusion policy associated with the access control default action generates an intrusion event, the system does not automatically log the end of the associated connection. Instead, you must explicitly enable default action connection logging.
-
However, if you enable beginning-of-connection logging for the default action, the system does log the end of the connection when an associated intrusion policy triggers, in addition to logging the beginning of the connection.
For more information about monitored connections, refer to Logging for monitored connections.
Other Connections You Can Log
So that you log only critical connections, enable connection logging on a per-rule basis. If you enable connection logging for a rule, the system logs all connections handled by that rule.
You can also log connections handled by policy default actions. Depending on the rule or default action (and for access control, a rule's inspection configuration), your logging options differ.
Prefilter Policy: Rules and Default Action
You can log connections (including entire plaintext, passthrough tunnels) that you fastpath or block with a prefilter policy.
Prefiltering uses outer-header criteria to handle traffic. For tunnels that you log, the resulting connection events contain information from the outer, encapsulation headers.
For traffic subject to further analysis, logging in the prefilter policy is disabled, although matching connections may still be logged by other configurations. The system performs all further analysis using inner headers, that is, the system independently handles and logs each connection within an allowed tunnel.
Decryption Policy: Rules and Default Action
You can log connections that match a decryption rule or decryption policy default action.
For blocked connections, the system immediately ends the session and generates an event. For monitored connections and connections that you pass to access control rules, the system generates an event when the session ends.
Access Control Policy: Security Intelligence Decisions
You can log a connection whenever it is blocked by the reputation-based Security Intelligence feature.
Optionally, and recommended in passive deployments, you can use a monitor-only setting for Security Intelligence filtering. This allows the system to further analyze connections that would have been blocked by Security Intelligence, but still log the match. Security Intelligence monitoring also allows you to create traffic profiles using Security Intelligence information.
When the system logs a connection event as the result of Security Intelligence filtering, it also logs a matching Security Intelligence event, which is a special kind of connection event that you can view and analyze separately, and that is also stored and pruned separately. So that you can identify the matching IP address in the connection, host icons beside blocked and monitored IP addresses look slightly different in the tables on the pages under the menus.
Access Control Policy: Rules and Default Action
You can log connections that match an access control rule or access control policy default action.
Rules and policy actions effect on logging
Rules and policy actions effect on logging is a traffic handling mechanism that
-
determines how the system inspects and handles matching traffic,
-
controls when and how details about matching traffic can be logged, and
-
provides metadata about why the connection was logged, including which configurations handled the traffic.
Connection event metadata
Connection events contain metadata about why the connection was logged, including which configurations handled the traffic. Where you can configure connection logging, rule actions, and policy default actions determine not only how the system inspects and handles matching traffic, but also when and how you can log details about matching traffic.
Logging for fastpathed connections
Logging for fastpathed connections is a monitoring capability that
-
records connection events for traffic that matches tunnel rules and prefilter rules with Fastpath actions
-
captures information for non-encrypted tunnels including outer session details for tunnel rules, and
-
provides limited information in connection events since fastpathed traffic bypasses access control and QoS processing.
Supported traffic types
You can log fastpathed connections and non-encrypted tunnels, which includes traffic matching these rules and actions in the prefilter policy:
-
Tunnel rules—Fastpath action (logs the outer session)
-
Prefilter rules—Fastpath action
Fastpathed traffic bypasses the rest of access control and QoS, so connection events for fastpathed connections contain limited information.
Logging for monitored connections
Logging for monitored connections is a system function that
-
automatically logs connection ends for traffic matching specific monitoring configurations,
-
operates independently of default action logging settings, and
-
consolidates multiple Monitor rule matches into single connection events.
Monitored traffic configurations
The system always logs the ends of connections for traffic matching these configurations, even if the traffic matches no other rules and you do not enable default action logging:
-
Security Intelligence: Block lists set to monitor (also generates a Security Intelligence event)
-
SSL rules: Monitor action
-
Access control rules: Monitor action
The system does not generate a separate event each time a single connection matches a Monitor rule. Because a single connection can match multiple Monitor rules, each connection event can include and display information on the first eight Monitor access control rules that the connection matches, as well as the first matching SSL Monitor rule.
Similarly, if you send connection events to an external syslog or SNMP trap server, the system does not send a separate alert each time a single connection matches a Monitor rule. Rather, the alert that the system sends at the end of the connection contains information on the Monitor rules the connection matched.
Logging for trusted connections
Logging for trusted connections is a system capability that
-
records the beginnings and ends of trusted connections for traffic matching access control rules with Trust action
-
captures events for traffic matching the access control default action Trust All Traffic, and
-
generates limited information because trusted connections are not subject to deep inspection or discovery.
Trusted connection logging behavior
You can log the beginnings and ends of trusted connections, which includes traffic matching these rules and actions:
-
Access control rules: Trust action
-
Access control default action: Trust All Traffic
Note |
Although you can log trusted connections, we recommend you do not do so because trusted connections are not subject to deep inspection or discovery, so connection events for trusted connections contain limited information. |
TCP connections detected by a Trust rule on the first packet generate only an end-of-connection event. The system generates the event one hour after the final session packet.
Logging for blocked connections
Logging for blocked connections is a security feature that
-
records traffic matching blocking rules and actions across multiple policy types,
-
generates connection events with different timing based on the blocking mechanism, and
-
provides visibility into denied traffic for security monitoring and analysis.
Blocked connection types
You can log blocked connections, which includes traffic matching these rules and actions:
-
Tunnel rules—Block
-
Prefilter rules—Block
-
Prefilter default action—Block all tunnel traffic
-
Security Intelligence—Block lists not set to Monitor (also generates a Security Intelligence event)
-
Decryption rules—Block and Block with reset
-
SSL default action—Block and Block with reset
-
Access control rules—Block, Block with reset, and Interactive Block
-
Access control default action—Block All Traffic
Only devices deployed inline (that is, using routed, switched, or transparent interfaces, or inline interface pairs) can block traffic. Because blocked connections are not actually blocked in passive deployments, the system may report multiple beginning-of-connection events for each blocked connection.
 Caution |
Firewall Threat Defense device logs end-of-connection events for TCP connections where the three-way handshake does not complete, including SYN-only, SYN-SYN/ACK (no ACK), and SYN-RST/ACK scenarios (except when TLS Identity is enabled). These logs provide visibility into incomplete or suspicious connection attempts. However, logging blocked TCP connections during a Denial of Service (DoS) attack can affect system performance and overwhelm the database with multiple similar events. Before you enable logging for a Block rule, consider whether the rule monitors traffic on an Internet-facing interface or other interface vulnerable to DoS attack. |
Beginning vs end-of-connection logging for blocked connections
When you log a blocked connection, how the system logs it depends on why the connection was blocked; this is important to keep in mind when configuring correlation rules based on connection logs:
-
For decryption rules and decryption policy default actions that block encrypted traffic, the system logs end-of-connection events. This is because the system cannot determine if a connection is encrypted using the first packet in the session.
-
For other blocking actions, the system logs beginning-of-connection events. Matching traffic is denied without further inspection.
Logging bypassed interactive blocks
Interactive blocking access control rules, which cause the system to display a warning page when a user browses to a prohibited website, allow you to configure end-of-connection logging. This is because if the user clicks through the warning page, the connection is considered a new, allowed connection which the system can monitor and log.
Therefore, for packets that match an Interactive Block or Interactive Block with Reset rule, the system can generate these connection events:
-
A beginning-of-connection event when a user's request is initially blocked and the warning page is displayed; this event has an associated action of Interactive Block or Interactive Block with Reset
-
Multiple beginning- or end-of-connection events if the user clicks through the warning page and loads the originally requested page; these events have an associated action of Allow and a reason of User Bypass
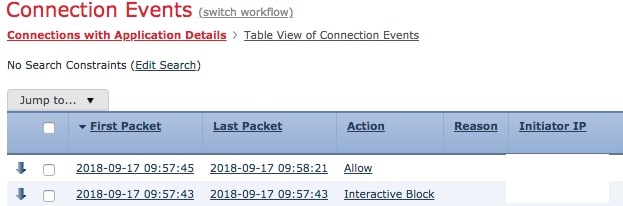
Interactive block example
The following figure shows an example of an interactive block followed by allow.
Logging for allowed connections
Logging for allowed connections is a security feature that
-
generates file and malware events when file policies detect or block files during traffic inspection, and
-
provides configurable logging options on a per-access-control-rule basis.
Connection logging details
You can log allowed connections, which includes traffic matching the following rules and actions:
-
SSL rules—Decrypt action
-
SSL rules—Do not decrypt action
-
SSL default action—Do not decrypt
-
Access control rules—Allow action
-
Access control default action—Network Discovery Only and any intrusion prevention option
Enabling logging for these configurations ensures the connection is logged, while also permitting (or specifying) the next phase of inspection and traffic handling. SSL logging is always end-of-connection; access control configurations also allow beginning-of-connection logging.
Although the Analyze action in tunnel and prefilter rules also allows connections to continue with access control, logging is disabled for rules with this action. Matching connections may still be logged by other configurations. Allowed tunnels might have their encapsulated sessions evaluated and logged individually.
When you allow traffic with an access control rule or default action, you can use an associated intrusion policy to further inspect traffic and block intrusions. For access control rules, you can also use a file policy to detect and block prohibited files, including malware. Unless you disable connection event storage, the system automatically logs most allowed connections associated with intrusion, file, and malware events. For detailed information, refer to Logged connections.
Connections with encrypted payloads are not subject to deep inspection, so connection events for encrypted connections contain limited information.
When a file policy detects or blocks a file, it logs one of these events to the Firewall Management Center database:
-
File events, which represent detected or blocked files, including malware files.
-
Malware events, which represent detected or blocked malware files only.
-
Retrospective malware events, which are generated when the malware disposition for a previously detected file changes.
You can disable this logging on a per-access-control-rule basis. You can also disable file and malware event storage entirely.
Note |
We recommend you leave file and malware event logging enabled. |
Connection logging modes
A connection logging mode is a connection monitoring approach that
-
provides two distinct timing options for capturing connection events,
-
handles blocked traffic differently than allowed traffic, and
-
requires optimization choices to balance performance with information completeness.
Connection logging timing and exceptions
You can log a connection at its beginning or its end, with specific exceptions for blocked traffic:
-
Blocked traffic: Because blocked traffic is immediately denied without further inspection, only beginning-of-connection events are typically available for logging; there is no unique end-of-connection to log.
-
Blocked encrypted traffic: When you enable connection logging in a decryption policy, the system logs end-of-connection rather than beginning-of-connection events. This occurs because the system cannot determine if a connection is encrypted with the first packet and therefore cannot immediately block encrypted sessions.
To optimize performance, log either the beginning or the end of any connection, but not both. Monitoring a connection for any reason forces end-of-connection logging. For a single non-blocked connection, the end-of-connection event contains all information present in the beginning-of-connection event, as well as data gathered over the duration of the session.
The table presents differences between beginning and end-of-connection events, along with the advantages of logging each.
|
Attributes |
Beginning-of-Connection Events |
End-of-Connection Events |
||
|---|---|---|---|---|
|
Can be generated... |
When the system detects the beginning of a connection (or, after the first few packets if event generation depends on application or URL identification). |
When the system:
|
||
|
Can be logged for... |
All connections except those blocked by the decryption policy. |
Most connections. |
||
|
Contain... |
Only information that can be determined in the first packet (or the first few packets, if event generation depends on application or URL identification). |
All information in the beginning-of-connection event, plus information determined by examining traffic over the duration of the session; for example, the total amount of data transmitted or the timestamp of the last packet in the connection.
|
||
|
Are useful... |
If you want to log:
|
If you want to:
|
Secure Firewall Management Center vs external logging
A log storage option in the Firewall Management Center enables analysis of connection and Security Intelligence event logs through dashboards, event views, traffic profiling, and correlation policies. The number of stored events depends on the model. Logging usually occurs at connection end, with critical connections logged automatically. Events can also be sent externally via syslog or SNMP traps using alert responses or specific configurations, influencing log storage and processing methods.
Secure Firewall Management Center logging features
If you store connection and Security Intelligence event logs on the Firewall Management Center, you can use the system's reporting, analysis, and data correlation features. For example:
-
Dashboards and the Context Explorer provide you with graphical, at-a-glance views of the connections logged by the system.
-
Event views (most of the options available under the Analysis menu) present detailed information on the connections logged by the system, which you can display in a graphical or tabular format or summarize in a report.
-
Traffic profiling uses connection data to create a profile of your normal network traffic that you can then use as a baseline against which to detect and track anomalous behavior.
-
Correlation policies allow you to generate events and trigger responses (such as alerts or external remediations) to specific types of connections or traffic profile changes.
The number of events the Firewall Management Center can store depends on its model.
Note |
To use these features, you must log connections (and in most cases, the end of those connections rather than the beginning). This is why the system automatically logs critical connections—those associated with logged intrusions, prohibited files, and malware. |
You can also log events to an external syslog or SNMP trap server, or to other external tools, using these options:
-
For external logging on any device:
A connection you configure called an alert response.
-
For external logging on Firewall Threat Defense devices:
Refer to About Configuring Syslog and Configure SNMP Traps in the Cisco Secure Firewall Management Center Device Configuration Guide.
-
For additional options related to external logging:
Refer to Event Analysis Using External Tools.


 Feedback