Monitor and Troubleshoot Overall Enterprise Health

About Enterprise

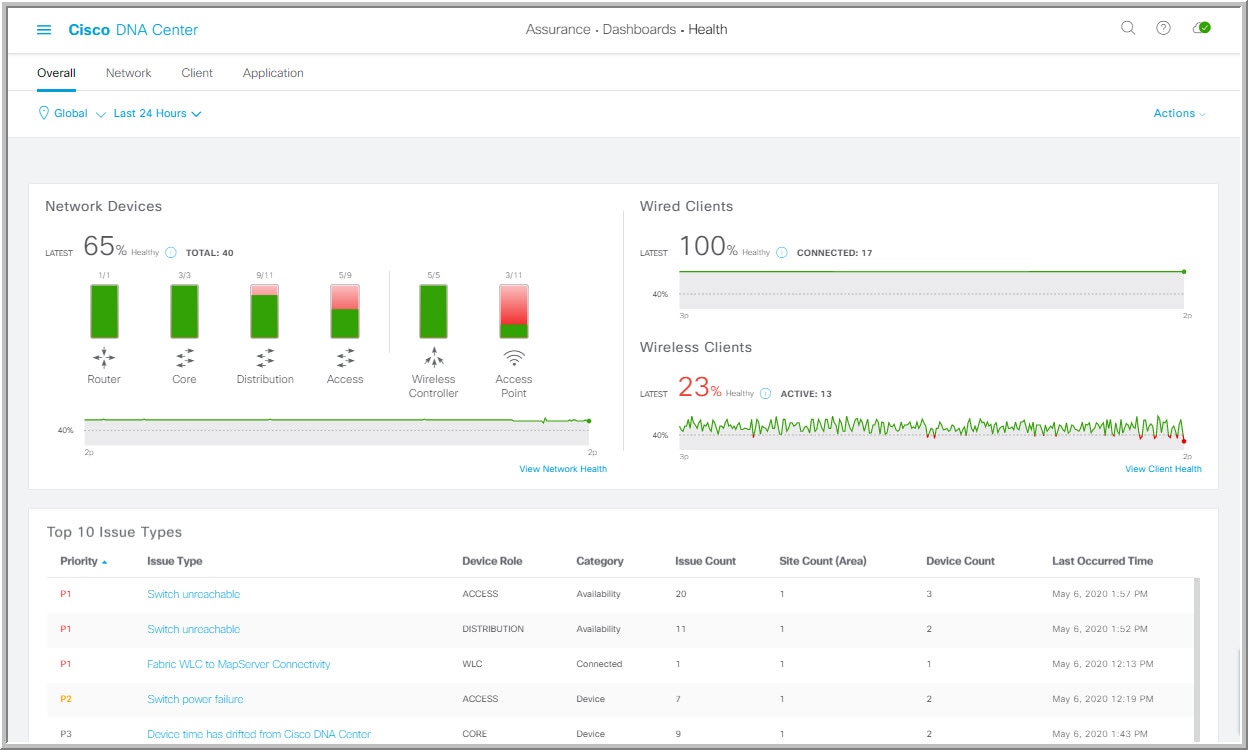
You can use Assurance to monitor and troubleshoot the overall health of your enterprise. An enterprise consists of network devices and clients.

A network consists of one or more devices, including routers, switches, wireless controllers, and access points. Note that clients are not a part of the network health score.

A client is an end device (computer, phone, and so on) that is connected to a network device (access point or switch). Cisco DNA Center supports both wired and wireless clients.

Monitor and Troubleshoot the Overall Health of Your Enterprise

Use this procedure to get a global view of the health of your enterprise, which includes network devices and clients, and to determine if there are potential issues that must be addressed.

Before you begin

Configure Assurance. See Basic Setup Workflow.

Procedure


Step 1

In the Cisco DNA Center GUI, click the Menu icon () and choose Assurance > Health.

The Overall health dashboard appears.

Figure 1. Overall Health Dashboard
Step 2

Use the Overall health dashboard top-menu bar for the following functionality:

Overall Health Dashboard Top-Menu Bar
Item Description

Location pane

Click to display the following icons:

  • : Click this toggle button and use the drop-down list to select Hierarchical Site View or Building View. Based on what you choose, the table displays the percentage of healthy clients and network devices for a specific location.

  • : Click this toggle button to display the health of all the sites in your enterprise on a geographic location-oriented health map. By default, the sites that are represented are color-coded according to the severity of the problem.

    The color of the health score represents its severity. The health is measured on a scale of 1 to 10, where 10 is the best score. A score of 0 indicates that data could not be obtained.

Time range

Enables you to display data for the last 3 hours, 24 hours, or 7 days.

Actions drop-down list

Enables you to customize the dashboard display when you choose Edit Dashboards from the drop-down list. See Change the Position of a Dashlet and Create a Custom Dashboard.

Step 3

Use the Overall Health Summary dashlet for the following functionality:

Overall Health Summary Dashlet
Item Description
Network Devices

Network Score: Percentage of healthy (good) devices (routers, switches, wireless controllers, and access points) in your overall enterprise. See Network Health Score.

Device Category Health Score: Percentage of healthy (good) network devices for the following device categories: Router, Core, Distribution, Access, Controller and Access Point.

Note 

When a Fabric Domain is selected, this area provides percentage of healthy network devices for the following categories: Fabric Edge, Fabric Border, and Fabric Control Plane.

Click View Network Health to open the Network Health dashboard. See Monitor and Troubleshoot the Health of Your Network.

Wired Clients and Wireless Clients

Provides score distribution between wired and wireless clients. The Wired Client score or the Wireless Client score is the percentage of healthy (good) wired or wireless client devices in your overall enterprise. See Client Health Score.

Click View Client Health to open the Client Health dashboard. See Monitor and Troubleshoot the Health of All Client Devices.

Step 4

Use the Top 10 Issue Type dashlet for the following functionality:

Top 10 Issue Type Dashlet

Displays the top 10 issues, if any, that must be addressed. The issues are color coded and sorted by their preassigned priority level, starting with P1.

Click an issue to open a slide-in pane with additional details about the issue type. From the slide-in pane, click an issue instance where you can do the following, as required:

  • To resolve the issue instance, from the Status drop-down list, choose Resolve.

  • To ignore the issue instance:

    1. From the Status drop-down list, choose Ignore.

    2. Set the number of hours to ignore the issue on the slider.

    3. Click Confirm.

Click View All Open Issues to open the Open Issues window.

For information about issues, see View Open Issues.