|
Onboarding
|
802.11r client roaming slowly
|
While roaming, a wireless client capable of fast roaming is doing full authentication instead of fast authentication.
|
|
Onboarding
|
Client DHCP reachability issue
|
The client has failed to obtain an IP address from DHCP server.
|
|
Onboarding
|
Client DNS reachability issue
|
The client failed to obtain a response from the DNS server.
|
|
Onboarding
|
Wireless client excluded - Client was excluded before roaming
|
Wireless client excluded - Client was excluded before roaming.
|
|
Onboarding
|
Wireless client excluded - IP theft issue
|
Wireless client excluded - IP theft issue.
|
|
Onboarding
|
Wireless client failed to connect - AAA server rejected client
|
Wireless client failed to connect - AAA server rejected client.
|
|
Onboarding
|
Wireless client failed to connect - AAA server timeout
|
Wireless client failed to connect - AAA server timeout.
|
|
Onboarding
|
Wireless client failed to connect - Client PMK not found
|
Wireless client failed to connect - Client PMK not found.
|
|
Onboarding
|
Wireless client failed to connect - Client timeout
|
Wireless client failed to connect - Failed to authenticate due to client timeout.
|
|
Onboarding
|
Wireless client failed to connect - DHCP server timeout
|
Wireless client failed to connect - DHCP server timeout.
|
|
Onboarding
|
Wireless client failed to connect - DHCP timeout
|
Wireless client failed to connect - DHCP timeout.
|
|
Onboarding
|
Wireless client failed to connect - Failed to get an IP address due to client timeout
|
Wireless client failed to connect - Failed to get an IP address due to client timeout.
|
|
Onboarding
|
Wireless client failed to connect - Incorrect PSK
|
Wireless client failed to connect and was excluded - The client's PSK did not match the configured WLAN PSK.
|
|
Onboarding
|
Wireless client failed to connect - Security parameter mismatch
|
Wireless client failed to connect - Security parameter mismatch.
|
|
Onboarding
|
Wireless client failed to connect - WLC configuration error
|
Wireless client failed to connect - WLC configuration error.
|
|
Onboarding
|
Wireless client failed to connect - WLC internal error
|
Wireless client failed to connect - WLC internal error.
|
|
Onboarding
|
Wireless client failed to roam - AAA server rejected client
|
Wireless client failed to roam - AAA server rejected client.
|
|
Onboarding
|
Wireless client failed to roam - AAA server timeout
|
Wireless client failed to roam - AAA server timeout.
|
|
Onboarding
|
Wireless client failed to roam - Client PMK not found
|
Wireless client failed to roam - Client PMK not found.
|
|
Onboarding
|
Wireless client failed to roam - Client timeout
|
Wireless client failed to roam - Failed to authenticate due to client timeout.
|
|
Onboarding
|
Wireless client failed to roam - Security parameter mismatch
|
Wireless client failed to roam - Security parameter mismatch.
|
|
Onboarding
|
Wireless client failed to roam - WLC configuration error
|
Wireless client failed to roam - WLC configuration error.
|
|
Onboarding
|
Wireless client failed to roam - WLC internal error
|
Wireless client failed to roam - WLC internal error.
|
|
Onboarding
|
Wireless client failed to roam between APs - External error
|
Wireless client failed to roam between APs - External error.
|
|
Onboarding
|
Wireless client failed to roam between APs - WLC configuration mismatch
|
Wireless client failed to roam between APs - WLC configuration mismatch.
|
|
Onboarding
|
Wireless client took a long time to connect - Excessive time due to authentication timeouts
|
Wireless client took a long time to connect - Excessive time due to authentication timeouts.
|
|
Onboarding
|
Wireless client took a long time to connect - Excessive time due to DHCP server failures
|
Wireless client took a long time to connect - Excessive time due to DHCP server failures.
|
|
Onboarding
|
Wireless client took a long time to connect - Excessive time due to failed credentials
|
Wireless client took a long time to connect - Excessive time due to failed credentials.
|
|
Onboarding
|
Wireless client took a long time to connect - Excessive time due to WLC failures
|
Wireless client took a long time to connect - Excessive time due to WLC failures.
|
|
Onboarding
|
Wireless client took a long time to connect - Excessive time for authentication due to AAA server or network delays
|
Wireless client took a long time to connect - Excessive time for authentication due to AAA server or network delays.
|
|
Onboarding
|
Wireless clients excluded - IP theft issue
|
Wireless clients excluded - IP theft issue.
|
|
Onboarding
|
Wireless clients failed to connect - AAA server rejected clients
|
Wireless clients failed to connect - AAA server rejected clients.
|
|
Onboarding
|
Wireless clients failed to connect - AAA server timeout
|
Wireless clients failed to connect - AAA server timeout.
|
|
Onboarding
|
Wireless clients failed to connect - Client PMK not found
|
Wireless clients failed to connect - Client PMK not found.
|
|
Onboarding
|
Wireless Clients failed to connect - DHCP server timeout
|
Wireless Clients failed to connect - DHCP server timeout.
|
|
Onboarding
|
Wireless clients failed to connect - Failed to authenticate due to client timeouts
|
Wireless clients failed to connect - Failed to authenticate due to client timeouts.
|
|
Onboarding
|
Wireless clients failed to connect - Failed to get an IP address due to client timeouts
|
Wireless clients failed to connect - Failed to get an IP address due to client timeouts.
|
|
Onboarding
|
Wireless clients failed to connect - Failed to get an IP address due to DHCP server or client timeouts
|
Wireless clients failed to connect - Failed to get an IP address due to DHCP server or client timeouts.
|
|
Onboarding
|
Wireless clients failed to connect - Incorrect PSK
|
Wireless clients failed to connect and were excluded - The clients' PSK did not match the configured WLAN PSK.
|
|
Onboarding
|
Wireless clients failed to connect - Security parameter mismatch
|
Wireless clients failed to connect - Security parameter mismatch during authentication.
|
|
Onboarding
|
Wireless clients failed to connect - WLC configuration error
|
Wireless clients failed to connect - WLC configuration error.
|
|
Onboarding
|
Wireless clients failed to roam - Client exclusion policies on the WLC
|
Wireless clients failed to roam - Clients were excluded due to client exclusion policies on the WLC.
|
|
Onboarding
|
Wireless clients failed to roam - Clients were excluded before roaming
|
Wireless clients failed to roam - Clients were excluded before roaming.
|
|
Onboarding
|
Wireless clients failed to roam - WLC configuration mismatch
|
Wireless clients failed to roam between APs - WLC configuration mismatch.
|
|
Onboarding
|
Wireless clients took a long time to connect - Excessive time due to DHCP server failures
|
Wireless clients took a long time to connect - Excessive time due to DHCP server failures.
|
|
Onboarding
|
Wireless clients took a long time to connect - Failed credentials
|
Wireless clients took a long time to connect - Excessive time due to failed credentials.
|
|
Onboarding
|
Wireless clients took a long time to connect - WLC failures
|
Wireless clients took a long time to connect - Excessive time due to WLC failures.
|
|
Connected
|
Dual band capable client prefers 2.4 GHz over 5 GHz
|
Dual-band capable client is consistently connecting to a 2.4-GHz radio, even though a 5-GHz radio that provides a better experience
is available.
|
|
Connected
|
Wireless client has poor RF
|
Wireless client is experience poor RF condition because the client has no better neighboring APs to roam to.
|
|
Connected
|
Wireless client shows sticky behavior
|
Wireless client is maintaining an association with an AP that has a weaker signal. It should roam to an available AP that
has the stronger signal.
|

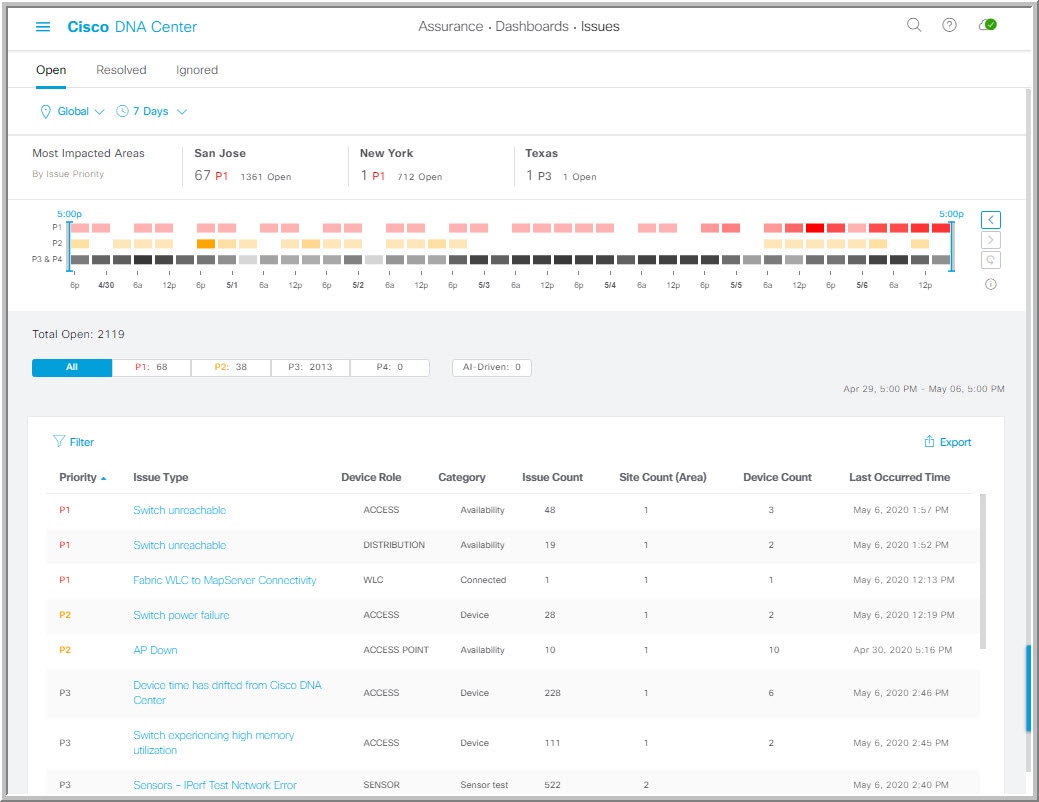


 : P1
: P1
 : P2
: P2
 : P3 and P4
 icon to provide your comments on whether the information on this page was helpful, and then click
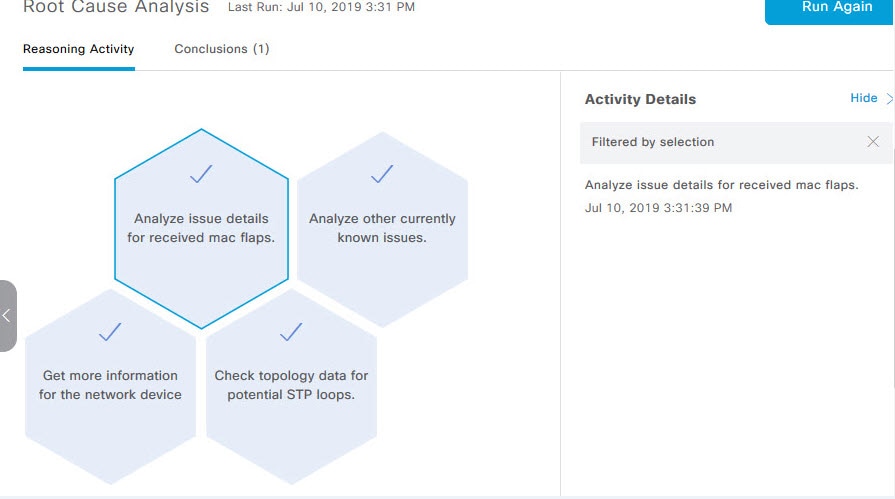
 icon to view the topology of the network segment in which the loop occurred.
 ) to display the affected device types.
 Feedback