Monitor Crosswork Server Activation
This topic explains how to monitor and verify that the Crosswork server installation has completed successfully.
As the installer builds and configures the VM, it will report progress. The installer will prompt you to accept the license agreement and then ask if you want to continue the installation. After you confirm that you want to continue, the installation will progress and any errors will be logged in the installer.log or installer_tf.log files. If the VM is built and is able to boot, any errors in applying the operator-specified configuration will be logged on the VM in the /var/log/firstboot.log file.
About the administrative user ID
During installation, Crosswork will create a special administrative user ID (with the username cw-admin and the description virtual machine (VM) administrator). The cw-admin username, when created, will use the password that you provided in the installation manifest template. In cases where the installer is unable to apply the password, it creates the administrative user ID using the default password cw-admin. The first time you log in using the administrative username with the default password, you will be prompted to change the password.
The administrative user ID username cw-admin is reserved and cannot be changed. Data center administrators use this ID to log into and troubleshoot the Crosswork application VM.
Deployment progress stages
Successful deployment of Cisco Crosswork and its VM host normally progress through these stages:
-
The installer scripts upload the Crosswork image file to the server.
-
The installer creates the VM and then displays a success message, such as "Creation Complete".
-
The installer powers on the VM. It applies to the VM the parameters specified in the template, reboots the VM, and then registers it with Kubernetes.
-
Once the VM becomes accessible, the installer script displays a success message, such as "Crosswork Installer operation complete". The installer script then exits and returns you to a CLI prompt.
You can monitor most of these deployment stages as they occur, using the methods in the following section, Monitor deployment progress during installation.
Once the Crosswork installer operation completes successfully, the Cisco Crosswork UI becomes accessible and you can monitor Crosswork status by logging into the UI, as explained in the topic Log into the Cisco Crosswork UI in the Cisco Crosswork Network Controller Installation Guide. The login and heath-check process is the same for single VM installations and cluster installations.
Monitor deployment progress during installation
You can monitor VM startup and Crosswork installation progress using these methods.
- Once the VM has been created (stage 2, after the "Creation Complete" message), you can monitor Crosswork Deployment Readiness
from the browser-accessible grafana dashboard, using this URL:
http://{VIP}:30602/d/NK1bwVxGk/crosswork-deployment-readiness?orgId=1&refresh=10s&theme=darkWhere
{VIP}is the Virtual IP address of the VM.Figure 1. Crosswork Deployment Readiness 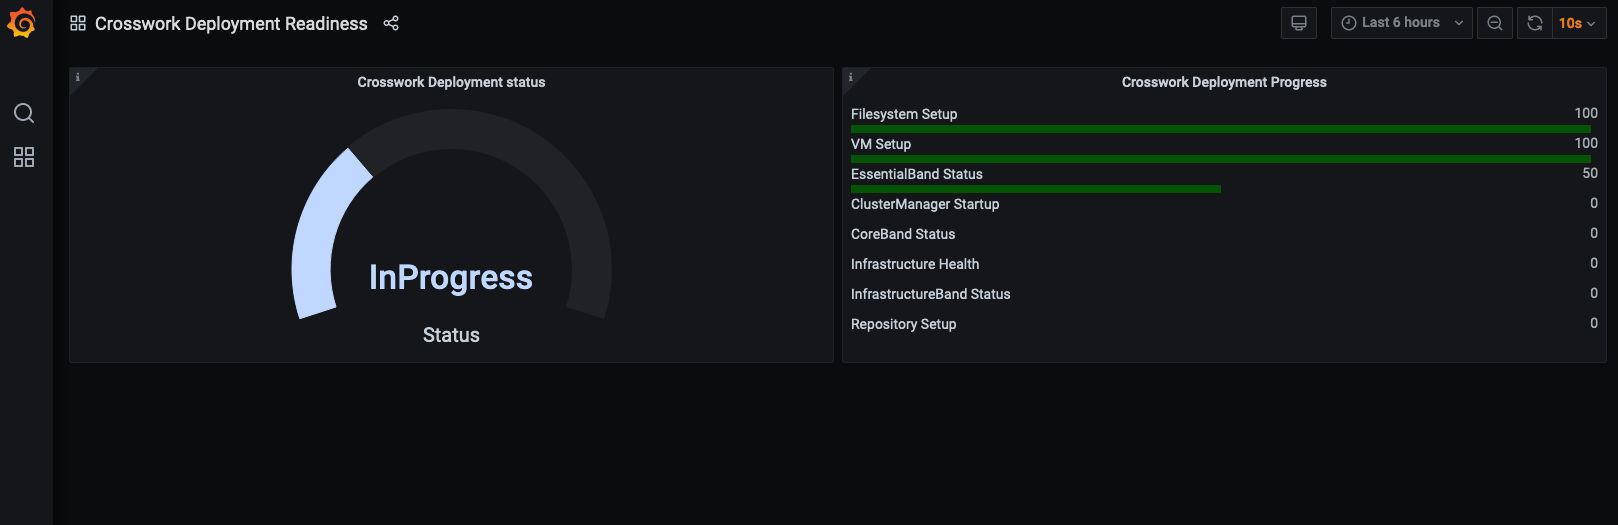

Note
The dashboard is available only:
-
Once the installer completes creating the VM.
-
For around 30 minutes total.
-
-
At the end of the deployment, the dashboard will report a "Ready" status.
If the dashboard URL is inaccessible, use the SSH console described below to monitor the installation process.
Using the SSH console:
-
Check the progress from the console of the VM or use SSH to access the Virtual IP address of the VM.
-
In the latter case, login using the cw-admin user name and the password you assigned to that account in the install template.
-
Switch to super user mode using
sudo su -command. -
Run
kubectl get nodes(to see if the nodes are ready) andkubectl get pods(to see the list of active running pods) commands. -
Repeat the
kubectl get podscommand until you see robot-ui in the list of active pods. -
At this point, you can try to access the Cisco Crosswork UI as explained in the topic in the Cisco Crosswork Network Controller Installation Guide.
Diagnostic assessment
During deployment, the system verifies VM datastore resource values, including disk latency, IOPS, and network bandwidth. If any value falls below the recommended threshold, the diagnostic assessment reports a failure, requiring user action to proceed with the installation. See the topic Log into the Cisco Crosswork UI in the Cisco Crosswork Network Controller Installation Guide.
Deployment failure
In the event of one of the failure scenarios listed below, contact the Cisco Customer Experience team and provide the installer.log, installer_tf.log, and firstBoot.log files for review:
-
Installation is incomplete.
-
Installation is completed, but the VMs are not functional.
-
Installation is completed, but you are directed to check /var/log/firstBoot.log or /opt/robot/bin/firstBoot.log file.
 Feedback