Monitor Device and Inventory Health

This section contains the following topics:

How are device and inventory health monitored?

Monitoring policies determine how the Crosswork Network Controller monitors your network by specifying the following:

  • What is monitored: The network and device attributes.

  • How often it is monitored: The rate at which parameters are polled.

  • When to indicate a problem: Acceptable values for the polled attributes.

  • How to indicate a problem: Trigger an alarm if a threshold is exceeded and set its severity.

Monitoring policies are important as they allow you to select what to monitor without making any changes to devices. These steps summarize how to set up a monitoring policy and configure metrics visualizations:

  1. Select a policy type: Choose the appropriate policy type for your monitoring needs and select the devices you wish to monitor.

  2. Configure polling frequencies and TCAs: Set the policy polling frequencies and specify the Threshold Crossing Alarms (TCAs) that Crosswork should generate when a threshold parameter is exceeded.

  3. Configure Top N metrics: Categorize the health parameters, establish data retention periods, and configure visualization for Top N metrics.

  4. Customize your dashboard: Tailor the metrics dashboard to track and display critical metrics.

To view and administer monitoring policies, navigate to Device Management > Performance Policies. This page displays both default and user-created policies. From here, you can activate, deactivate, edit, or delete a policy.

Parameters monitored by each policy

This section outlines the specific parameters monitored by each policy type. Each policy targets specific aspects of device health and functionality, providing focused monitoring solutions.

The table lists the different parameters a policy monitors for a particular policy type.

Policy type

Parameters the policy monitors

Device health

The device health monitoring policy monitors Cisco devices and third-party devices. For Cisco devices, the policy checks managed devices for CPU utilization, memory pool utilization, environment temperature, and device availability. For third party devices, the policy checks devices for device availability only. This policy also specifies thresholds for utilization and temperature which, if surpassed, trigger alarms that are displayed in the UI.

Parameters- Memory pool utilization, CPU utilization, environmental temperature, device availability

Note


The device health monitoring policy excludes Cisco NCS 2000 and Cisco ONS devices. Optical monitoring policies should be used for these device types.

GNSS

A GNSS (Global Navigation Satellite System) monitoring policy monitors the performance and reliability of GNSS receivers within a network. It polls status and signal quality of satellites.

Parameters-
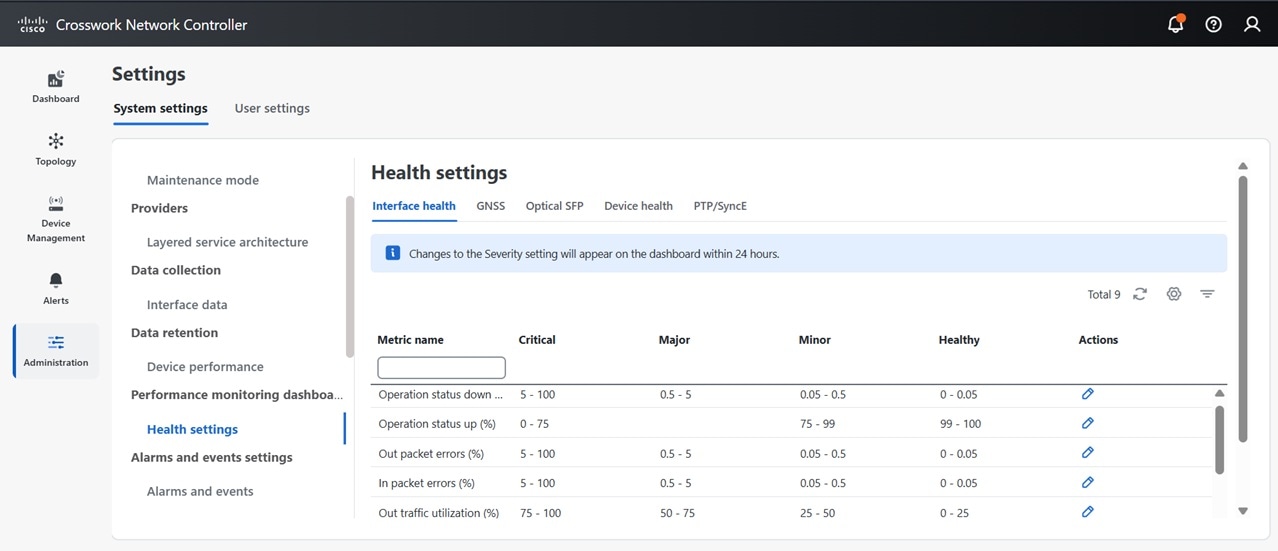
  • Antenna open alarm, antenna short alarm, module lock, module presence, satellite lock count, module slot info, module slot state, module visibility status

Interface health

An interface health policy monitors attributes to asssess interface operational status and performance in a network.

Parameters- Statistics and CRC

LSP traffic

A LSP traffic policy tracks traffic routed through an MPLS (Multiprotocol Label Switching) network and ensures that data packets are being efficiently routed.

Parameters-

  • Outgoing traffic rate and outgoing packets rate

Optical SFP

An optical SFP policy polls health and performance information for optical SFP (Small Form-Factor Pluggable) interfaces. It is available for all Cisco pluggable devices supporting DOM (Cisco Digital Optical Monitoring).

Parameters- Received optical power, temperature, transmitted bias current, current, transmitted optical power, voltage

Optical ZRP

An optical ZR pluggable policy polls health and performance information for ZR optical transceivers within a network.

Parameters-

  • Optics lane- Maximum, minimum, and average transmit and receive power levels.

  • OTU controllers- Error corrected bits, Post-Fec-Ber, Pre-Fec-Ber, Q-factor, Q -margin, uncorrectable words

PTP/ SyncE

A PTP/SyncE policy monitors the Precision Time Protocol (PTP) and Synchronous Ethernet (SyncE) within a network. The PTP/ SyncE policy monitors clock synchronization of primary clocks on devices and the quality of clock signals.

Parameters-

  • PTP- Clock class, clock state and clock UTC offset

  • Input quality level

For a list of pre-defined Key Performance Indicators (KPIs) available for monitoring network and device performance, see Out-of-the-box KPIs for performance metrics.

Manage default policies

LSP traffic and Interface health policies are enabled by default on Crosswork version 7.1. Manage the default policies based on these considerations:
  • Viewing default policies: Access and review the default policies on the Performance Policies page.

  • Upgrade considerations: During the upgrade from Crosswork Network Controller version 7.0 to version 7.1, if no LSP traffic or interface health policies were configured, these policies are created by default.

  • Customizing default policies: You can customize the default policies according to your preferences. Changes to default policies may impact Crosswork Optimization Engine (COE) operations if COE is installed.

  • Impact of deactivating or deleting default policies: Deactivating or deleting default policies may impact COE functionalities. It may also affect visualizations and data displays within the topology user interface. Evaluate the impact of the default policies carefully before making changes.

Configure gNMI based polling for interface health and LSP traffic policies

SNMP is the default protocol used for data polling in Crosswork Network Controller. You can aslo enable gNMI based polling for interface health and LSP traffic policies. To enable gNMI polling, the device must have the pm-openconfig tag assigned, and gNMI capability must be configured. Once you enable gNMI, the tagging and configuration changes take effect in the next polling cycle.

If a device is tagged with pm-openconfig but lacks gNMI capability, polling will switch to SNMP to ensure data collection.

To enable gNMI protocol for interface health or LSP traffic monitoring policies, complete these actions:

Procedure


Step 1

Navigate to the Tag Management page in the Crosswork Network Controller UI and create the pm-openconfig tag.

Step 2

Assign the tag to the intended devices. The tag can belong to any category and be added or removed at any time.

Step 3

Configure gNMI capability on the required devices.

See the Cisco Crosswork Network Controller 7.1 Administration Guide for instructions to create and assign tags and configure gNMI for your devices.

Note


Refer to the section, Manage default policies before you customize any default policies.


Create monitoring policies

To set up and enable a monitoring policy, go to the main menu, select Device Management > Performance Policies and click on Create new policy.

Procedure


Step 1

Select policy type: Choose a policy type from the Select policy type drop-down list.

Step 2

Enter policy details: Provide the policy name and other relevant details.

Step 3

Select devices: Choose the appropriate radio button for the device or device groups you want to monitor. For specific policies like interface health, optical SFP, or optical ZRP, you can also select port groups for monitoring.

Note


To view the Top 5 metrics in the Interface health dashlets, you must create an Interface health monitoring policy by using either device groups or port groups. You have the flexibility to create one or multiple of these groups. If you choose to configure the Interface health policy using individual devices, rather than device or port groups, the interface health data will still be accessible on the Device Management > Top Metrics UI page. However, this data will not appear in the Dashboards.

Step 4

Set polling frequency: Adjust how often the devices are polled by selecting a value from the Polling frequency drop-down list. Some policies allow different polling frequencies for various parameters, while others apply a single frequency to all parameters.

Step 5

Configure alarm thresholds: If the policy supports TCA customization, enable the Configure alarm threshold slider to set thresholds. You can add multiple thresholds.

Step 6

Activate monitoring: Click Activate to start monitoring. The policy and its details will be listed under Performance Policies > View details.

Step 7

Manage policies: To manage a policy, click View details, then select Actions to deactivate, edit, or delete a policy. You can edit a performance policy during maintenance mode, but changes may not immediately reflect due to maintenance activities. They are fully deployed once Crosswork exits maintenance mode.


View collection jobs for performance monitoring

You can monitor the status of collection jobs associated with active performance policies. These jobs are displayed on the Collection Jobs page.

To view the collection job for a moitoring policy, follow these steps.

Procedure


Step 1

Go to Device Management > Performance Policies.

Step 2

Switch to the list view to display the ID column.

Step 3

Identify and note the ID of the specific performance policy you want to monitor.

For example, if the policy ID is 6, all collection jobs with the prefix PM_6 will be related to this policy.

Step 4

To view the collection job, go to Administration > Collection Jobs.

All the collection jobs with the app id performance-service are related to performance monitoring.

Step 5

Use the Context ID filter to locate jobs related to the specified performance policy. For example PM_6, PM_2.

This applies to both bulk and parameterized jobs.

Step 6

Click on the Context ID link for the chosen performance policy to access detailed job information.

Figure 1. Collection jobs for monitoring policies

Customize metrics for network analysis

Crosswork Network Controller enables you to analyze a wide range of metrics related to the monitoring policies you define.

Within the UI, you can access these metrics across all History tabs, providing insights into network performance. Crosswork Network Controller processes the data over a one hour period before running a preprocessing task to calculate the histogram and summary. In the histogram graphs, the time shown represents the start of the one-hour period. For instance, if the hourly report displays 8:00, it means the data corresponds to the time range from 8:00 to 9:00.

Additionally, you can configure Top N metrics to monitor the key metrics you wish to track, and customize your dashboard to visualize these essential metrics across your network. This enables you to effectively focus on key performance indicators and streamline network management.

There are four levels at which you can investigate metrics:

  • Network aggregation: Analyze data across the entire network to identify overall patterns and trends.

  • Trend analysis: Examine historical data to detect changes and trends over time.

  • Top element identification: Identify the highest-performing or most critical elements within the network.

  • Individual element trend viewing: Focus on specific elements to track their performance trends and changes.

Refer to the following sections to define Top N metrics for your network:

Customize metric health settings

Before setting up metrics visualization, define the metric health categories. Set thresholds for each metric to determine what is considered healthy, major, minor, or critical. While default categories and thresholds are available, you can customize them to suit your needs.

Procedure


Step 1

From the main menu, navigate to Administration > Settings > Performance monitoring dashboard > Health settings.

Figure 2. Health settings

Under the System settings tab, explore the different metrics tabs by policies you have created. Each tab displays all metrics related to that policy.

Step 2

Set metric health thresholds:

  1. Click the Edit button under the Actions column to define the severity of the collected metrics.

  2. You can reset thresholds to default values individually or for all metrics under a single policy at once.

Example:

1 Setting threshold values for interface health policy parameters
  1. Click on the policy tab to view the listed metrics.

  2. Click the Edit button under Actions for Out Packet Drops.

  3. Set severity ranges for healthy, minor, major, and critical.

  4. Click Save.

Example:

2 Setting threshold values for PTP/ SyncE policy parameters

Select each parameter to define the values.

  • Clock class: Enter the PTP clock class values (0–255) to configure severity levels which ensures accurate timing synchronization.

  • Clock state: Configure the clock state settings to identify synchronization status.

    • Freerun: Operates independently without synchronization.

    • Holdover: Maintains the last known good state temporarily.

    • Acquiring: In the process of obtaining synchronization.

    • Frequency locked: Frequency is synchronized, but phase alignment is not achieved.

    • Phase aligned: Fully synchronized in both frequency and phase.

  • Input quality level: Select from one or more quality parameters like DNU (Do Not Use), PRC (Primary Reference Clock), UNC (Uncertain), UNK (Unknown) to assesses the reliability of the clock source.

  • Clock UTC offset: Set the time difference between the local clock and UTC to account for time zone differences.

Note


The new settings are applied to future reports, while past or previously calculated periods will continue to use the old settings.


Set data retention periods for monitored metrics

Define the retention periods for metrics data. This ensures that your network analysis aligns with your specific monitoring needs and storage capabilities. Follow these steps to access and modify data retention settings.

Procedure


Step 1

Navigate to Administration > Settings > Data retention > Device performance.

Step 2

Use the policy type dropdown menu to filter the desired policy type.

Step 3

For a selected policy, choose the performance metrics you wish to edit and click the edit icon.

Default data retention values are provided. You can customize the retention period by specifying it for raw data, hourly data, daily data, and weekly data.


View key metrics

Customize the Top Metrics view and monitor the critical metrics of your choice.

Procedure


Step 1

From the main menu, navigate to Device Management > Top Metrics.

Step 2

Select metrics and filters:

  1. Choose a category: From the Select Metrics dropdown, choose from the categories: Device health, GNSS, Interface health, LSP traffic, Optical SFP, Optical ZRP, and PTP/SyncE. The categories depend on the monitoring policies you have set.

  2. Adjust filter settings: Select categories such as critical, major, minor, and healthy. Filter by device groups or port groups or by choosing metrics ranging from the top 10 to top 500.

  3. View trends: Under the Actions tab, click the three dots for a device and select View trends. You can use this feature to identify when an error began occurring.