Cisco Intelligent Capture Deployment Guide
Available Languages
Bias-Free Language
The documentation set for this product strives to use bias-free language. For the purposes of this documentation set, bias-free is defined as language that does not imply discrimination based on age, disability, gender, racial identity, ethnic identity, sexual orientation, socioeconomic status, and intersectionality. Exceptions may be present in the documentation due to language that is hardcoded in the user interfaces of the product software, language used based on RFP documentation, or language that is used by a referenced third-party product. Learn more about how Cisco is using Inclusive Language.
Overview of Cisco DNA Center Intelligent Capture
Cisco DNA Center is the foundational controller and analytics platform at the heart of Cisco’s intent-based networking solution. The software platform offers a centralized, intuitive management system that makes it fast and easy to design, provision, and apply policies across your network environment. The Cisco DNA Center UI provides intuitive, end-to-end network visibility and uses network insights to optimize network performance and deliver the best user and application experience.
Built on top of this technology is Intelligent Capture, Cisco’s newest state-of-the-art intent-based networking solution. Intelligent Capture provides live technical insight into various wireless metrics from both the client and access point perspective, allowing you to easily resolve even the most difficult wireless issues.
Intelligent Capture provides support for a direct communication link between Cisco DNA Center and Access Points (APs), so each of the APs can communicate with Cisco DNA Center directly. Using this channel, Cisco DNA Center can receive packet capture (PCAP) data, AP and client statistics, and spectrum data. With the direct link from the AP to Cisco DNA Center via gRPC, Intelligent Capture allows you to access data from APs that is not available from wireless controllers.
This deployment guide provides details for configuring Cisco DNA Center, access points, and controllers to work with Intelligent Capture.
● Cisco DNA Center Release 2.2.2.0
● Cisco WLC and AP Release AireOS 8.10.151.0 or Cisco IOS XE 17.5.1
● Cisco Connected Mobile Experiences (CMX) Release 10.6.2-89
● Cisco Prime Virtual Network Analysis Module (vNAM) Release 6.4.2
Table 1. Cisco DNA Center and device compatibility matrix
| Cisco DNA Center release |
WLC release |
|
| AireOS |
Cisco IOS XE |
|
| 2.2.2.x |
8.10.151.0 |
17.5.1 |
| 2.2.1.x |
8.10.142.0 |
17.4.1 |
| 2.1.2.x or earlier |
8.10.130.0 |
17.3.1 |
Note: This document is based on the recommended Cisco DNA Center Release 2.2.2 and controller/AP release of either AireOS 8.10.130.0 or Cisco IOS XE 17.3.1. Some software features are not supported in earlier software releases.
Supported device software and hardware
Table 2. Cisco AireOS wireless controllers that support Intelligent Capture
| Supported AireOS wireless controllers |
Minimum supported AireOS version |
Recommended AireOS version |
| Cisco 3504 Wireless Controller |
8.8.130.0 |
8.10.151.0 |
| Cisco 5520 Wireless Controller |
8.8.130.0 |
8.10.151.0 |
| Cisco 8540 Wireless Controller |
8.8.130.0 |
8.10.151.0 |
Table 3. Cisco Catalyst wireless controllers that support Intelligent Capture
| Supported Catalyst wireless controllers |
Minimum supported Cisco IOS XE version |
Recommended Cisco IOS XE version |
| Cisco Embedded Wireless Controller on Catalyst Access Points* |
16.12.3 |
17.3.1 |
| Cisco Catalyst 9800-CL Wireless Controller for Cloud |
16.12.3 |
17.3.1 |
| Cisco Catalyst 9800-L Wireless Controller |
16.12.3 |
17.3.1 |
| Cisco Catalyst 9800-40 Wireless Controller |
16.12.3 |
17.3.1 |
| Cisco Catalyst 9800-80 Wireless Controller |
16.12.3 |
17.3.1 |
Note: In Embedded Wireless Controller deployments, the Intelligent Capture data will only be exported from the Access Points where the Controller functionality is not running.
Table 4. Cisco APs that support Intelligent Capture
| Supported access points |
AireOS software |
Cisco IOS XE software |
||
| Minimum version |
Recommended version |
Minimum version |
Recommended version |
|
| Aironet 1540 Series |
8.10.105.0 |
8.10.130.0 |
16.12.3 |
17.3.1 |
| Aironet 1560 Series |
8.10.105.0 |
8.10.130.0 |
16.12.3 |
17.3.1 |
| Aironet 1815 Series |
8.10.105.0 |
8.10.130.0 |
16.12.3 |
17.3.1 |
| Aironet 1830 Series |
8.10.105.0 |
8.10.130.0 |
16.12.3 |
17.3.1 |
| Aironet 1840 Series |
8.10.105.0 |
8.10.130.0 |
16.12.3 |
17.3.1 |
| Aironet 1850 Series |
8.10.105.0 |
8.10.130.0 |
16.12.3 |
17.3.1 |
| Aironet 2800 Series |
8.8.125.0 |
8.10.130.0 |
16.12.3 |
17.3.1 |
| Aironet 3800 Series |
8.8.125.0 |
8.10.130.0 |
16.12.3 |
17.3.1 |
| Aironet 4800 |
8.8.125.0 |
8.10.130.0 |
16.12.3 |
17.3.1 |
| Catalyst 9105AX Series |
8.10MR3 |
8.10.130.0 |
17.3.1 |
17.3.1 |
| Catalyst 9115AX Series |
8.10.105.0 |
8.10.130.0 |
16.12.3 |
17.3.1 |
| Catalyst 9120AX Series |
8.10.105.0 |
8.10.130.0 |
16.12.3 |
17.3.1 |
| Catalyst 9130AX Series |
8.10MR3 |
8.10.130.0 |
17.3.1 |
17.3.1 |
| Catalyst 9124AX Series |
N/A |
N/A |
17.5.1 |
17.5.1 |
| Catalyst IW6300 Heavy Duty Series |
8.10.105.0 |
17.1.1s |
8.10.105.0 |
17.1.1s |
| 6300 Series Embedded Services |
8.10.105.0 |
17.1.1s |
8.10.105.0 |
17.1.1s |
Table 5. Intelligent Capture feature compatibility with device hardware and software
| Feature |
WLC type |
Supported access points |
|||||||
| 18xx |
2800 |
4800 |
9105AX |
9115AX |
9120AX |
9130AX |
9124AX |
||
| 1540 |
3800 |
||||||||
| 1560 |
|||||||||
| Anomaly Detection Onboarding Packet Capture AP Statistics Client Statistics |
AireOS |
8.10.130.0 |
8.10.130.0 |
8.10.130.0 |
8.10.130.0 |
8.10.130.0 |
8.10.130.0 |
8.10.130.0 |
– |
| Cisco IOS XE |
16.12.3 |
16.12.3 |
16.12.3 |
16.12.3 |
16.12.3 |
16.12.3 |
17.3.1 |
17.5.1 |
|
| Data Packet Capture |
AireOS |
– |
– |
8.10.130.0 |
– |
– |
– |
8.10.130.0 |
– |
| Cisco IOS XE |
– |
– |
16.12.3 |
– |
– |
– |
17.3.1 |
17.5.1 |
|
| Spectrum Analysis |
AireOS |
– |
8.10.130.0 |
8.10.130.0 |
– |
– |
8.10.130.0 |
8.10.130.0 |
– |
| Cisco IOS XE |
– |
16.12.3 |
16.12.3 |
– |
– |
17.3.1 |
17.3.1 |
17.5.1 |
|
Prerequisite: Install Intelligent Capture package onto Cisco DNA Center
Cisco DNA Center provides the option to download a separate Intelligent Capture package called Automation – Intelligent Capture.
To download and install this package, follow the steps below:
1. Log in to Cisco DNA Center.
2. Click the hamburger menu in the top left corner of the screen.
3. Click System, then Software Updates.
4. Click Installed Apps on the left side of the screen.
5. Scroll down to Assurance and you will find the Automation – Intelligent Capture package ready for download and installation (Figure 1).
Note: If you do not see the Automation – Intelligent Capture package after performing the steps above, please reach out to either a Cisco account sales representative or an account sales engineer for additional support.
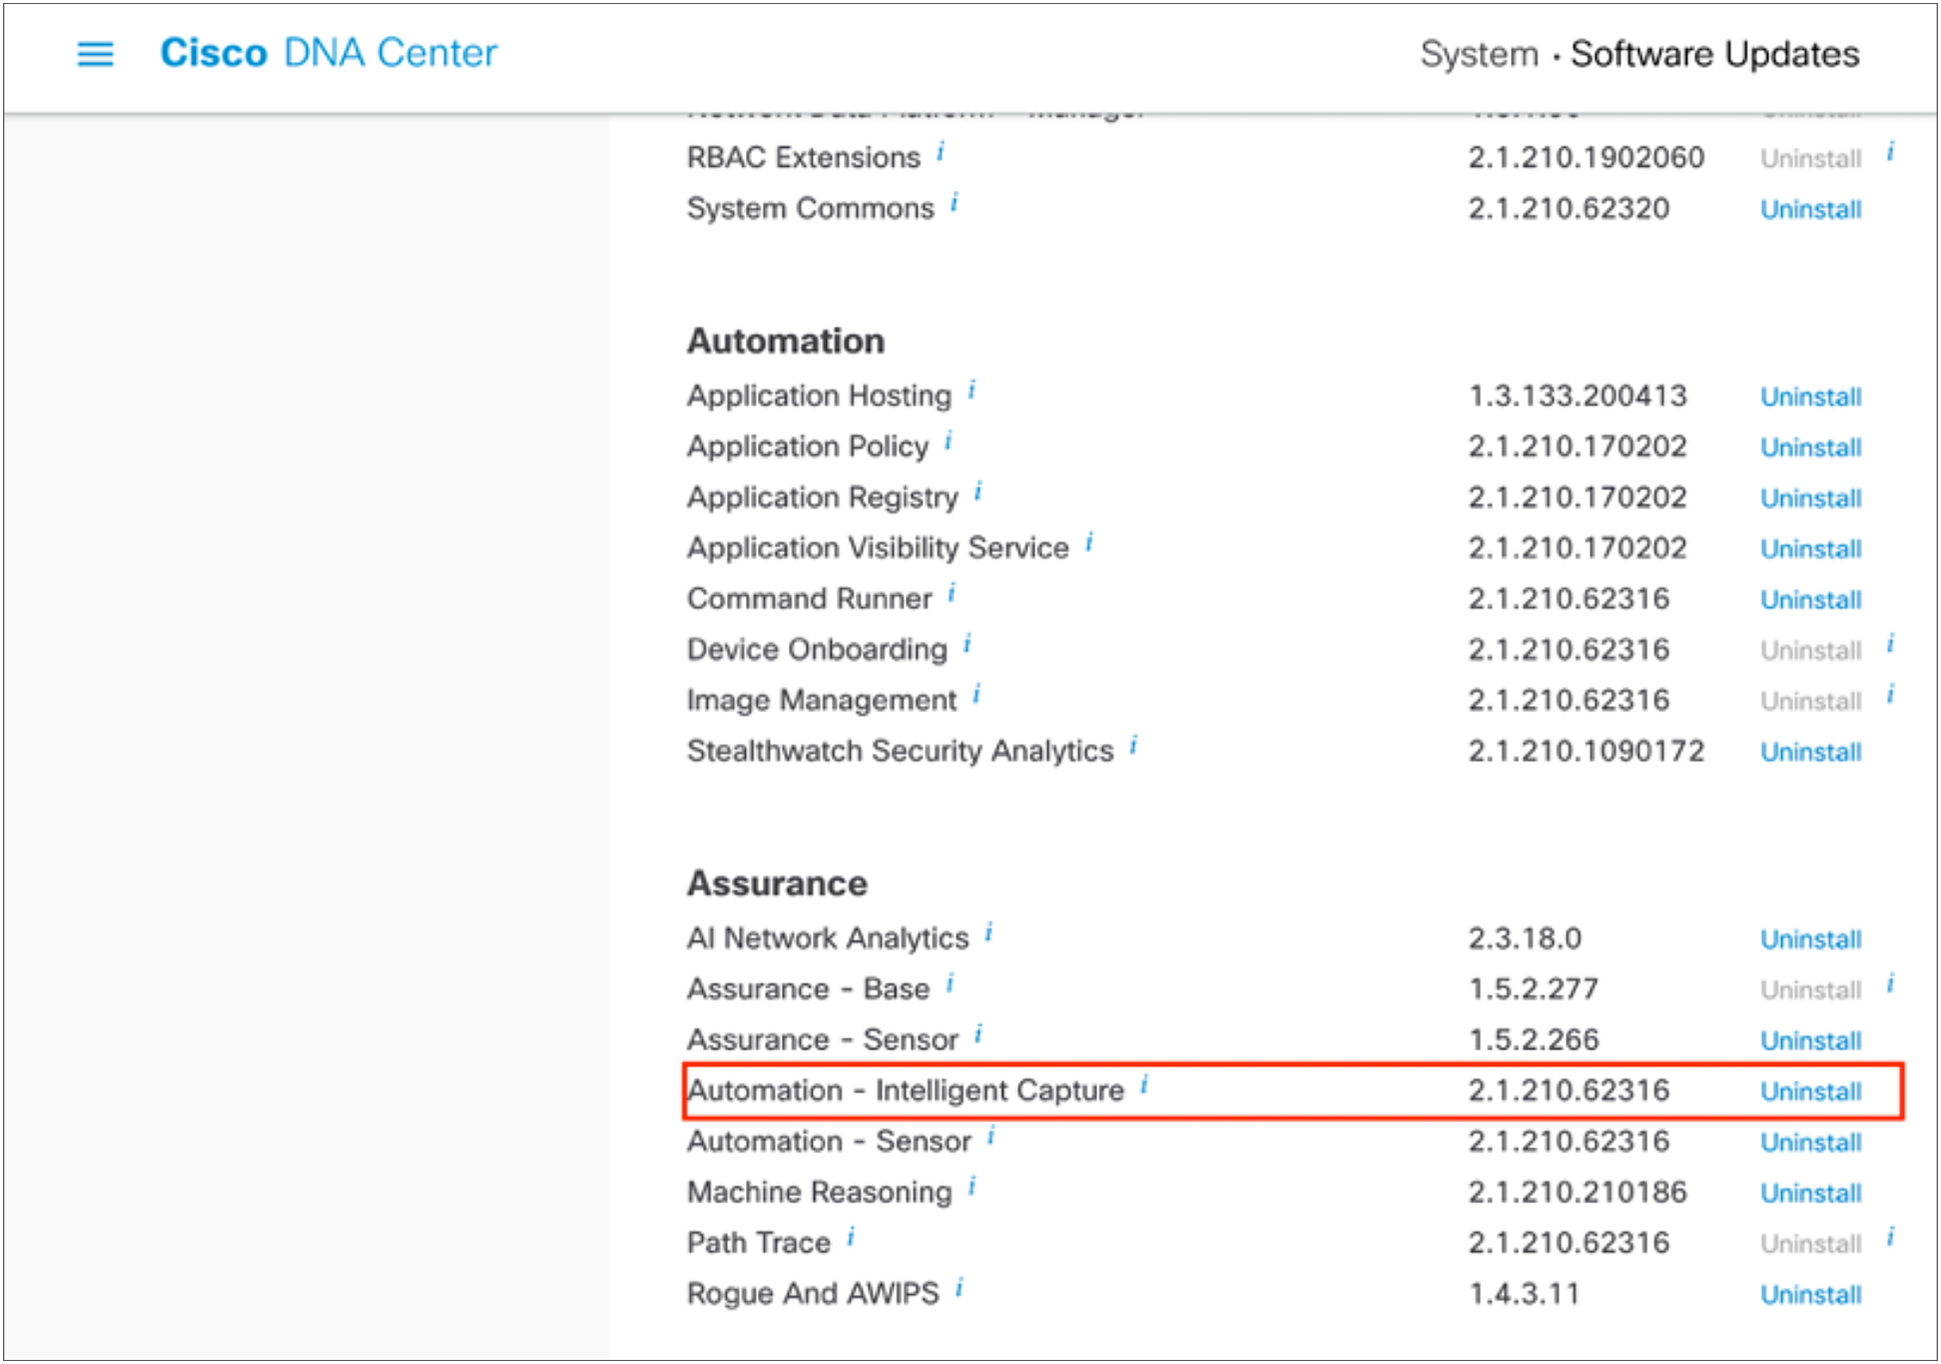
Location of the Intelligent Capture package within the Software Updates page
Day-0 configuration: Setting up Cisco DNA Center to use Intelligent Capture
The following subsections provide step-by-step instructions for setting up the day-0 configurations necessary to begin using Intelligent Capture.
Part 1: Build a site hierarchy
Description: Cisco DNA Center’s Design page provides a robust design application to allow customers of every size and scale to easily define their physical sites and common resources.
Section goals: Create and configure network hierarchy sites and settings to define shared services, device credentials, and Simple Network Management Protocol (SNMP) community strings.
Step 1: Navigate to the Network Hierarchy page
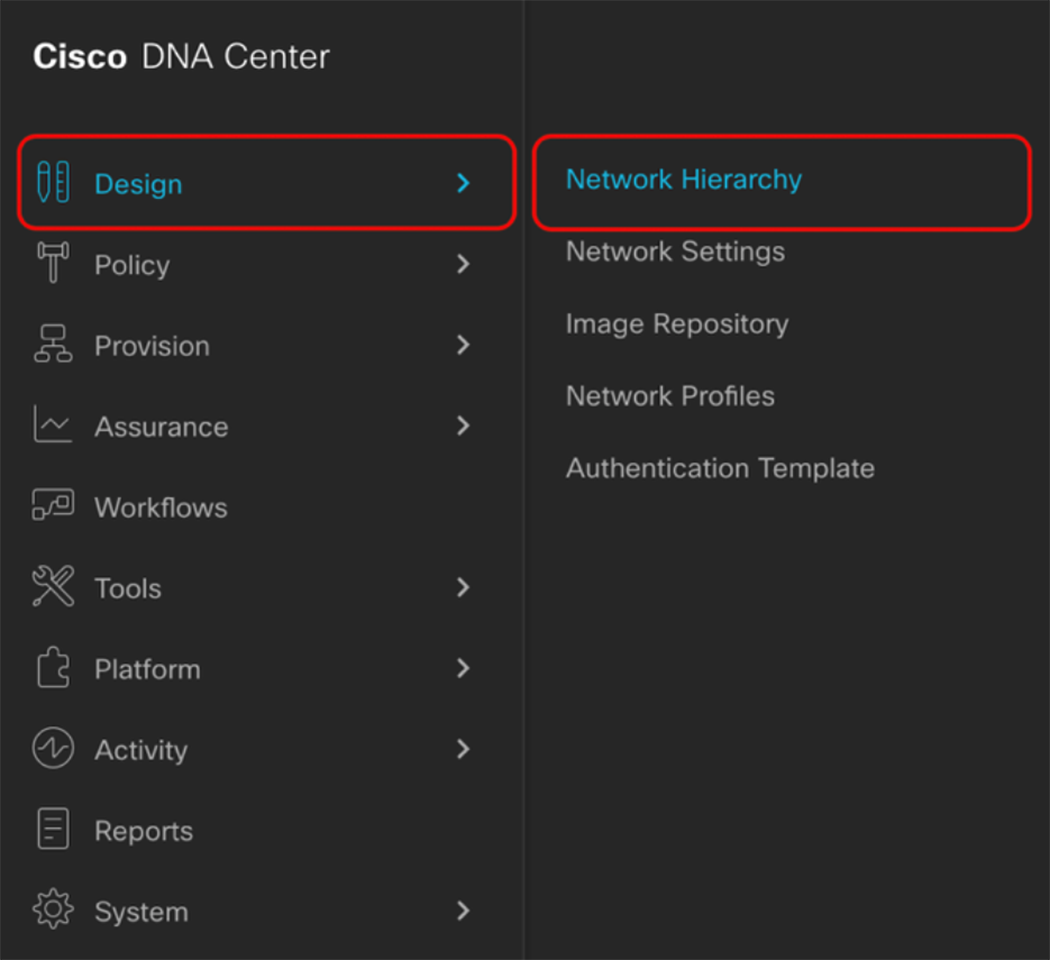
1. Option 1: Log in to the Cisco DNA Center UI. Scroll down to the Network Configuration section and choose Design (Figure 2).
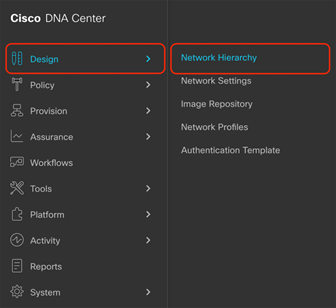
2. Option 2: Click the hamburger menu in the top left corner of the screen. Click Design, then Network Hierarchy (Figure 3).
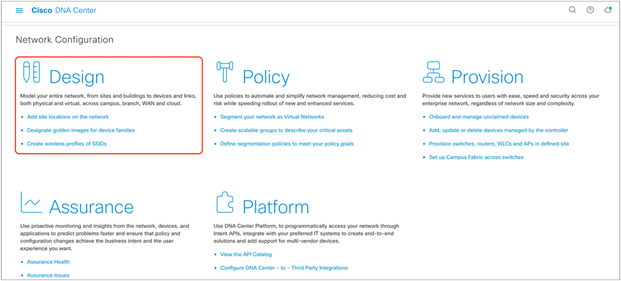
Location of the Design page on the Cisco DNA Center homepage
Step 2: Create sites, building, and floors
To allow Cisco DNA Center to group devices based on location, begin by laying out a hierarchy of areas, building, and floors as required to accurately represent the location of your network. A site hierarchy lets you enable unique network settings and IP spaces for different groups of devices.
1. Option 1: To create a site, click the Add Site button (Figure 4). A menu will open up and provide you an option to create a child area, building, or floor within a desired site.
2. Option 2: To create a site, click the gear icon (Figure 5) next to the site you would like to create a child site under.
3. When creating a floor, click Upload file to upload a floor of a building (Figure 6).
Floor plans must be in DXF, DWG, JPG, GIF, or PNG format.
The behavior of Cisco DNA Center is to inherit settings from the global level into subsequent levels in the hierarchy. This enables consistency across large domains while providing administrators the flexibility to adapt and change an individual building or floor.
Notes:
● You can create areas and buildings only within the global site or other areas, and can create floors only within buildings.
● When creating a building within the design hierarchy, it is critical that you use a real physical street address for your sites. Cisco DNA Center uses the street address to select the country codes for the wireless implementation.
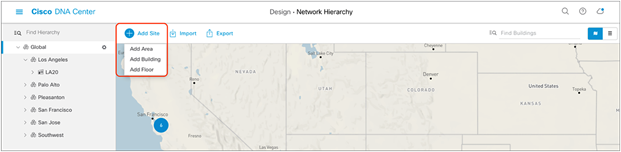
Clicking Add Site within the Design – Network Hierarchy page
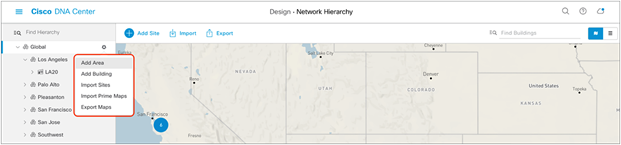
Clicking the gear icon next to a site within the Design – Network Hierarchy page
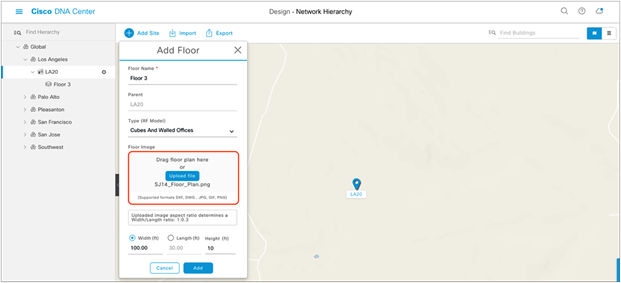
Location of the Upload file button to upload a floor plan during floor creation
Step 3: Navigate to the Network Settings page
Cisco DNA Center lets you save common resources and settings with the Network Settings application. Information pertaining to the enterprise can be stored and reused across the network.
1. To navigate to the Network Settings page, open the hamburger menu in the top left corner of the screen. Click Design, then Network Settings (Figure 7).
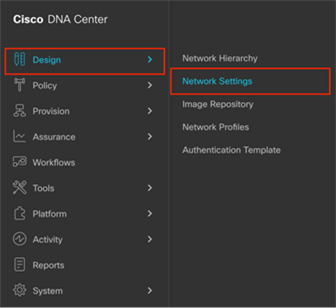
Location of Network Settings from the hamburger menu
Step 4: Configure network settings and device credentials
This is where you configure all device-related network settings. By default, Cisco DNA Center’s IP address is prepopulated in the Syslog Server and SNMP Server fields. This will enable syslog and SNMP traps to be sent to Cisco DNA Center from network devices when a WLC is added to Cisco DNA Center.
1. Click the Device Credentials tab to view the existing device Command-Line Interface (CLI) credentials and SNMP community strings (Figure 8).
2. Click the Add button to create new credential entries (Figure 9). Cisco DNA Center uses these credentials to discover the network devices.
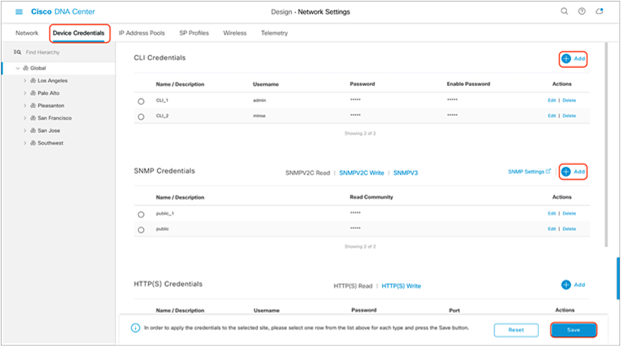
Workflow to add device credentials to the network settings
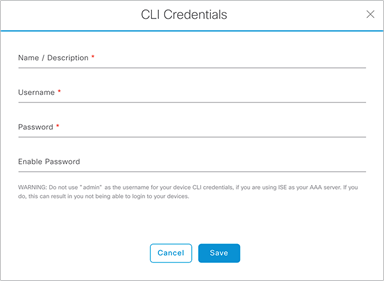
CLI Credentials form that appears when you click Add in Figure 9
Part 2: Discovery and inventory
Description: Cisco DNA Center’s Discovery application allows a network administrator to add their network device to the platform.
Section goals: Discover WLC and APs and assign them to the site created in the previous section.
Step 1: Navigate to the Discovery application
1. Option 1: From the homepage, scroll down to the bottom and click Discovery and then Add Discovery (Figures 10 and 11).
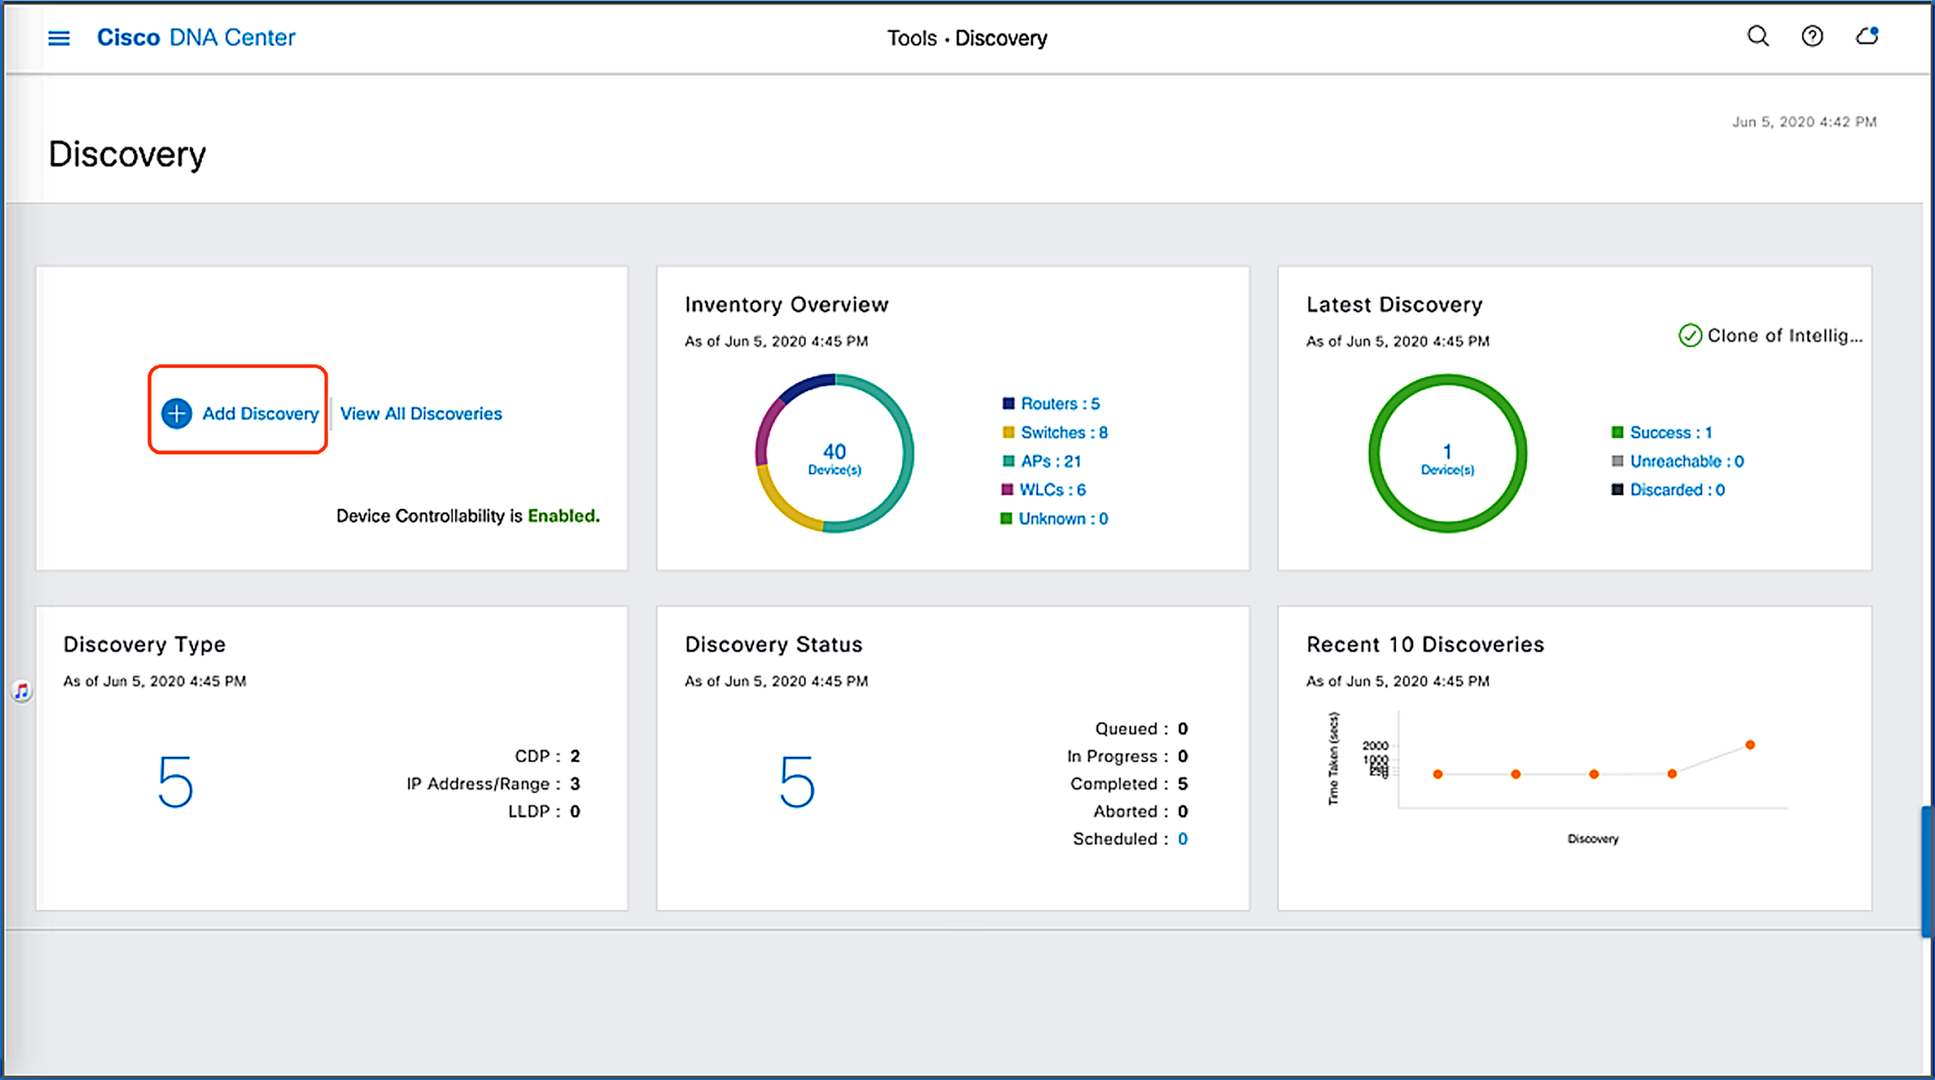
2. Option 2: Click the hamburger menu in the top left corner of the screen. Click Tools, then Discovery (Figure 12).
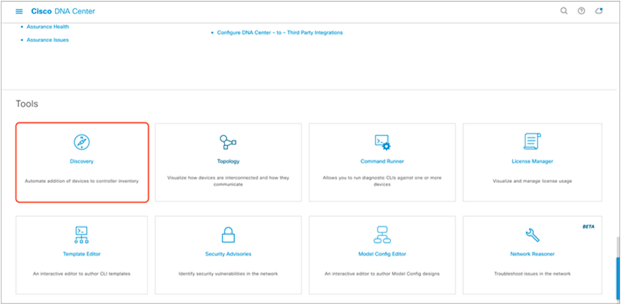
Location of Discovery button on Cisco DNA Center homepage
Location of Add Discovery button on Tools - Discovery page
Location of Discovery within the hamburger menu
Step 2: Discover controllers and access points in Cisco DNA Center
To discover a WLC in Cisco DNA Center, follow the steps below (Figure 13):
1. Enter a discovery name (any unique name for the purpose of classification on the Discovery page).
2. Enter either a single IP address or a range of addresses and specify Cisco Discovery Protocol (CDP), IP Address/Range, or Link Layer Discovery Protocol (LLDP).
3. Enter the SSH username and password, and SNMP read and write credentials (clicking Add Credentials).
4. If you’re discovering a Cisco IOS XE controller, enter the NETCONF port as 830 and run the following commands on the controller CLI.
aaa new-model
aaa authentication login default local
aaa authorization exec default local
5. When the details are filled in, click the Discover button.
Notes:
● When you discover a WLC, all of its joined APs will also be discovered and placed in Cisco DNA Center’s inventory.
● All the CLI credentials defined in the Design section are displayed on the Discovery page.
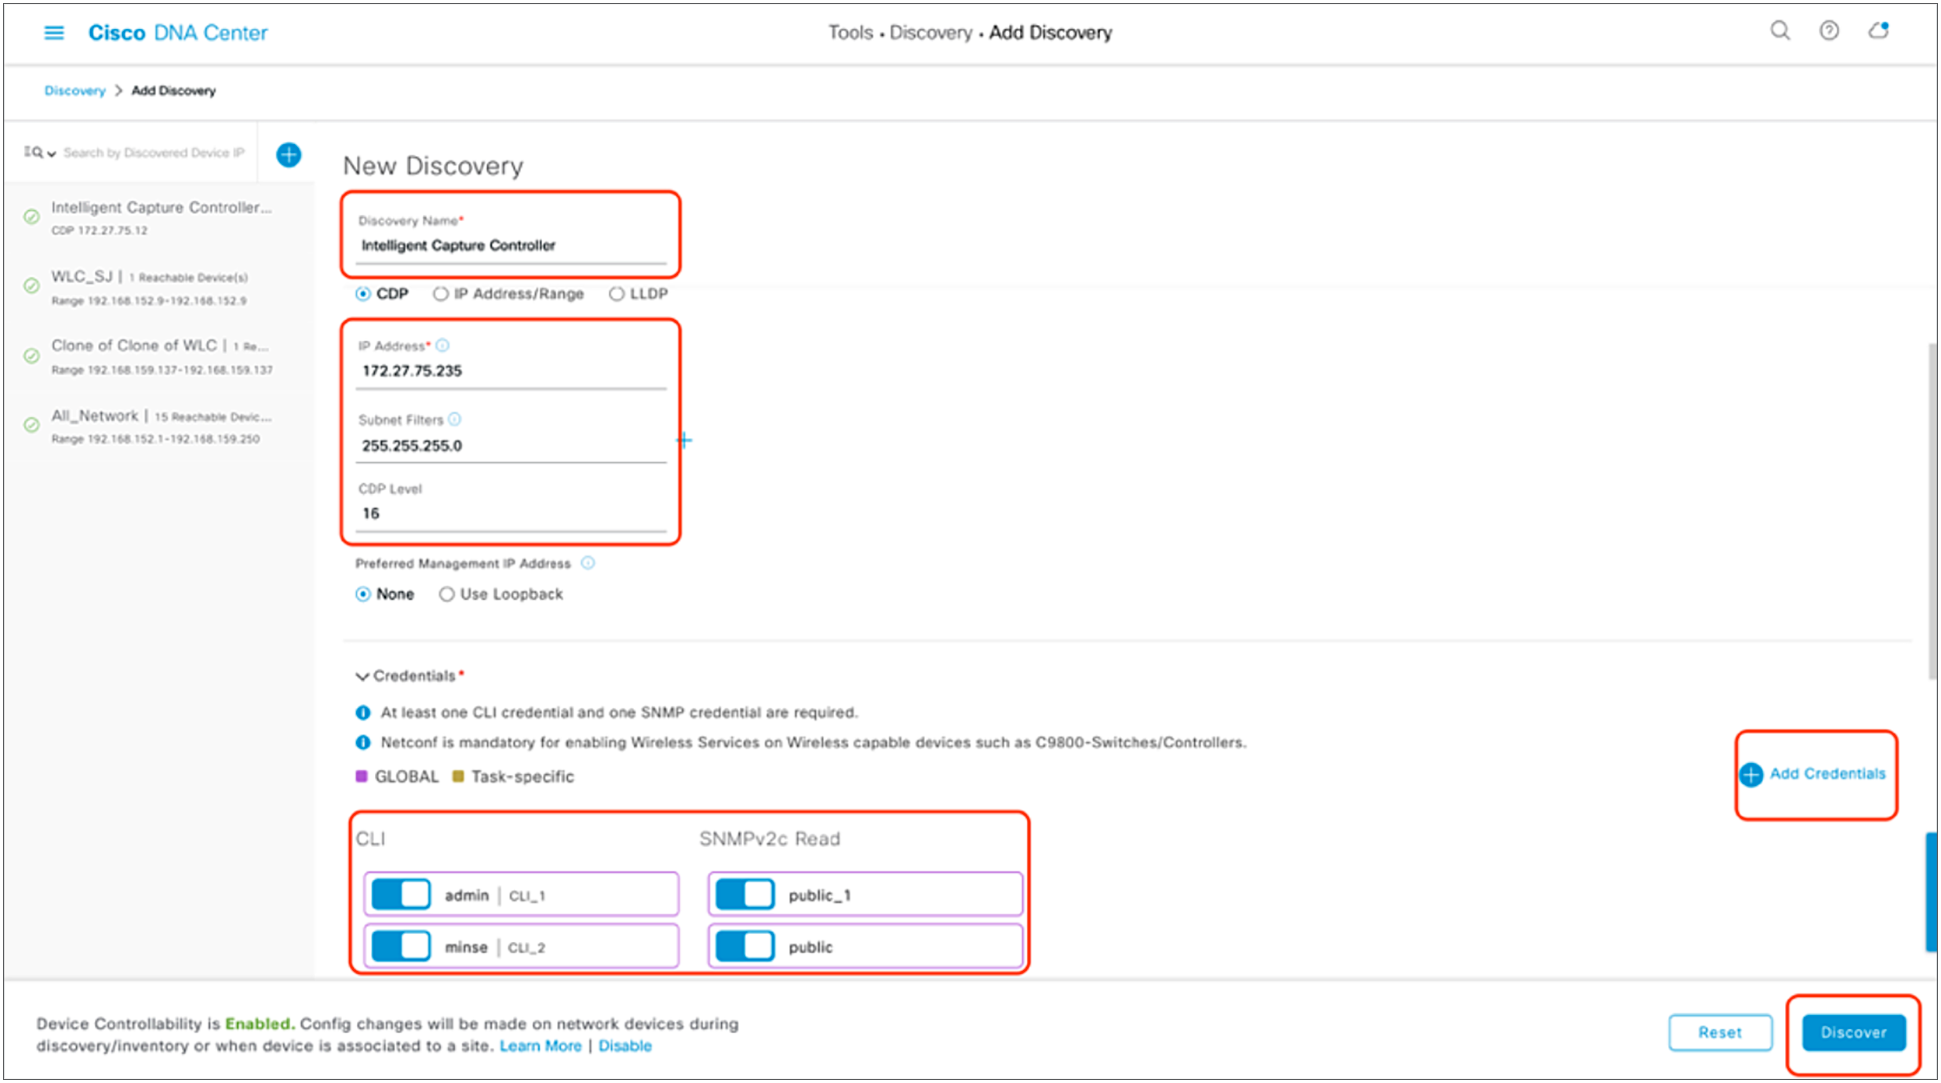
Discovery page with credentials filled in and ready for discovery
6. After the discovery process completes, ensure that the status of the Internet Control Message Protocol (ICMP), SNMP, and CLI sections is green for every device that has been discovered (Figure 14).
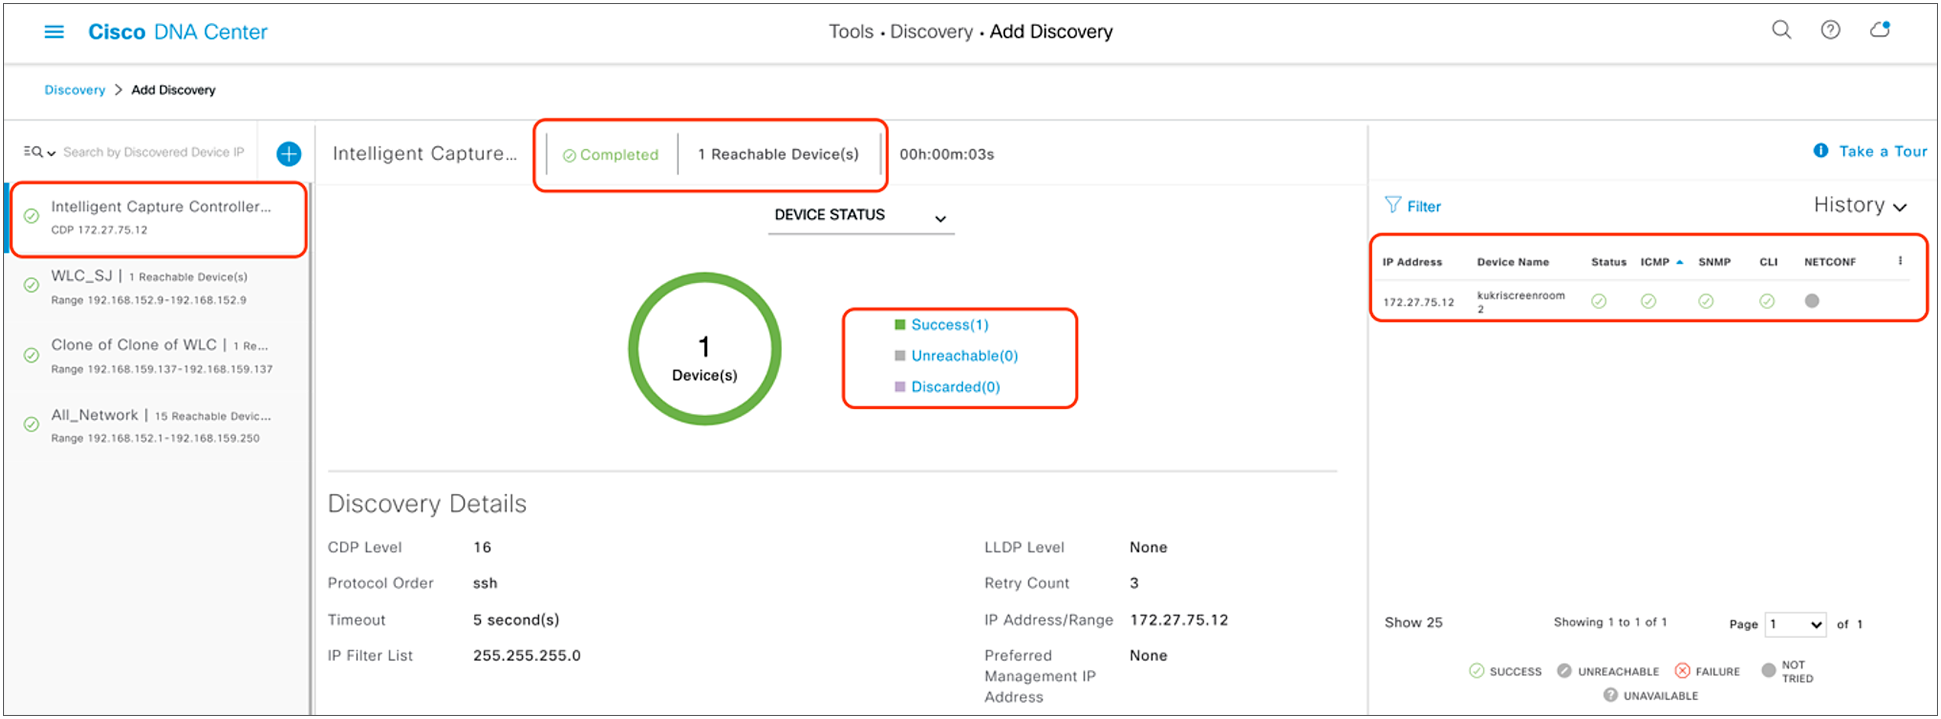
Successful discovery of WLC on the Discovery page
After the discovery process is complete, navigate to the Inventory application, where your discovered devices will be located.
1. Open up the hamburger menu, and click Provision and then Inventory (Figure 15).
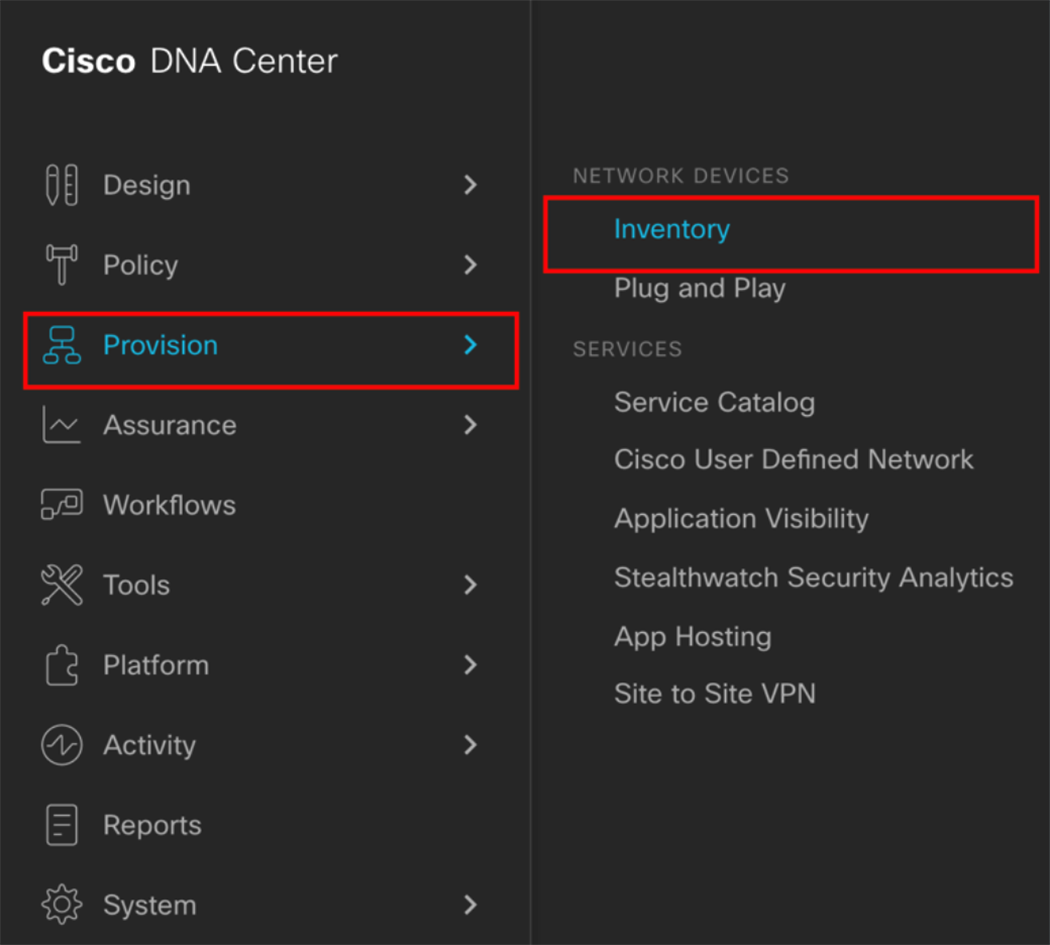
Location of Inventory within the hamburger menu
2. Click Unassigned Devices on the left side of the page, and ensure that all devices are Reachable and that the Last Sync Status is Managed (Figure 16).
It is critical that all devices be in the Managed state for Cisco DNA Center Assurance functionality to work. If they are not, check the reachability of your devices.
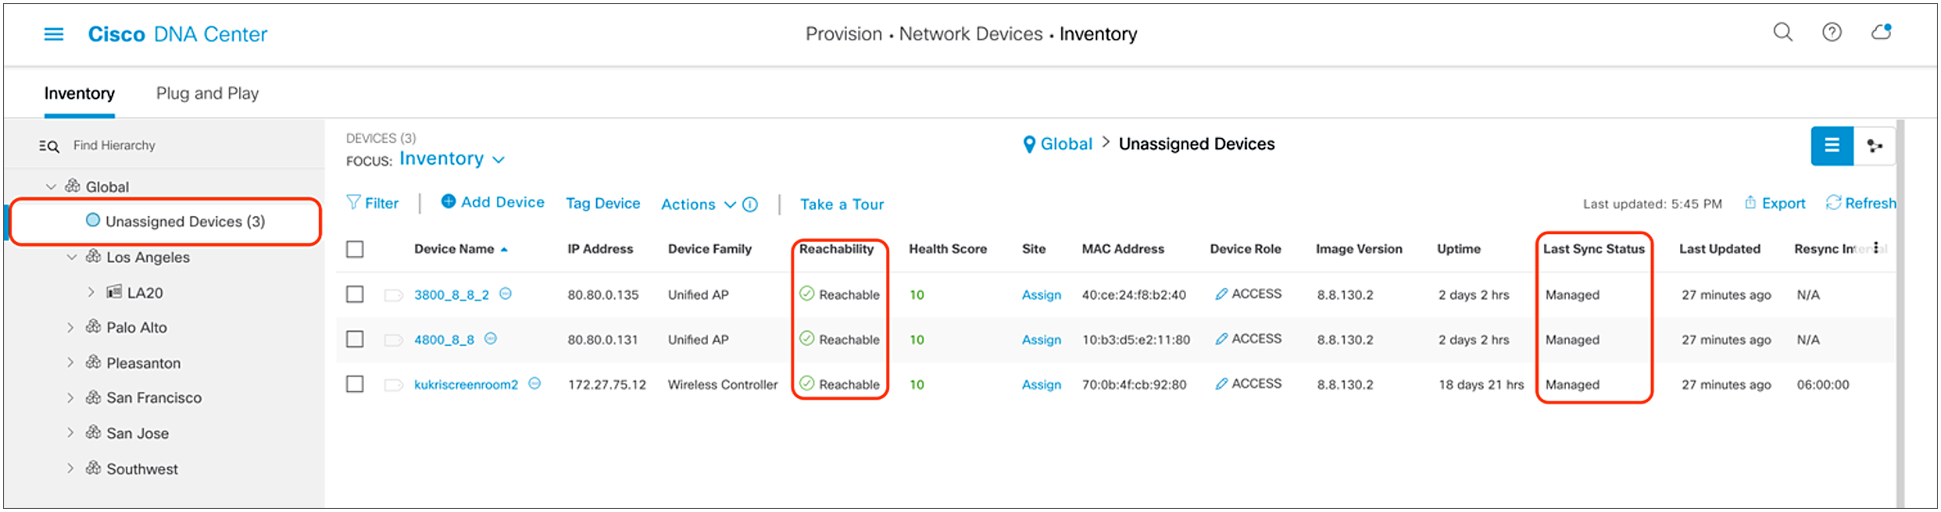
Discovered devices and their Reachability and Last Sync Status
3. Optional: If you would like to manually add a controller to the inventory, click the Add Device button and provide the same information as in the Discovery application (Figure 17).
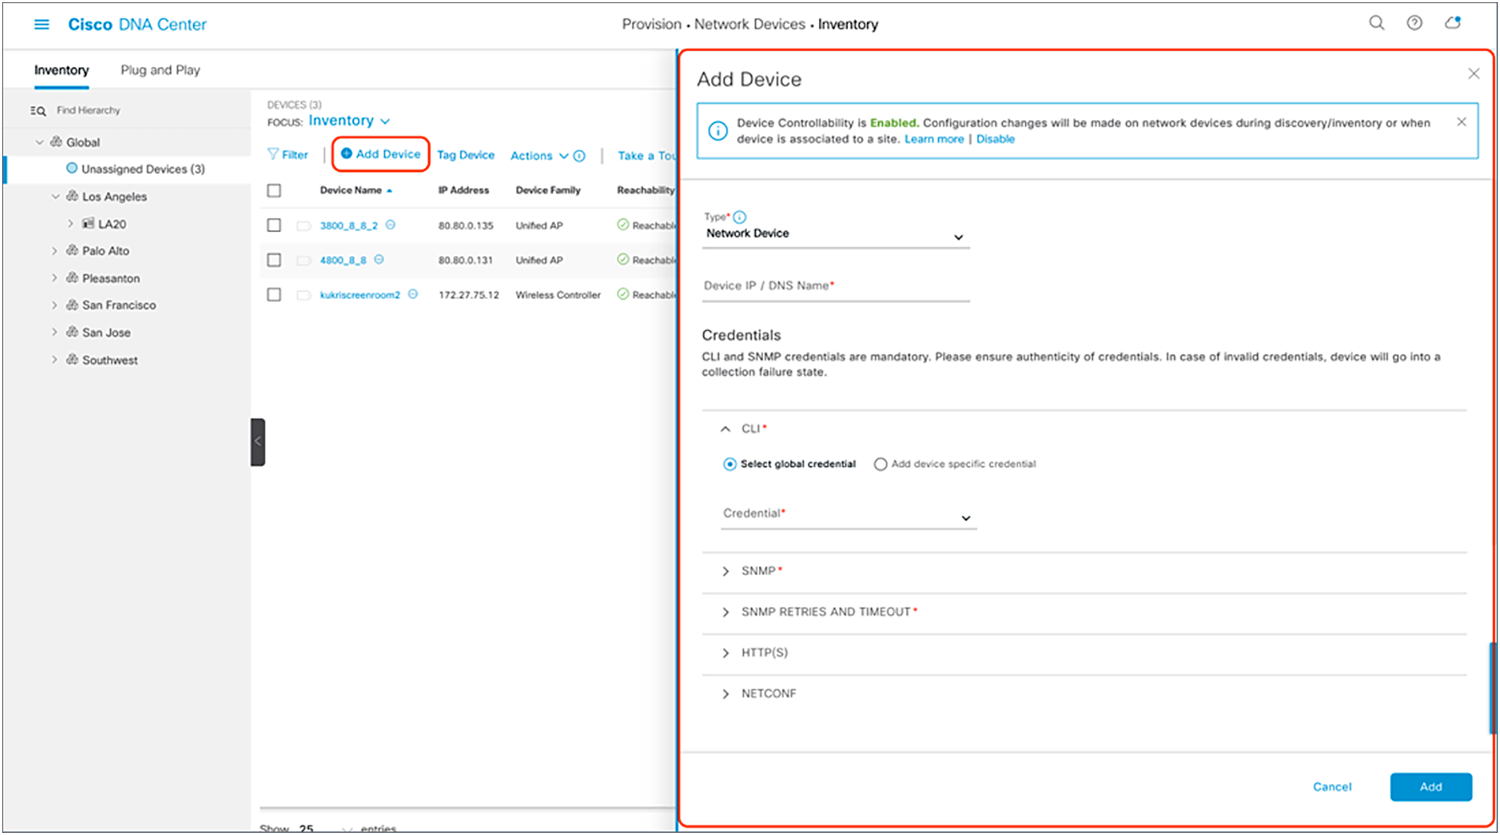
Form that appears when you click Add Device
Step 4: Assign discovered device to site hierarchy
After discovery and site assignment, Cisco DNA Center will have automatically pushed or enabled the following configuration to the WLC and APs. This configuration is required for Intelligent Capture features to work.
● Pushed Cisco DNA Center certificate
● Enabled WLC streaming telemetry (WSA)
● Enabled AP streaming telemetry (gRPC, TCP 32626)
● Configured Cisco DNA Center as an SNMP trap receiver
● Configured Cisco DNA Center as a syslog server
Note: As of Release 2.1.1, Cisco DNA Center will send the WLC a network assurance certificate that enables the WLC and APs to externalize data to Cisco DNA Center, as opposed to during the discovery workflow as was done in previous releases.
1. Click the check box next to the device you would like to assign to a site.
2. Hover your cursor over Action and then Provision, then click Assign Device to Site (Figure 18).
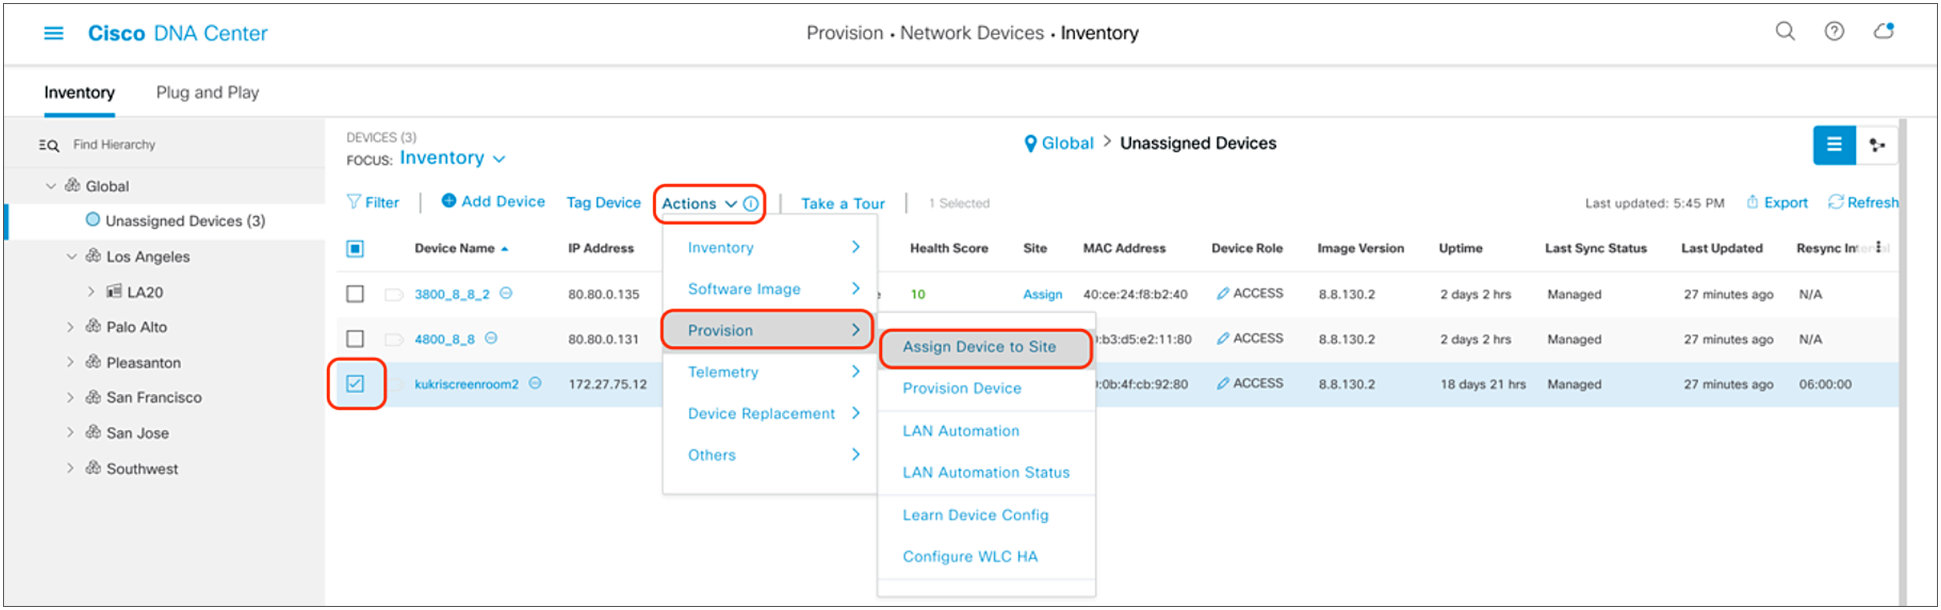
Assigning a WLC to a site on the Inventory page
3. Click Choose a Site (Figure 19).
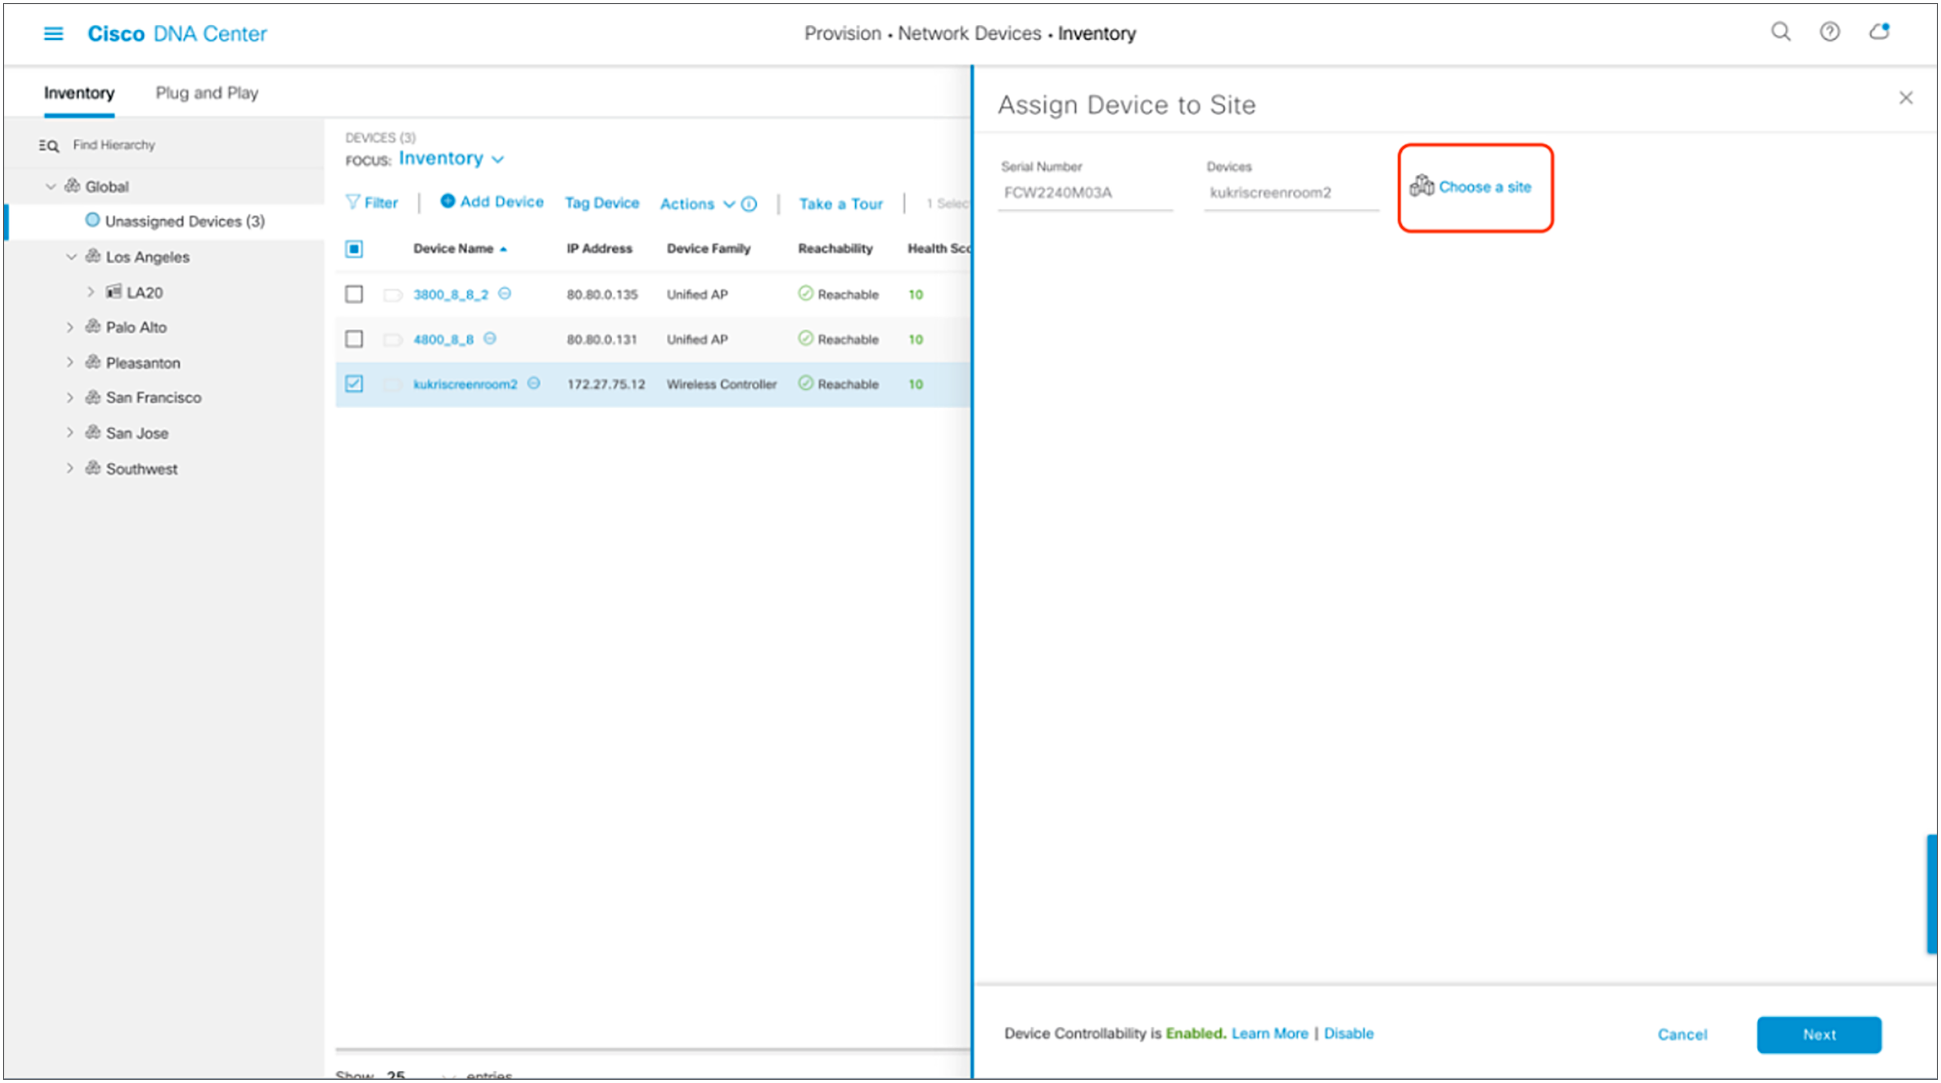
Menu that appears when clicking Assign Device to Site in Figure 19
4. Click the site you would like to assign the WLC to and click Save (Figure 20).
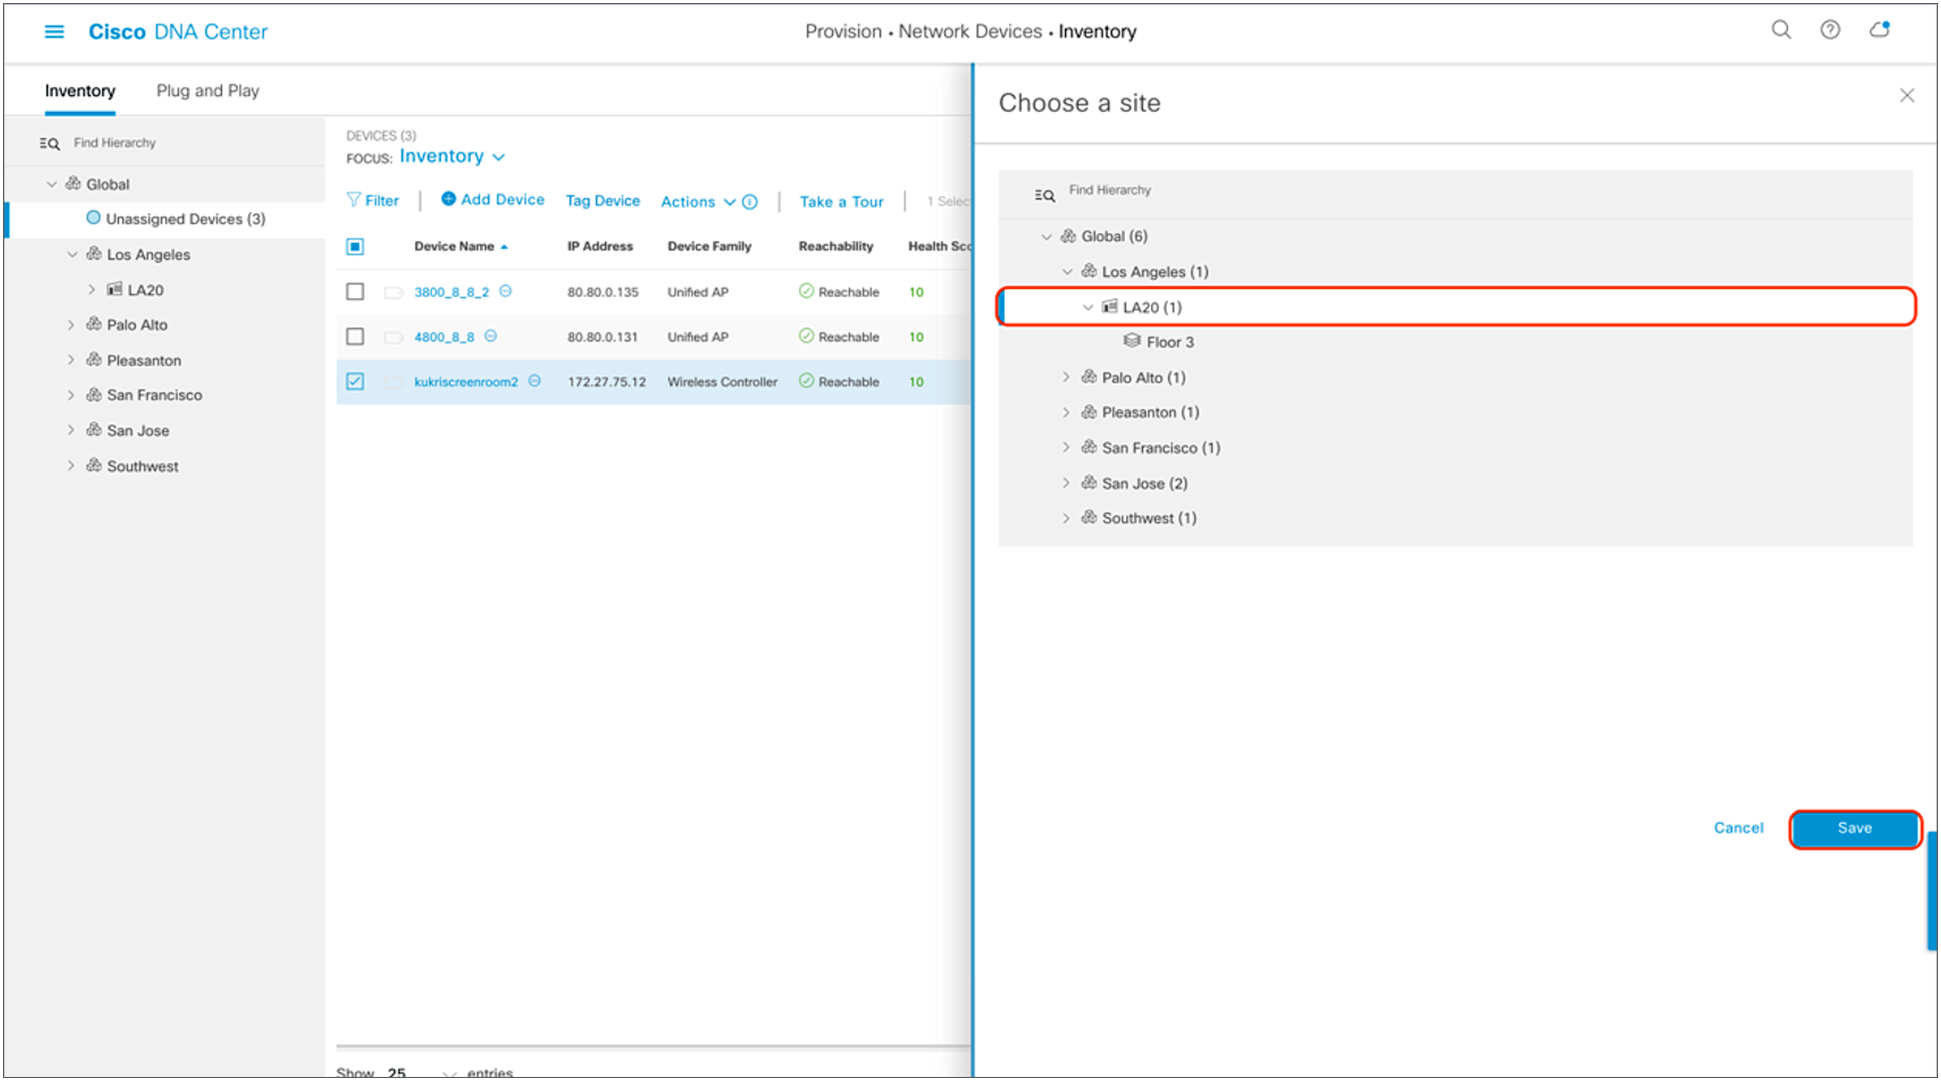
Site assignment
5. Click Next > Assign.
6. Repeat the same steps for your access points.
Step 5: Place your access points onto your floor map
The purpose of placing your access points onto your floor map is to provide you with a heat map visualization of the RF environment surrounding your access point.
1. Navigate to the Network Hierarchy page by clicking the hamburger menu in the top left corner of the screen. Click Design, then Network Hierarchy (Figure 21).
Location of Network Hierarchy from the hamburger menu
2. Expand Global > [the building you created], then click the floor you’ve assigned APs to.
3. Observe the blue flag on the right, which represents the number of APs that are ready to be placed onto the map (Figure 22).
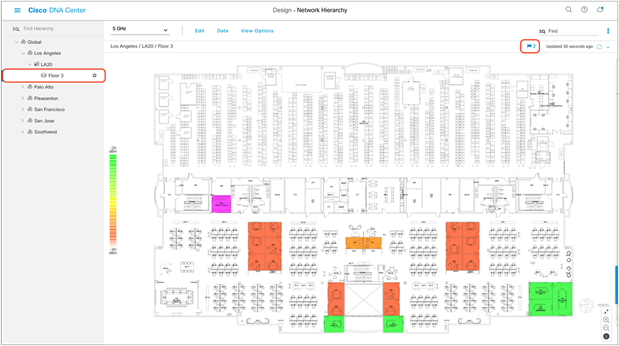
Network Hierarchy page, with two APs ready to be positioned on the floor map
4. Click Edit and then Position to place APs onto the map (Figure 23).
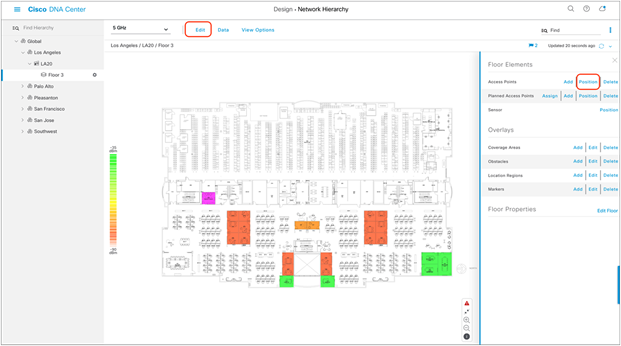
Network Hierarchy page showing Floor Elements menu
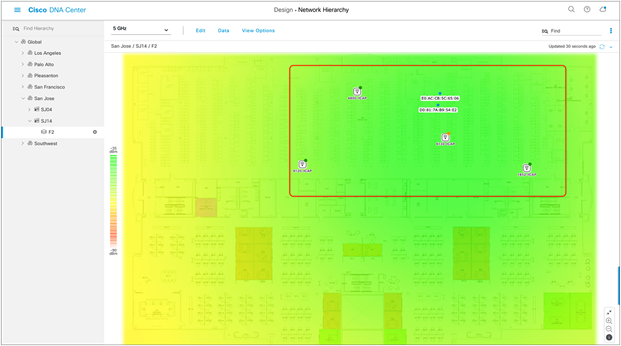
5. After placing the APs on the floor map, click Save to commit the change (Figure 24).
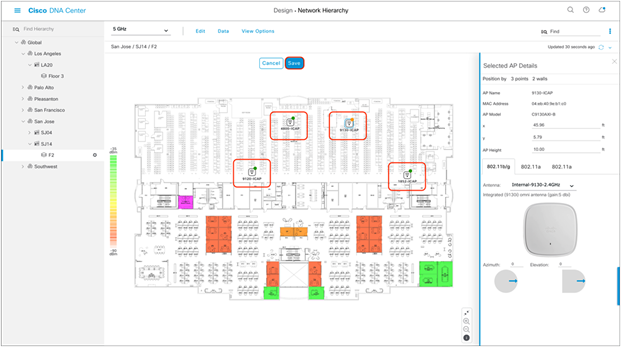
Network Hierarchy page with APs placed on the floor map
6. At this point, a color-coded heat map should show up on the floor map, depicting the APs’ surrounding RF environment (Figure 25).
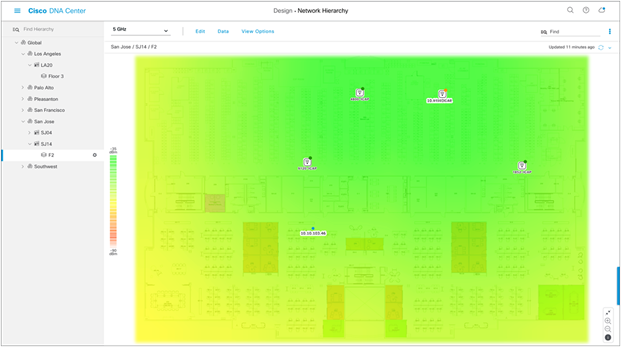
Network Hierarchy page showing the heat map displayed after APs are positioned
Table 6. Legend for heat map
| Heat map color legend |
|
| Color |
Signal strength |
| Green |
Strong RF signal |
| Yellow |
Good to fair RF signal |
| Orange |
Fair to poor RF signal |
| Red |
Bad RF signal |
Part 3: Integrate Cisco DNA Center with Cisco CMX
Description: Integrating Cisco Connected Mobile Experiences (CMX) with Cisco DNA Center will enable the floor map to locate and display an associated wireless client’s current and historical location.
Section goals: Properly integrate CMX with Cisco DNA Center to view an associated wireless client’s location.
Step 1: Add a WLC instance to CMX
For CMX to send client location data to Cisco DNA Center, you need to add the WLC to CMX.
1. Navigate to System, scroll down to the Controllers section, and then click the + button to add a new WLC (Figure 26).
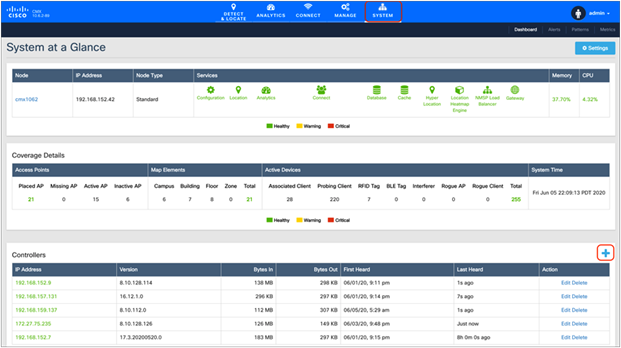
CMX System page where you can add a controller
2. Click Advanced in the Settings modal box that appears, and choose your controller’s type (AireOS or Polaris), add your controller’s IP address and SNMP write community, and then click Save to commit the change (Figure 27).
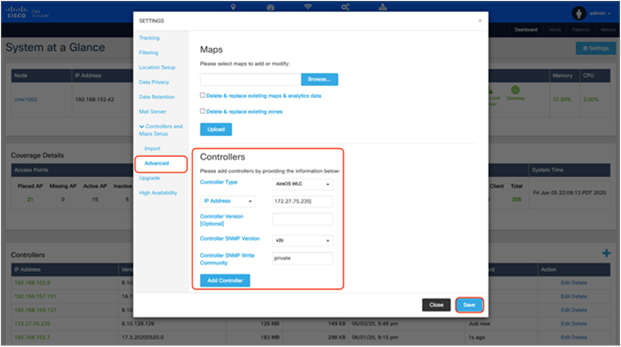
CMX Add Controller Settings modal box
3. Within a couple of minutes, you should see the Bytes In and Bytes Out counters increment, which signifies that communication between the WLC and CMX has been established (Figure 28).
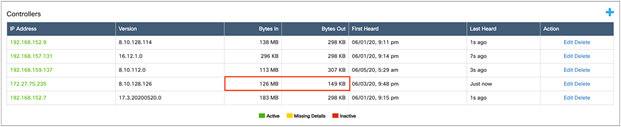
Bytes In and Bytes Out incrementing, indicating that the WLC is properly connected to CMX
Step 2: Add CMX to Cisco DNA Center
1. On Cisco DNA Center, open up the hamburger menu and click System and then Settings (Figure 29.)
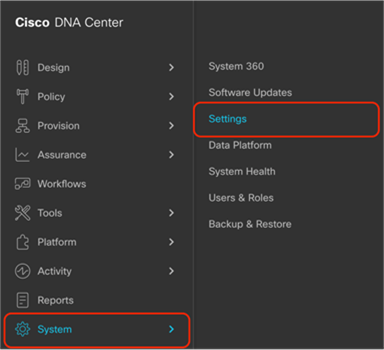
Location of Settings within the hamburger menu
2. On the search bar to the left, type CMX, then click CMX Servers (Figure 30).
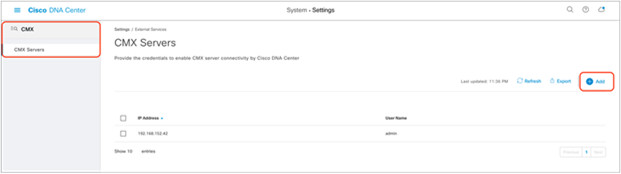
Location of CMX Servers within the Settings page
3. Click the Add button, then fill in the CMX IP Address, User Name, Password, SSH User Name, and SSH Password in the form on the right. Click the Add button within the form to save your changes (Figure 31).
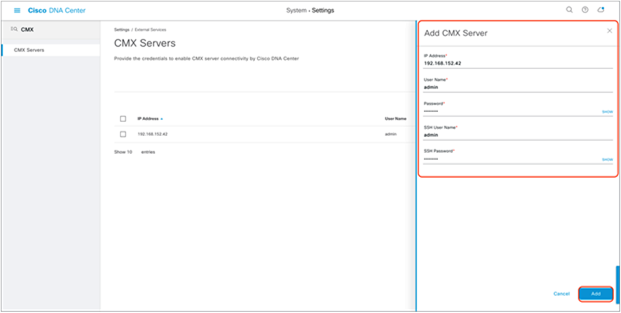
Providing CMX credentials to Cisco DNA Center during integration
4. Now that CMX integration is complete, navigate back to your floor under the site hierarchy, click the gear icon next to either the floor itself or any parent site it falls under, then click Sync with CMX to ensure that Cisco DNA Center and CMX are communicating properly (Figure 32).
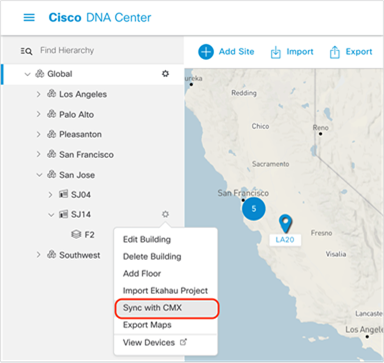
Location of Sync with CMX button
5. Navigate back to CMX and observe that the floor map added to Cisco DNA Center has been successfully imported (Figure 33).
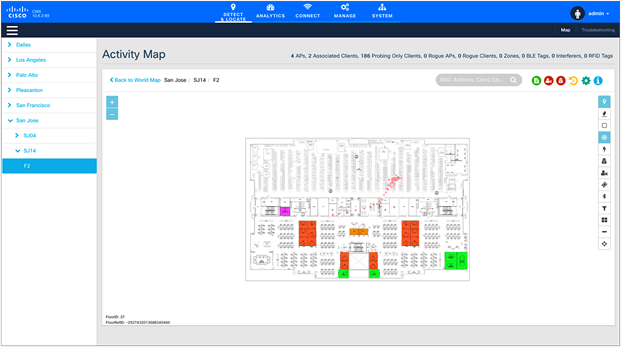
Floor map in CMX has been imported from Cisco DNA Center
6. If you have any clients joined to your APs, you should begin to see them on the heat map within a couple of minutes (Figure 34).
Client location shows up on the floor’s heat map
Part 4: Integrate Cisco DNA Center with vNAM
Description:
● The Cisco Prime vNAM provides all of the functionality found in the Cisco Prime NAM, permitting consistent application awareness, comprehensive performance analytics, and deep network visibility.
● The Cisco Prime vNAM allows network administrators to:
◦ Gain Layer 4 through 7 application visibility using Cisco Next-Generation Network-Based Application Recognition (NBAR2) natively in the NAM to help identify and improve the performance of business-critical applications
◦ Analyze network usage by applications, hosts, or virtual machines, and conversations to identify bottlenecks that may affect performance and availability
◦ Troubleshoot performance problems consistently across physical and virtual environments using detailed flow- and packet-based analytics
◦ Eliminate the need to backhaul the data to a centralized location by using the integrated web-based interface for remote management and monitoring
◦ Validate infrastructure updates such as Quality-of-Service (QoS) policy changes
Section goals: Properly integrate vNAM with Cisco DNA Center to provide deep network visibility when using Intelligent Capture’s Data Packet Capture feature.
Step 1: Bring up vNAM on a VMware ESXi.
1. Use the following link to acquire the vNAM 6.4.2 OVA file and bring it up on your ESXi: http://cs.co/9009GHYGV (Figure 35).
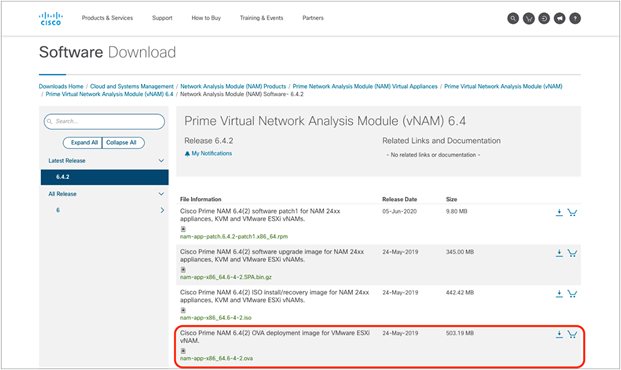
Location of the vNAM 6.4.2 OVA file
Step 2: Configure vNAM to establish communication with Cisco DNA Center
1. Log in to the vNAM console through ESXi, using the default credentials (root/root).
2. Run the following command to determine if any data ports have been assigned an IP address:
show data-port ip-addresses
3. If no port/address pairs are displayed, assign an IP address to data-port 1 by running the command:
data-port 1 ip-address <IP to assign to vNAM >
Note: Record the IP address, as it will be used in the Cisco DNA Center configuration steps.
4. Set up the database export function by issuing the command:
cdb-export collector 1 ip-address <IP of Cisco DNA Center>
5. Verify the change by issuing the following command:
show cdb-export 1
6. Run the following command to verify that autocreate-data-source is enabled for ERSPAN:
show autocreate-data-source
7. If ERSPAN autocreation is not enabled, run the following command:
autocreate-data-source erspan
8. Run the following command to verify that the vNAM is configured to use a Network Time Protocol (NTP) server:
show time
9. If the vNAM time is not synchronized with an NTP server, run the following commands:
time (to enter the Time subcommand menu)
sync ntp <name or IP address of NTP server>
Step 3: Configure Cisco DNA Center to establish communication with the vNAM
1. Navigate to the gRPC-Collector page by opening up the hamburger menu and clicking System and then Data Platform (Figure 36).
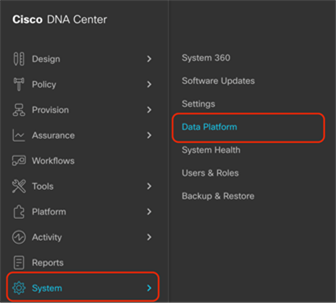
Location of Data Platform within the hamburger menu
2. Click Collector, then scroll down and click GRPC-COLLECTOR (Figure 37).
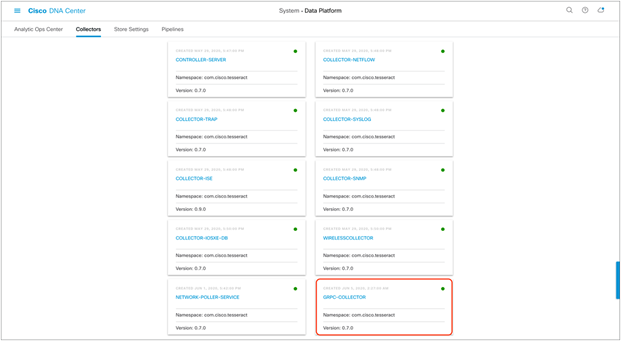
GRPC-COLLECTOR button within Data Platform
Click Add and then fill in the information as follows (Figure 38):
a. Select the Cisco DNA Agent Export check box.
b. Enter the vNAM IP within Cisco DNA Agent IP Address.
c. Provide any unique name under Configuration Name.
d. Click Save Configuration.
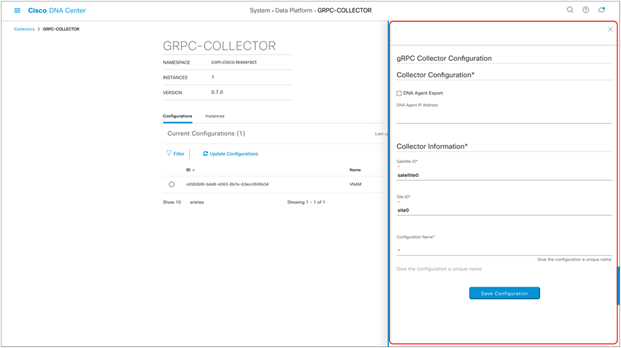
Credentials required to connect vNAM with Cisco DNA Center
3. Ensure that the gRPC collector has been saved and that the entry is listed (Figure 39).
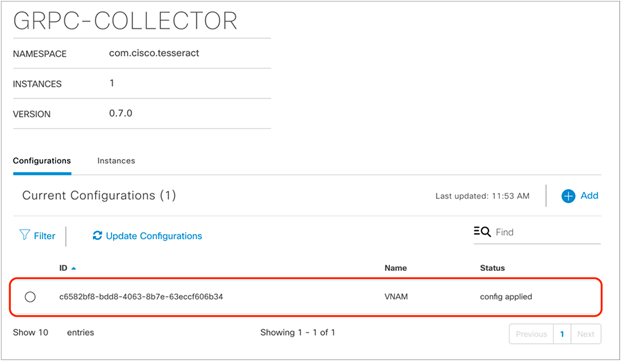
gRPC collector entry created
Note:
● Only one GRPC-COLLECTOR configuration should be added. If more than one is added, only the last added configuration will be used.
● Once the Cisco DNA Agent Export box has been checked, vNAM integration is enabled for any client with full packet capture enabled. This topic will be discussed in a later section.
Day-1 Intelligent Capture features and use cases
The following subsections provide step-by-step instructions for enabling the features of Intelligent Capture, first from the AP perspective and then from the client perspective. The discussion will also provide you with a deep understanding of each of the use cases and details on how they are used to troubleshoot an issue.
Intelligent Capture feature names on Cisco DNA Center differ slightly from the names on the device side. When you enable certain features from Cisco DNA Center, multiple features are actually being enabled on the device side.
Table 7. Mapping of Intelligent Capture feature names from Cisco DNA Center to the device
| Cisco DNA Center feature name |
WLC and AP feature name |
| Data Packet Capture |
Full Packet Capture |
| Live Capture |
Partial Packet Capture Client Filtered Statistics |
| AP Stats Capture |
AP WLAN Statistics AP RF Statistics Client RF Statistics |
| Anomaly Stats Capture |
Anomaly Detection Anomaly Packet Capture Anomaly Individual Reports Anomaly Summary Reports |
| Spectrum Analysis |
Spectrum Analysis |
Part 1: Intelligent Capture for access points
Description: Intelligent Capture for the access point offers two main features: always-on real-time RF monitoring and on-demand spectrum analysis.
Section goals: Enable and view Intelligent Capture data for AP RF Statistics and Spectrum Analysis.
Step 1: Enable AP Stats Capture
When AP Stats Capture is enabled, Cisco DNA Center is actually enabling two features: AP RF Statistics and Client RF Statistics.
1. Navigate to the Intelligent Capture Settings page by opening the hamburger menu, then clicking Assurance and then Intelligent Capture Settings (Figure 40).
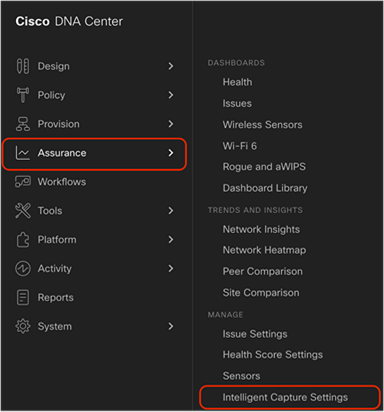
Location of Intelligent Capture Settings on the hamburger menu
2. Option 1 – Enable specific APs only: Click Access Point, then click Specific – select specific APs and enable or disable to select individual APs from your site. Click Enable to enable Intelligent Capture (Figure 41).
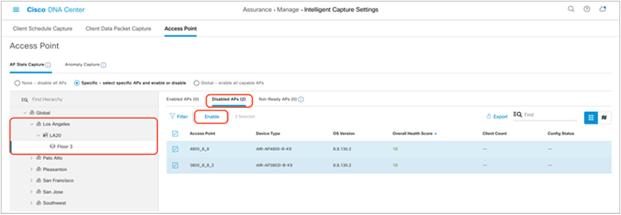
Selecting and enabling APs from the Specific – select specific APs and enable or disable section
3. Ensure that the APs move from the Disabled APs column to the Enabled APs column (Figure 42).
● Note: The blue dot next to the AP indicates that the device is newly discovered.
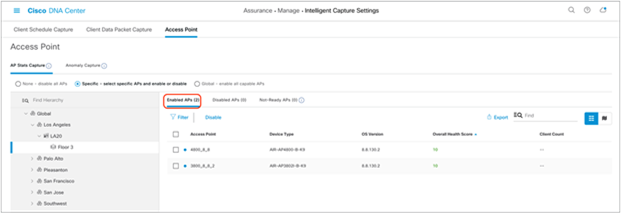
AP Stats Capture is enabled for specific APs
4. Option 2 – Enable all APs: Click Global – all capable APs are enabled to enable Intelligent Capture for APs in this Cisco DNA Center cluster. Then ensure that the page changes to show Globally Enabled (Figure 43).
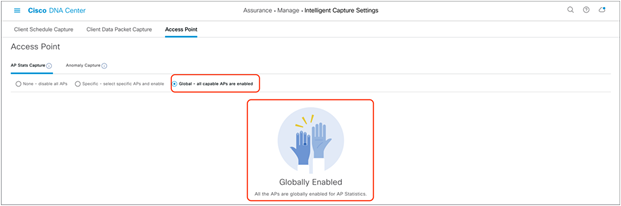
AP Stats Capture is enabled at the global level
Notes:
● When AP Stats Capture is being enabled, a loading bar will indicate the estimated time it will take for the configuration to complete (Figure 44).
● Cisco DNA Center can support up to 1000 APs for AP Stats Capture.
● You can leave this screen while the configuration is completing without affecting the configuration.
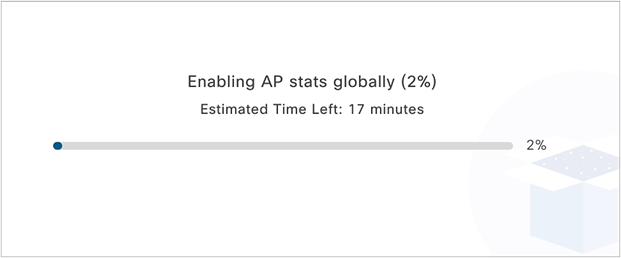
Loading bar showing the time it will take to push the Intelligent Capture configuration to the WLC
Step 2: Navigate to the AP RF Statistics page
1. Option 1 – Inventory page: Navigate to the Intelligent Capture AP RF Statistics page by clicking the three dots next to your selected AP within the Inventory and then clicking View 360 (Figure 45).
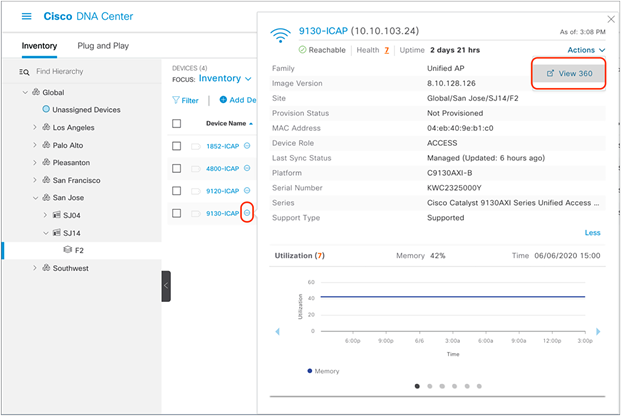
How to enter the access point Device 360 page from Inventory
2. Option 2 – Network Health page: Navigate to the Network Heath page by opening the hamburger menu in the top right corner of the page, clicking Assurance, then Health, and then Network. Scroll down to the Network Devices table at the bottom of the page and click on the AP you want to view (Figure 46).
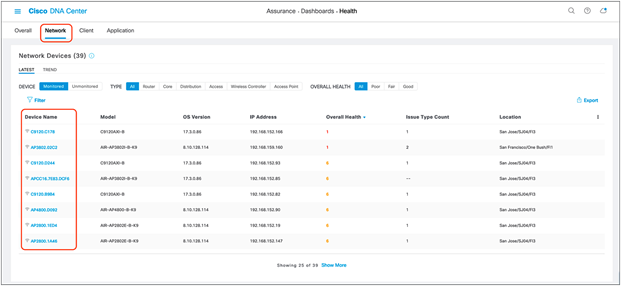
Navigating to the Device 360 page through the Network Health page
3. Click the Intelligent Capture button to enter the AP RF Statistics page (Figure 47.).
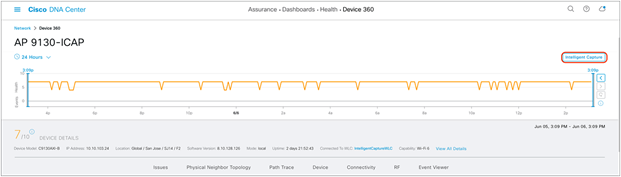
Intelligent Capture button on the Device 360 page
Step 3: View the AP RF Statistics page
Description: The AP RF Statistics page provides an in-depth analytical view of various wireless metrics related to an AP’s radio.
Purpose: Provide a trend view of the historical wireless metrics of an AP’s radio that will give the user insight into why users may be experiencing wireless problems such as poor signal, onboarding issues, throughput issues, etc.
Note: The AP RF Statistics page is displayed per serving radio. By default, when you enter this page, you will show up on radio 0. If you click on the menu (Figure 48), you will have an option to view the AP RF statistics for any of the AP’s serving radios.
Table 8. Description of the AP RF Statistics trend charts shown in Figures 48 and 49
| Trend chart name |
Description |
| Clients |
Client count trend. |
| Top Clients with Tx Failed Packets by SSID |
Transmit packet error count per client categorized by SSID broadcasted by the AP. |
| Channel Utilization |
Channel utilization percentage trend categorized by:
● This AP (Tx + Rx): This AP’s channel utilization
● Other Wi-Fi: Nearby APs’ channel utilization
● Non-Wi-Fi: Any non-Wi-Fi RF
|
| Channel Utilization by This Radio |
Real-time view of this AP (Tx + Rx) by client and packet count per broadcasted SSID. |
| Tx Frame Count per Type |
Data and management frames trend. |
| Total Frame Error over the Air |
Rx and Tx frame count from all its neighbors on the same channel. |
| Tx Power and Noise Floor |
AP radio’s Tx power setting and surrounding noise floor trend. |
| Multicast/Broadcast Counter |
Multicast and broadcast counter trend. |
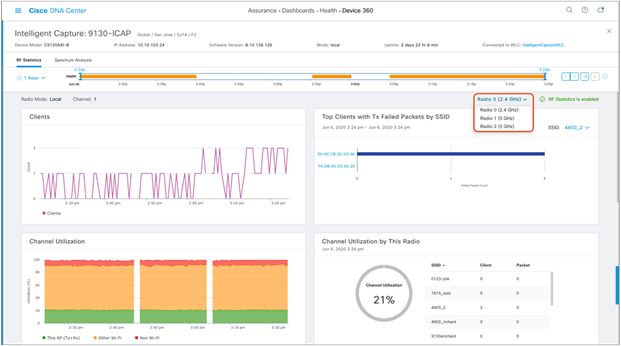
Top half of the AP RF Statistics page
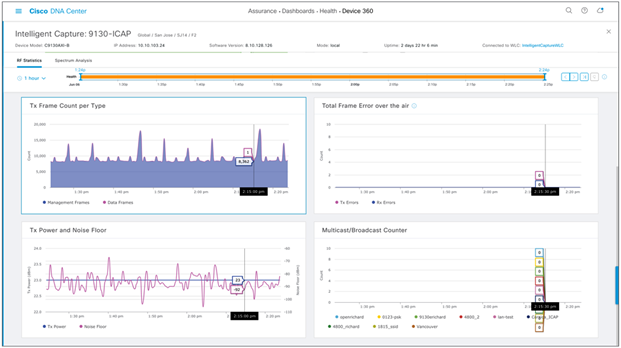
Bottom half of the AP RF Statistics page
1. To zoom into a particular widget, drag your cursor across a trend chart (Figure 50).
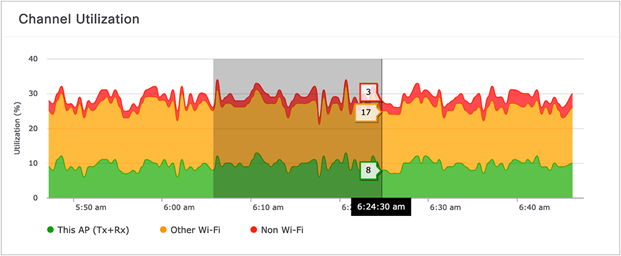
Zooming into an AP RF Statistics trend chart for the 5-GHz radio
2. The network time travel bar at the top allows you to do the following:
● View Intelligent Capture data for up to 14 days in the past.
◦ Click the clock (on the left) to select a date and time in the past to view, or click the left or right arrow (on the right) (Figure 51).
◦ Note: The left or right arrow network time travel toggle will by default move the time backward or forward by 1 hour.
● Change the time width for each of the trend widgets.
◦ Click the drop-down menu on the left, which defaults to 1 hour but can be toggled to 3 or 7 hours.
◦ Note: The amount of time the left and right arrow described above will travel is based on this time width.
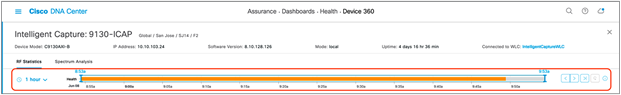
AP RF Statistics network time travel feature
Step 4: Navigate to and enable Spectrum Analysis
1. Navigate to the Spectrum Analysis page by clicking the Spectrum Analysis tab at the top of the AP RF Statistics page (Figure 52).
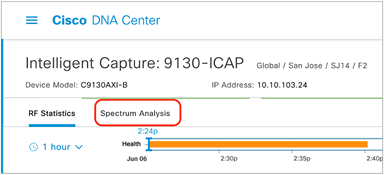
Location of Spectrum Analysis tab on the AP RF Statistics page
2. Click Start Spectrum Analysis to enable the feature on this AP (Figure 53).
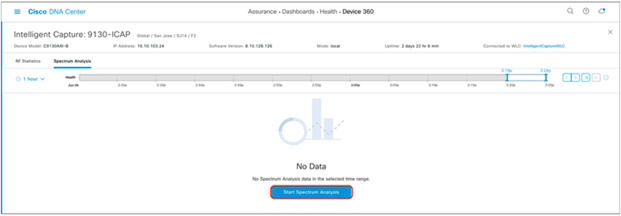
Location of the Start Spectrum Analysis button
Step 5: View Spectrum Analysis data
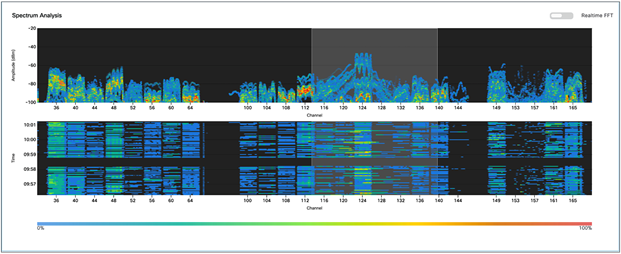
Description: Spectrum Analysis provides users with insight into the spectrum activities around their AP through three main charts: Channel by Amplitude, Channel by Time, and Interference and Duty Cycle.
● Channel by Amplitude:
◦ Persistent FFT: Shows the aggregated amplitude and frequency of the spectral energy observed over the past 5 minutes (Figure 54).
◦ Real-time FFT: Shows only the most recent amplitude and frequency of the spectral energy observed (Figure 55).
◦ Note: By default, this chart displays RF activity in a persistent FFT manner, but a toggle at the top enables you to show it in a real-time FFT manner (Figure 55).
◦ Color interpretation: The color in the charts represents the number of overlapping signals and can be interpreted by level of intensity with the color legend (Figure 54).
◦ Blue means a low number of overlapping signals.
◦ Red means a high number of overlapping signals.
● Channel by Time:
◦ This chart is also known as the swept spectrogram, and it displays a waterfall view of the aggregated swept spectrogram data for the last 5 minutes (Figures 54 and 56).
● Interference and Duty Cycle:
◦ This chart uses the FFT Duty Cycle report from the AP’s Cisco CleanAir feature to show the duty cycles and surrounding interferences (Figures 57 and 58).
Purpose: Provide insight into what’s going on in the RF environment surrounding an AP so you can better understand why wireless issues may be occurring for clients.
Notes:
● The Spectrum Analysis charts show data for the past 5 minutes.
● Beginning with software releases 8.10 MR3 and 17.3.1, APs support buffered FFT, which means that the AP will store the last 30 seconds of Spectrum Analysis data in its ring buffer, then externalize burst Spectrum Analysis data to Cisco DNA Center to quickly populate the last 30 seconds of spectrum data.
● Spectrum Analysis is supported only on the Aironet 2800 Series, 3800 Series, and 4800 and Catalyst 9120AX and 9130AX Series APs.
● When enabled, a configuration will be sent to the WLC to enable the CleanAir feature, followed by the feature itself.
● When enabled on the Aironet 4800 AP, by default, Cisco DNA Center will attempt to enable the feature on the AP’s third radio. If the third radio is being used for other features, such as Hyperlocation or Data Packet Capture, it will resort to enabling the features on serving radios 0 and 1.
With the feature enabled on the third radio, you will be able to view all RF activity on all channels for both the 2.4- and 5-GHz bands. When enabled on radios 0 and 1, you will be able to view RF activity only for the channels the AP’s radios are currently serving.
● When enabled on the Catalyst 9120AX and 9130AX Series APs, Spectrum Analysis is enabled on the RF ASIC analytics radio.
1. The Spectrum Analysis page is displayed per band (2.4 GHz and 5 GHz) and can be toggled via the menu shown at the top (Figure 54).
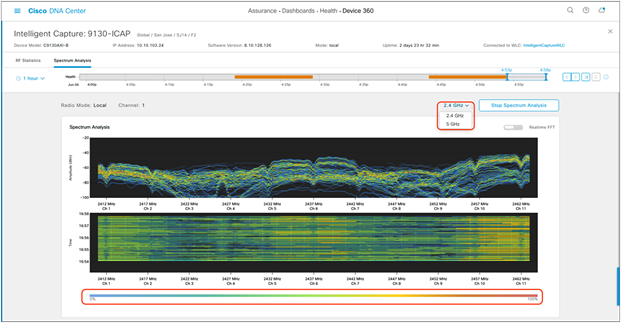
2.4-GHz Spectrum Analysis with persistent FFT enabled
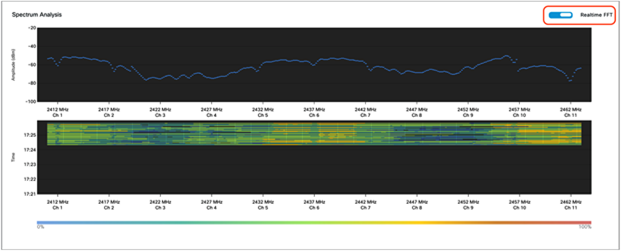
2.4-GHz Spectrum Analysis with real-time FFT enabled
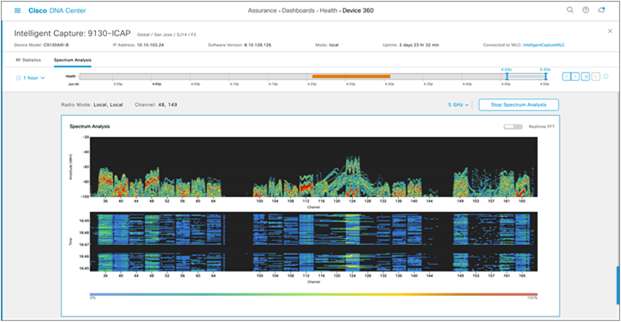
5-GHz Spectrum Analysis with persistent FFT enabled
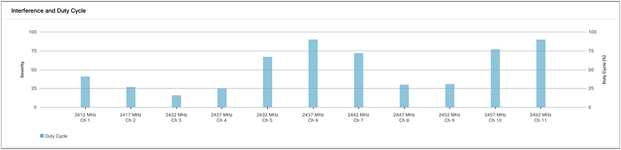
2.4-GHz Interference and Duty Cycle chart
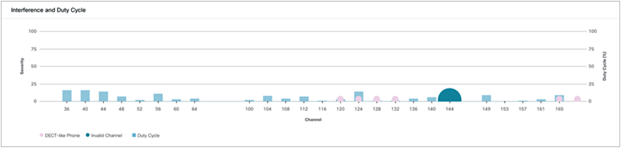
5-GHz Interference and Duty Cycle chart
2. To zoom into a Spectrum Analysis chart, drag your cursor across the chart (Figure 59).
Zooming into the Spectrum Analysis charts
3. The network time travel bar at the top allows you to do the following:
● View Intelligent Capture data for up to 14 days in the past.
◦ Click the clock (on the left) to select a data and time in the past to view, or click the left or right arrow (on the right) (Figure 60).
◦ Note: The left or right arrow network time travel toggle will by default move the time backward or forward by 1 hour.
● Change the time width for each of the trend widgets.
◦ Click the drop-down menu on the left, which defaults to 1 hour but can be toggled to 3 or 7 hours.
◦ Note: The amount of time the left and right arrows described above will travel is based on this time width.
Spectrum Analysis network time travel feature
Part 2: Intelligent Capture for clients
Description: Intelligent Capture for the client offers four main features: Data Packet Capture, Live Capture, Anomaly Detection and Packet Capture, and Client RF Statistics.
Packet Capture Use Cases
● Data Packet Capture is an on-demand feature that should be used when a user needs to view both management and unencrypted data frames of a client. Additionally, this feature can be used when trying to understand the performance behavior of a client. This packet capture option provides the most granular detail of the three packet capture options (Data Packet Capture, Live Capture, and Anomaly Detection) but can target only one client at a time.
● Live Capture is an on-demand feature that should be used when a user needs to view only the management frames. For example, a user can use Live Capture to understand a client’s onboarding behavior. This feature captures packets when the client joins and leaves the network and displays them on the Intelligent Capture event viewer. It can target up to 16 clients at once and can be scheduled ahead of time.
● Anomaly Detection is an always-on feature that should be enabled during day 0 of setting up Intelligent Capture. Management frames of a client with issues are automatically captured and displayed on the Intelligent Capture event viewer when there is a client onboarding issue.
Section goals: Enable and view all Intelligent Capture client-side data.
Step 1: Navigate to the Intelligent Capture Client page
1. Option 1 – hamburger menu: Open the hamburger menu and click Assurance, then Health (Figure 61).
2. Click the Client tab to navigate to the Client Health page (Figure 62).
3. Scroll down to the client devices table and click the client you want to view (Figure 62).
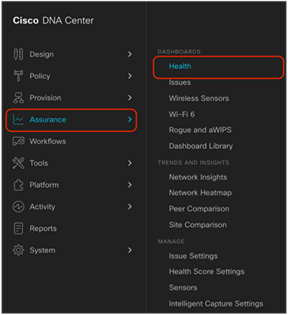
Location of Health in the hamburger menu
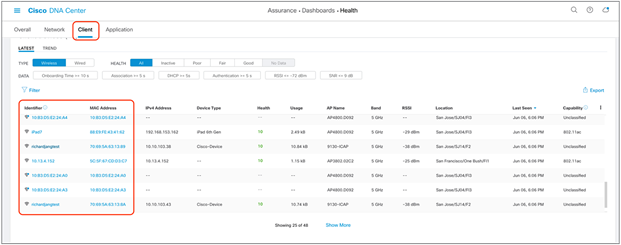
Location of the client devices table on the Client Health page
4. Option 2 – Search: Click the magnifying glass in the top right corner of any page. Enter either the client MAC address, the IP address, or the username the client used to join an 802.1X network (Figure 63).
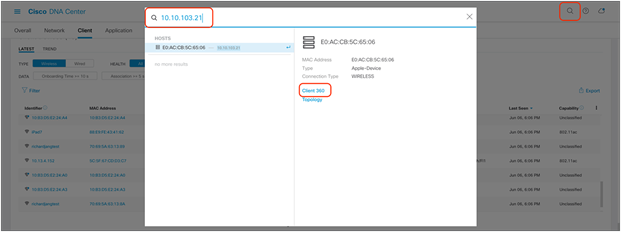
Entering the Client 360 page via the search function
5. On the right side of the screen, click the Intelligent Capture button to enter the Intelligent Capture client page (Figure 64).
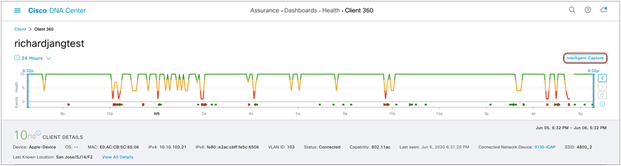
Location of the Intelligent Capture button on the Client 360 page
6. You arrive at the Intelligent Capture Client page (Figure 65).
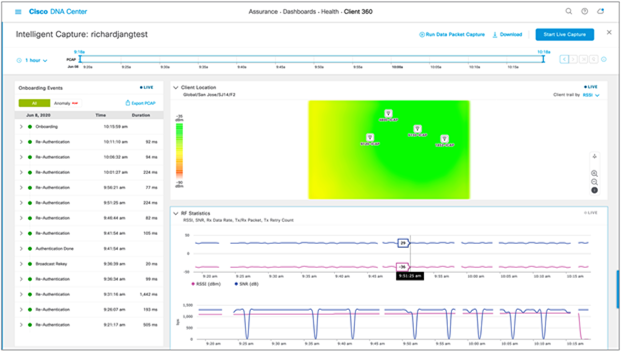
Intelligent Capture Client page
Step 2: Enable and view Data Packet Capture data
Description: Enabling Data Packet Capture will allow supported access points (Aironet 4800 and Catalyst 9130AX) to capture both the data and management packets of a single client and send this data to Cisco DNA Center in an unencrypted manner.
Purpose: Provide packet-level insight into issues such as onboarding and throughput. The ability to view packets in unencrypted form enables you to understand the issue at hand on a level that was not possible in debugging prior to Intelligent Capture.
Notes:
● Only a single client can be targeted by Data Packet Capture at any given time on an entire Cisco DNA Center cluster.
● Packet capture files will be stored at a size of up to 100 MB before a new file is created.
● If a client roams from one Data Packet Capture supported AP to another, Cisco DNA Center will stitch all the packet captures into one for the user to download.
1. To enable Data Packet Capture, click Run Data Packet Capture at the top of the page (Figure 66).
2. To view the packet captures sent from the AP, click the Download button at the top of the page to open a menu of all previous data packet captures taken (Figure 66).
3. To download the packet capture file to your local computer, click the down arrow in the Download column next to the packet capture you would like to download (Figure 66).
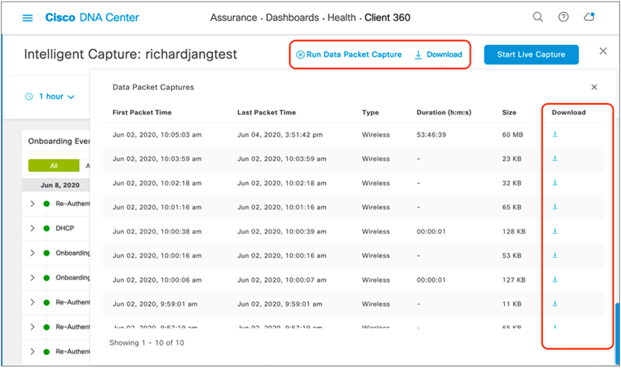
Enabling Data Packet Capture, and downloading packets captured
4. To view any ongoing or completed Data Packet Capture sessions, navigate to the Intelligent Capture Settings page by opening the hamburger menu and clicking Assurance, then Intelligent Capture Settings, and you will arrive at the Client Data Packet Capture page (Figure 67).
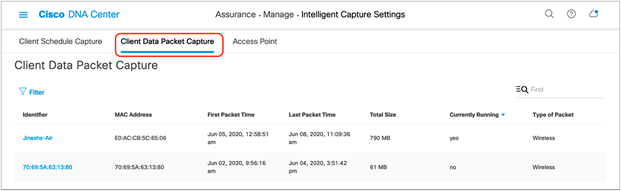
Viewing ongoing or completed Data Packet Capture sessions
Step 3: Enable and view Live Capture data
Description: Enabling Live Capture will allow supported access points to send onboarding packets and client statistics data at a frequency of every 5 seconds as well as allowing controllers to send onboarding events to Cisco DNA Center at a frequency of every 2 seconds.
Purpose: Target specific clients with onboarding issues to troubleshoot and have both the AP and WLC dump as much relevant data about them as possible in live time for easy root cause analysis.
Notes:
● Live Capture can be enabled for up to 16 clients on Cisco DNA Center at once.
● Once started, Live Capture will be enabled for 3 hours (unless manually stopped).
1. To enable Live Capture, click Start Live Capture at the top of the page (Figure 68).
2. To view the captured onboarding packets, look at the Onboarding Events viewer on the left of the page for events with a PCAP symbol. Click an event with this symbol to open up all details regarding the event, then scroll down to view the auto packet analyzer, which provides a graphical view of the onboarding packets captured (Figure 69).
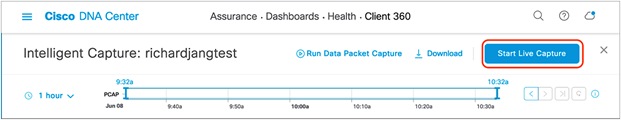
Enabling Live Capture
Onboarding Events viewer and auto packet analyzer depicting onboarding packets
Step 4: Schedule a Live Capture
Description: This feature provides you the option to schedule a Live Capture, described in step 3 above, at a specific date and time for a specific duration (30 minutes to 8 hours).
Purpose: If a Cisco DNA Center user knows of a recurring issue from a specific client that comes in at a specific time of day, this feature provides the ability to begin automatically capturing data on that client the moment it comes into the proximity of the wireless network.
Note: You can schedule up to 12 scheduled Live Captures at once. Recall that you can enable up to 16 Live Captures total, meaning that although you can schedule only 12 at once, you can manually enable the remaining 4 through the Intelligent Capture Client page.
1. Navigate to the Intelligent Capture Settings page by opening the hamburger menu and clicking Assurance and then Intelligent Capture Settings. You will arrive at the Client Schedule Capture page (Figure 70).
2. Click + Schedule Client Capture (Figure 70).
3. Configure when you want to schedule a Live Capture, then provide either the user ID, hostname, or MAC address of the client you would like to capture. Click Save (Figure 71).
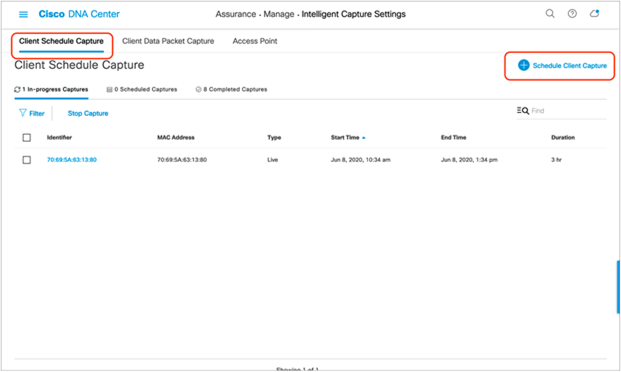
Scheduling a Live Capture on the Client Schedule Capture page
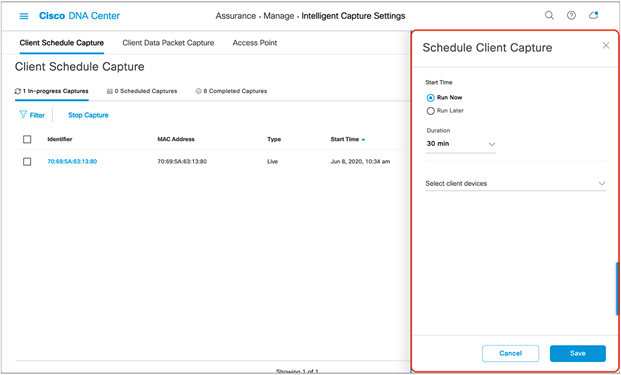
The Schedule Client Capture menu
4. To view the Live Captures that are currently in progress, whether scheduled or manually enabled, click In-Progress Captures (Figure 72).
5. To view the Live Captures scheduled in the future, click Scheduled Captures.
6. To view the scheduled or manually enabled Live Captures that have completed, click Completed Captures.
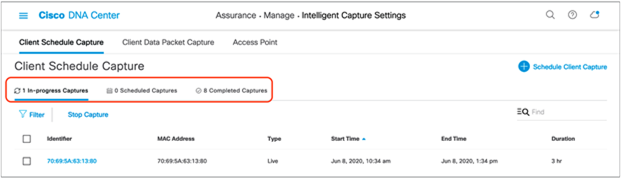
Viewing the progress of various Live Captures
Step 5: View Client RF Statistics
Description: The Client RF Statistics trend charts provide users with an in-depth analysis view regarding a client’s connectivity to the wireless network.
Purpose: Provide a trend view of the historical wireless metrics of a client’s connectivity to an AP that will give insight into why users may be experiencing wireless problems such as poor signal, onboarding issues, throughput issues, etc.
Table 9. Description of the Client RF Statistics trend charts shown in Figure 73
| Trend chart category |
Description |
| RSSI and SNR |
Historical Received Signal Strength Indicator (RSSI) (dBm) and Signal-To-Noise Ratio (SNR) (dB) per client |
| Rx Average Data Rate and Rx Last Data Rate |
Historical receive average data rate (bps) per client |
| Tx Packets and Rx Packets |
Historical transmit and receive packet count per client |
| Tx Packet Retry |
Historical transmit packet retry per client |
1. To view Client RF Statistics, scroll down the Intelligent Capture client page (Figure 73).
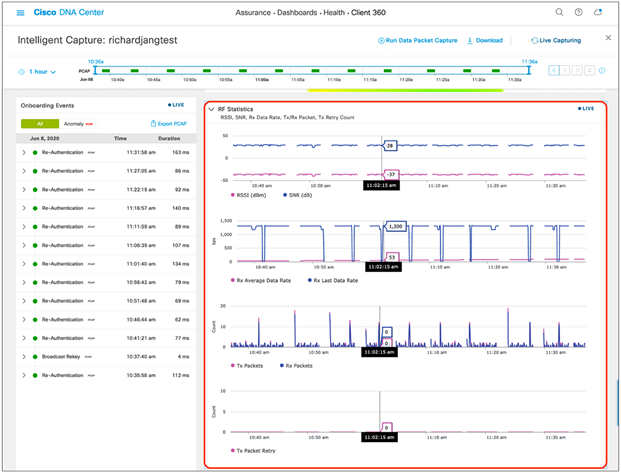
Client RF Statistics trend charts
2. To zoom into a Client RF Statistics chart, drag your cursor across the chart (Figure 74).
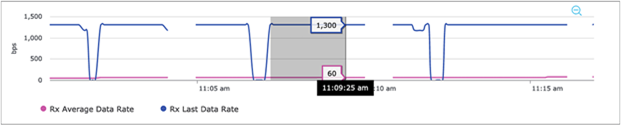
Zooming into a Client RF Statistics chart
3. The network time travel bar at the top allows you to do the following:
● View Intelligent Capture data for up to 14 days in the past.
◦ Click the clock (on the left) to select a data and time in the past to view, or click the left or right arrow (on the right) (Figure 75).
◦ Note: The left or right arrow network time travel toggle will by default move the time backward or forward by 1 hour.
● Change the time width for each of the trend widgets.
◦ Click the drop-down menu on the left, which defaults to 1 hour but can be toggled to 3 or 7 hours. (Figure 75).
◦ Note: The amount of time the left and right arrow described above will travel is based on this time width.
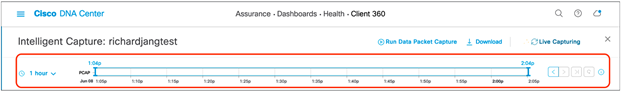
Client RF Statistics network time travel feature
Step 6: Enable and view Anomaly Stats Capture
Description: Anomaly Detection allows the WLC and APs to work together to detect client onboarding issues and send Cisco DNA Center an anomaly event as well as packet captures depicting the issue that had occurred. The WLC’s anomaly event will be the red onboarding event (signifying a failed event) that appears in the Onboarding Events viewer. The AP’s anomaly event will be used to match the anomaly packets captured to the failed onboarding event the WLC has sent.
Purpose: Provide users with an immediate understanding of any client onboarding issue that has occurred, provide an analysis, and present a packet capture depicting the incident as proof.
Table 10. Onboarding anomalies that an AP is able to detect and what they mean
| Anomaly type |
Description |
| 802.1X Timeout |
Triggered when a client takes too long to respond to an AP’s EAP request |
| DHCP Timeout |
Triggered when either the DHCP server’s DHCP offer or a client’s DHCP request takes longer than the DHCP timeout time configured |
| EAP ID Timeout |
Triggered when a client takes too long to respond to an AP’s EAP request. |
| Invalid RSNIE Within Association Request |
Triggered when a client sends an association request to the AP with a corrupt RSN information element (RSNIE) value |
| 4-Way Handshake Timeout |
Triggered when a client ignores the M1 or M2 sent by the AP during a 4-way handshake |
| Unsupported Rates |
Triggered when a client sends the AP an association request but with data rates that don’t match the mandatory data rates configured on the WLC |
| Mismatching Replay Counters |
Triggered when a retry packet’s replay counters are not sent in proper incremental order |
| Invalid MIC |
Triggered when a client sends an invalid M2 or M4 during a 4-way handshake to the AP |
| GTK Handshake Timeout |
Triggered when a client either ignores the M1 or sends an invalid M2 during the reauthentication handshake |
If anomaly packets are not seen with the red onboarding event, Cisco DNA Center will provide a reason for why this might be happening.
Table 11. Reasons why anomaly packets might not be correlated with a red onboarding event
| Scenario |
Description |
| No Packets due to all packets already sent for this Client |
The AP already sent packets for this client a moment ago |
| No Packets Due to Anomaly Being Disabled on Cisco DNA Center |
Anomaly Detection is not enabled. |
| No Packets Due to AP Throttling |
By default, Anomaly Detection individual reports throttling is set to 100 when the feature is enabled, meaning that only 100 anomaly events can be sent per AP to Cisco DNA Center every 5 minutes. If more than 100 events are detected, those will not be sent until the 5 minutes are up. |
| No Packets Due to Channel Busy |
The channel that the AP’s radio is serving on is too congested to capture packets. |
| No Packets Due to GRPC Link Error |
There is a connectivity issue between the AP and Cisco DNA Center. |
| No Packets Due to High CPU |
The AP has a CPU utilization of 90% or higher. |
| No Packets due to Packet Attachment being Disabled |
Anomaly Packet Trace is disabled on the WLC. |
| No Packets due to Queue Empty |
The AP already sent packets for this client a moment ago. |
| No Packets Due to Reason Unknown |
The AP’s firmware has encountered an issue. |
| No Packets Due to Unsupported AP |
The client is joined to an AP that does not support Intelligent Capture. |
4. Navigate to the Intelligent Capture Settings and enable Anomaly Capture in the same manner that you enabled AP Stats Capture in the previous section (Figure 74).
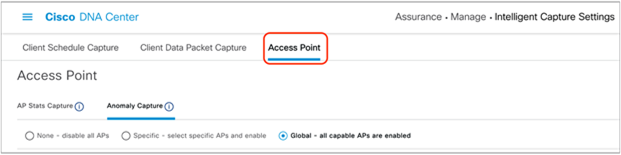
Location of Anomaly Capture on the Intelligent Capture Settings page
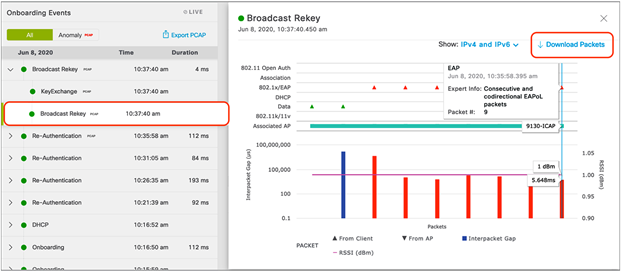
5. View the Onboarding Events viewer on the left. If a client onboarding anomaly has occurred, you will see a red event with a red PCAP symbol (it will look the same as an onboarding packet capture, but with red text). Expand this event with the down arrow to open up the child events within, and click the red event (Figure 77).
6. At the top of the anomaly event menu that opens, you will observe a plain text message depicting exactly which onboarding anomaly occurred during this event (Figure 77).
7. Scroll down the menu. You will be able to find the anomaly packets shown in the auto packet analyzer, and can download the packets with the Download Packets button (Figure 77).
● The top left half of the chart categorizes the different packets within the Anomaly Packet Capture (802.11 Open Auth, Association, 802.1X/EAP, DHCP, Data, 802.11k/11v).
● The red and blue bars measured by the bottom left Y-axis of the chart depict the interpacket gap (in microseconds) of the packets. The bar is blue when there are no issues with the packets exchanged, but is red when the packets are determined to be the reason for an onboarding failure.
● The purple line measured by the bottom right Y-axis of the chart represents the RSSI between the AP and the client during the packet exchanges.
● Each triangle within the chart represents a single packet, and the direction of the triangles represents the direction of the packet (up means from client to AP, down means from AP to client).
● Red triangles represent packets that caused the onboarding anomaly, whereas green triangles represent properly exchanged packets.
● The horizontal green bar in the chart represents the AP that the client had been connected to during this packet capture. If the client roamed between different APs, you will see a different-colored bar in portions of the chart when that had happened to represent what packets were sent by which AP.
● The white portion of the chart represents the time slot of the current event you’re looking at, whereas the gray portion of the chart represents the packet exchange activity that occurred prior to this anomaly. This feature provides background as to what packet exchange occurred prior to the onboarding failure.
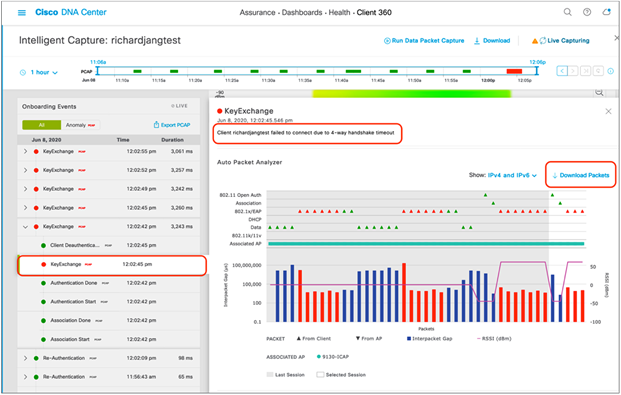
Viewing an anomaly event message and packets
8. When you download the anomaly packets and open the file up in Wireshark, you will observe that the packets downloaded represent exactly what is shown in the auto packet analyzer (Figure 78).
● You will be able to confirm that the issue that Intelligent Capture claimed to have happened really happened.
● Example: Intelligent Capture claimed that the client onboarding failure was due to a 4-way handshake timeout. If you look at the packet capture in Figure 78, you’ll observe that the AP sent the client three M1 message to start the 4-way handshake; however, the client never responded with an M2. The AP then sent the client a deauthentication packet with the reason code of 4-Way Handshake timeout.
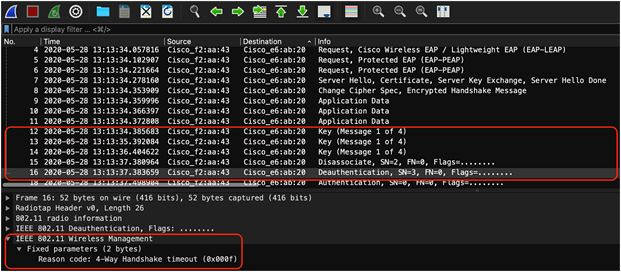
4-way handshake timeout depicted by the anomaly packets
9. If you would like to filter the Onboarding Events viewer to show only the anomaly events with anomaly PCAPs, click the Anomaly PCAP tab at the top of the viewer (Figure 79).
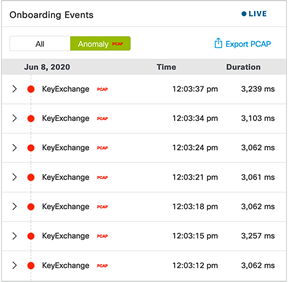
Filtering the Onboarding Events viewer to show only anomaly events with PCAPs
10. If you want to download multiple anomaly or Live Capture packets, you can click the Export PCAP button, and Cisco DNA Center will allow you to choose a range of onboarding events to download packets from. It will then stitch these packets together from your range of chosen events and allow you to download them as a single file (Figure 80).
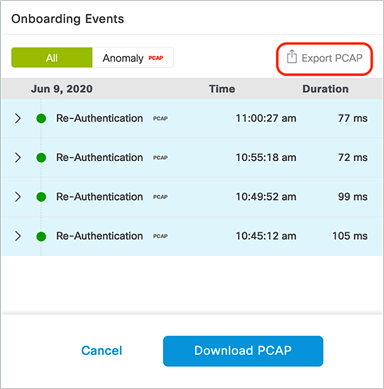
Downloading a range of anomaly or Live Capture packets
Device configurations and show commands
Description: If you encounter an issue with Intelligent Capture, device-side show and configuration commands will help you troubleshoot and determine the root cause of the issue.
Section goals: Understand the show and configuration commands for AireOS WLC, Cisco IOS XE WLC, and access points.
View the Cisco DNA Center IP and gRPC ports that are configured on joined APs:
● show icap summary
View the Cisco DNA Center IP and statuses of the connections that are configured on the WLC:
● show network assurance summary
View the enablement status of various Intelligent Capture features at a global, group, and AP level with varying levels of detail:
● show icap {global | group} {summary | all}
● show icap {global | group} detail {full-packet-trace | partial-packet-trace | anomaly-detection | individual-report | summary-report | client-statistics | client-stats-filter | system-statistics | radio-statistics | memory-statistics | wlan-statistics | dns-statistics | interface-statistics | routing-statistics | rf-spectrum}
● show icap ap <AP Name> {summary | all | operational | capability}
● show icap ap <AP Name> detail {full-packet-trace | partial-packet-trace | anomaly-detection | individual-report | summary-report | client-statistics | client-stats-filter | system-statistics | radio-statistics | memory-statistics | wlan-statistics | dns-statistics | interface-statistics | routing-statistics | rf-spectrum}
View the serviceability statuses of joined APs at a global or per-AP level that depict whether or not the APs have a properly established connection with Cisco DNA Center:
● show icap serviceability summary
● show icap serviceability detail all
● show icap serviceability detail ap <AP name>
AireOS WLC configuration commands
Configure the Intelligent Capture gRPC port that an AP will be using to externalize data:
● config icap server port <gRPC Port>
Configure the Intelligent Capture IP that the WLC and APs will be externalizing data to:
● config network assurance url <Cisco DNA Center IP>
Enable AP RF Statistics:
● config icap global subscription ap statistics {dns | interface | memory | radio | routing | system | wlan}
◦ Only WLAN and radio statistics data are consumed on Cisco DNA Center.
◦ Note: If you would like to enable the feature on a AP group, replace global with ap <AP Name> or group <AP Group Name>, respectively.
Anomaly Detection-related configurations:
● config icap global subscription client anomaly-detection enable
◦ Enables APs to begin detecting client anomalies.
● config icap global subscription client anomaly-detection disable
◦ Disables Anomaly Detection on APs.
● config icap global subscription client anomaly-detection filter {add | remove}
◦ Adds or removes a client MAC address for Anomaly Detection.
◦ This configuration isn’t enabled when the feature is enabled from Cisco DNA Center.
● config icap global subscription client anomaly-detection packet-trace trigger add ap
◦ Enables APs to send anomaly packets to Cisco DNA Center.
● config icap global subscription client anomaly-detection packet-trace trigger remove ap
◦ Disables APs from sending anomaly packets to Cisco DNA Center.
● config icap global subscription client anomaly-detection report-individual enable
◦ Enables APs to send anomaly events to Cisco DNA Center.
● config icap global subscription client anomaly-detection report-individual disable
◦ Disables APs from sending anomaly events to Cisco DNA Center.
● config icap global subscription client anomaly-detection report-individual throttle <0 - 500>
◦ Configures a throttle limit on the number of anomaly event APs can send to Cisco DNA Center every 5 minutes.
◦ Note: 0 signifies no throttling.
● config icap global subscription client anomaly-detection report-summary enable
◦ Enables APs to send a summary report containing all client anomalies detected over the past time frequency configured.
● config icap global subscription client anomaly-detection report-summary disable
◦ Disables APs from sending a summary report that contains all client anomalies detected over the past time frequency configured.
● config icap global subscription client anomaly-detection report-summary frequency <3 – 60 mins>
◦ Configures a summary report frequency.
● config icap global subscription client anomaly-detection timeout dhcp <1 – 120 seconds>
◦ Configures the amount of time (in seconds) that a DHCP server doesn’t reply to a client’s DHCP request before considering it to be an anomaly.
● Note: If you would like to enable the feature on a AP group, replace global with ap <AP Name> or group <AP Group Name>, respectively.
Full Packet Capture-related configuration:
● config icap global subscription client packet-trace full enable
◦ Enables Full Packet Capture on the AP (equivalent to Data Packet Capture on Cisco DNA Center).
● config icap global subscription client packet-trace full disable
◦ Enables Full Packet Capture on the AP.
● config icap global subscription client packet-trace full filter
◦ Configures a client to capture data packets on.
● Note: If you would like to enable the feature on a AP group, replace global with ap <AP Name> or group <AP Group Name>, respectively.
Partial Packet Capture-related configuration:
● config icap global subscription client packet-trace partial enable
◦ Enables Partial Packet Capture on the AP (equivalent to one of the three features enabled when Live Capture is enabled on Cisco DNA Center).
● config icap global subscription client packet-trace partial disable
◦ Enables Partial Packet Capture on the AP.
● config icap global subscription client packet-trace partial filter <Client MAC>
◦ Configures a client to capture onboarding packets on.
● config icap global subscription client packet-trace partial protocol {add | remove} all
◦ Adds or removes all categories of onboarding packet filters for APs to send to Cisco DNA Center.
● config icap global subscription client packet-trace partial protocol {add | remove} cisco {all | ndp}
◦ Adds or removes Cisco specific onboarding packet filters for APs to send to Cisco DNA Center.
● config icap global subscription client packet-trace partial protocol {add | remove} data {all | arp | dhcp | dhcpv6 | dns | eap | icmp | icmpv6}
◦ Adds or removes data-specific onboarding packet filters for APs to send to Cisco DNA Center.
● config icap global subscription client packet-trace partial protocol {add | remove} management {all | assoc | auth}
◦ Adds or removes management-specific onboarding packet filters for APs to send to Cisco DNA Center.
● Note: If you would like to enable the feature on an AP group, replace global with ap <AP Name> or group <AP Group Name>, respectively.
Client statistics-related configurations:
● config icap global subscription client enable
◦ Enables regular client statistics (equivalent to one of the three features enabled when enabling AP Stats Capture on Cisco DNA Center).
● config icap global subscription client disable
◦ Disables regular client statistics.
● config icap global subscription client frequency <30-3600 seconds>
◦ Configures the frequency with which APs will send Client RF Statistics data to Cisco DNA Center.
● Note: If you would like to enable the feature on a AP group, replace global with ap <AP Name> or group <AP Group Name>, respectively.
Client Filtered Statistics-related configuration:
● config icap global subscription client statistics filter enable
◦ Enables Client Filtered Statistics (equivalent to one of the three features enabled when enabling Live Capture on Cisco DNA Center).
● config icap global subscription client statistics filter enable
◦ Disables Client Filtered Statistics.
● config icap global subscription client statistics filter add <client MAC>
◦ Configures a client MAC address for the AP to send client statistics for.
● config icap global subscription client statistics filter remove
◦ Removes a configured client statistics client MAC.
● config icap global subscription client statistics filter frequency <5-3600 seconds>
◦ Configures the frequency with which APs will send Client RF Statistics data to Cisco DNA Center.
● Notes:
◦ The difference between client statistics and Client Filtered Statistics is that Client Filtered Statistics allow statistics data to be sent at 5-second intervals, as opposed to 30-second intervals.
◦ If you would like to enable the feature on an AP group, replace global with ap <AP Name> or group <AP Group Name>, respectively.
Cisco IOS XE WLC show commands
Configure the Intelligent Capture gRPC port that an AP will be using to externalize data:
● config icap server port <gRPC Port>
Configure the Intelligent Capture IP that the WLC and APs will be externalizing data to:
● network-assurance url <Cisco DNA Center IP>
View the Cisco DNA Center IP and statuses of the connections that are configured on the WLC:
● show network-assurance summary
View all Intelligent Capture features enabled within all AP profiles:
● show run | sec icap
View the serviceability statuses of joined APs that depict whether or not the APs have a properly established connection with Cisco DNA Center:
● Show ap icap serviceability {detail | summary}
Cisco IOS XE WLC configuration commands
Configure Intelligent Capture features for specific AP profiles:
● Note: For all configuration commands, first run the following two commands.
Configure terminal
Ap profile <AP Profile Name>
Enable Spectrum Analysis:
● icap subscription ap rf spectrum
Enable AP RF Statistics:
● icap subscription ap statistics {dns | interfaces | memory | radio | routing | system | wlan}
◦ Only WLAN and radio statistics data are consumed on Cisco DNA Center.
Anomaly Detection-related configurations:
● icap subscription client anomaly-detection enable
◦ Enables APs to begin detecting client anomalies.
● icap subscription client anomaly-detection filter <Client MAC>
◦ Configures a client MAC address for Anomaly Detection.
◦ This configuration isn’t enabled when the feature is enabled from Cisco DNA Center.
● icap subscription client anomaly-detection packet-trace trigger ap
◦ Enables APs to send anomaly packets to Cisco DNA Center.
● icap subscription client anomaly-detection report-individual enable
◦ Enables APs to send anomaly events to Cisco DNA Center.
● icap subscription client anomaly-detection report-individual throttle <0-100>
◦ Configures a throttle limit on the number of anomaly event APs can send to Cisco DNA Center every 5 minutes.
● icap subscription client anomaly-detection report-summary enable
◦ Enables APs to send a summary report that contains all client anomalies detected over the past time frequency configured.
● icap subscription client anomaly-detection report-summary frequency <3-60>
◦ Configures a summary report frequency.
● icap subscription client anomaly-detection timeout dhcp <1-120>
◦ Configures the amount of time (in seconds) that a DHCP server doesn’t reply to a client’s DHCP request before considering it to be an anomaly.
Full Packet Capture-related configuration:
● icap subscription client packet-trace full enable
◦ Enables Full Packet Capture on the AP (equivalent to Data Packet Capture on Cisco DNA Center).
● icap subscription client packet-trace full filter <client-mac>
◦ Configures a client to capture data packets on.
Partial Packet Capture-related configuration:
● icap subscription client packet-trace partial enable
◦ Enables Partial Packet Capture on the AP (equivalent to one of the three features enabled when Live Capture is enabled on Cisco DNA Center).
● icap subscription client packet-trace partial filter client <client-mac>
◦ Configures a client to capture onboarding packets on.
● icap subscription client packet-trace partial filter protocol all
◦ Adds all categories of onboarding packet filters for APs to send to Cisco DNA Center.
● icap subscription client packet-trace partial filter protocol type cisco subtype {all | ndp}
◦ Adds Cisco specific onboarding packet filters for APs to send to Cisco DNA Center.
● icap subscription client packet-trace partial filter protocol type data subtype {all | arp | dhcpv4 | dhcpv6 | dns | eap | icmpv4 | icmpv6}
◦ Adds data-specific onboarding packet filters for APs to send to Cisco DNA Center.
● icap subscription client packet-trace partial filter protocol type management subtype {all | assoc | auth | probe}
◦ Adds management-specific onboarding packet filters for APs to send to Cisco DNA Center.
Client statistics-related configuration:
● icap subscription client statistics enable
◦ Enables regular client statistics (equivalent to one of the three features enabled when enabling AP Stats Capture on Cisco DNA Center).
● icap subscription client statistics frequency <30-3600>
◦ Configures the frequency with which APs will send Client RF Statistics data to Cisco DNA Center.
Client Filtered Statistics-related configuration:
● icap subscription client statistics filter enable
◦ Enables Client Filtered Statistics (equivalent to one of the three features enabled when enabling Live Capture on Cisco DNA Center).
● icap subscription client statistics filter <client-mac>
◦ Configures a client MAC address for the AP to send client statistics for.
● icap subscription client statistics filter frequency <5-3600>
◦ Configures the frequency with which APs will send Client RF Statistics data to Cisco DNA Center.
● Note: The difference between client statistics and Client Filtered Statistics is that Client Filtered Statistics allows statistics data to be sent at 5-second intervals, as opposed to 30-second intervals.
● Show ap icap anomaly-detection
◦ Displays all Anomaly Detection configurations pushed from WLC to AP, as well as any anomalies detected.
● show ap icap anomaly-detection {connected | onboarding}
◦ Connected: Anomaly event details for clients already onboarded.
◦ Onboarding: Anomaly event details for clients that are currently onboarding.
● show ap icap client
◦ Displays a joined client’s past onboarding events.
● show ap icap config {anomaly-detection | connection | packettrace-full | packettrace-partial | rf-spectrum | statistic}
◦ Displays the configuration history of these Intelligent Capture commands.
● show ap icap connection
◦ Displays the connection status between the AP and Cisco DNA Center.
● show ap icap counters
◦ Displays the number of full, partial, and anomaly packets located within each queue within the firmware.
● show ap icap packets
◦ Displays the number of packets, events, and messages sent or dropped for each Intelligent Capture feature.
● show ap icap subscription
◦ Displays the Intelligent Capture configurations currently enabled on the AP.
● show ap icap telemetry
◦ Displays the frequency configured for each Intelligent Capture feature on the AP.
Cisco DNA Assurance User Guide, Release 2.2.2
Cisco DNA Center information
● https://www.cisco.com/site/us/en/products/networking/catalyst-center/index.html?dtid=osscdc000283
Cisco Prime Virtual Network Analysis Module (vNAM) Installation and Configuration Guide
Cisco Prime Virtual Network Analysis Module (vNAM) information
Cisco Prime Virtual Network Analysis Module 6.4.2 (vNAM) OVA
● https://software.cisco.com/download/home/286322801/type/282700108/release/6.4.2
Cisco CMX Configuration Guide, Release 10.6.0 and Later