|
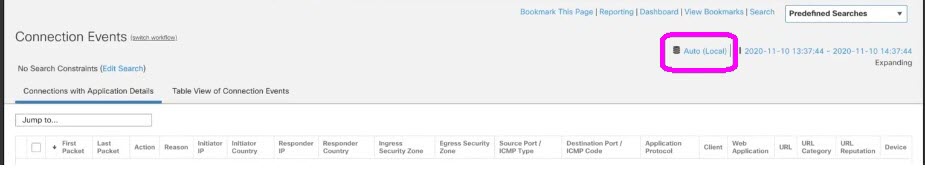
Connection Events
|
This workflow provides a summary view of basic connection and detected application information, which you can then use to
drill down to the table view of events.
|
|
Connections by Application
|
This workflow contains a graph of the 10 most active applications on the monitored network segment, based on the number of
detected connections.
|
|
Connections by Initiator
|
This workflow contains a graph of the 10 most active host IP addresses on the monitored network segment, based on the number
of connections where the host initiated the connection transaction.
|
|
Connections by Port
|
This workflow contains a graph of the 10 most active ports on the monitored network segment, based on the number of detected
connections.
|
|
Connections by Responder
|
This workflow contains a graph of the 10 most active host IP addresses on the monitored network segment, based on the number
of connections where the host IP was the responder in the connection transaction.
|
|
Connections over Time
|
This workflow contains a graph of the total number of connections on the monitored network segment over time.
|
|
Traffic by Application
|
This workflow contains a graph of the 10 most active applications on the monitored network segment, based on the number of
kilobytes transmitted.
Application counts reflect each detector that matched against an application connection. The same application session may
be represented more than once in the list depending on whether an application protocol, web application, client detector,
or internal detector matched the traffic, as well as whether the traffic originated from a mobile device or was part of an
encrypted session. If the application was seen in a client flow and no specific client detector exists, a generic client may
be reported.
For example, you may see the same session of YouTube traffic reported as YouTube (because it matched a YouTube web application detector) and as YouTube client (because an internal YouTube detector matched against characteristics typically seen in a client session).
Use the information in the connection events and network map for your network to determine more context for specific application
connections.
|
|
Traffic by Initiator
|
This workflow contains a graph of the 10 most active host IP addresses on the monitored network segment, based on the total
number of kilobytes transmitted from each address.
|
|
Traffic by Port
|
This workflow contains a graph of the 10 most active ports on the monitored network segment, based on the number of kilobytes
transmitted.
|
|
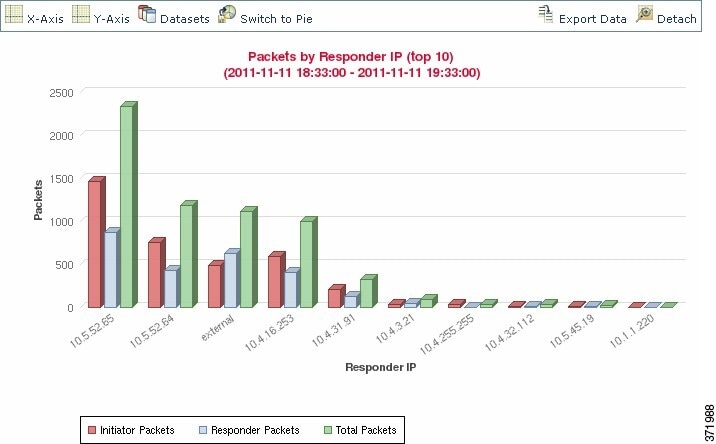
Traffic by Responder
|
This workflow contains a graph of the 10 most active host IP addresses on the monitored network segment, based on the total
number of kilobytes received by each address.
|
|
Traffic over Time
|
This workflow contains a graph of the total kilobytes transmitted on the monitored network segment over time.
|
|
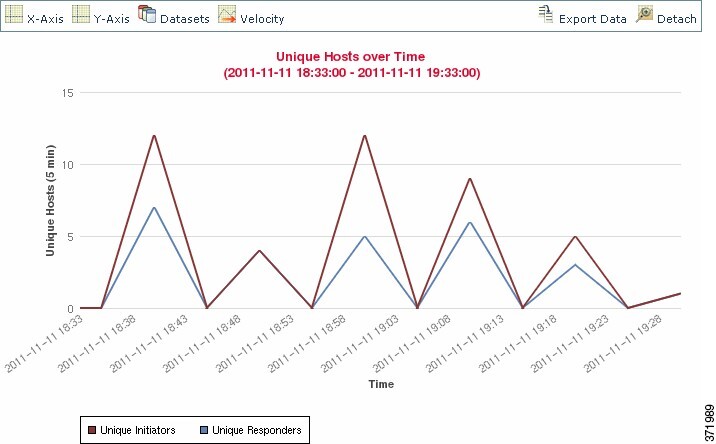
Unique Initiators by Responder
|
This workflow contains a graph of the 10 most active responding host IP addresses on the monitored network segment, based
on the number of unique initiators that contacted each address.
|
|
Unique Responders by Initiator
|
This workflow contains a graph of the 10 most active initiating host IP addresses on the monitored network segment, based
on the number of unique responders that the addresses contacted.
|
 )
)


 )
)


 Feedback