About Clustering on the Firepower 4100/9300 Chassis
When you deploy a cluster on the Firepower 4100/9300 chassis, it does the following:
-
For native instance clustering: Creates a cluster-control link (by default, port-channel 48) for node-to-node communication.
For multi-instance clustering: You should pre-configure subinterfaces on one or more cluster-type EtherChannels; each instance needs its own cluster control link.
For a cluster isolated to security modules within one Firepower 9300 chassis, this link utilizes the Firepower 9300 backplane for cluster communications.
For clustering with multiple chassis, you need to manually assign physical interface(s) to this EtherChannel for communications between chassis.
-
Creates the cluster bootstrap configuration within the application.
When you deploy the cluster, the chassis supervisor pushes a minimal bootstrap configuration to each unit that includes the cluster name, cluster control link interface, and other cluster settings.
-
Assigns data interfaces to the cluster as Spanned interfaces.
For a cluster isolated to security modules within one Firepower 9300 chassis, spanned interfaces are not limited to EtherChannels, like it is for clustering with multiple chassis. The Firepower 9300 supervisor uses EtherChannel technology internally to load-balance traffic to multiple modules on a shared interface, so any data interface type works for Spanned mode. For clustering with multiple chassis, you must use Spanned EtherChannels for all data interfaces.

Note
Individual interfaces are not supported, with the exception of a management interface.
-
Assigns a management interface to all units in the cluster.
See the following sections for more information about clustering.
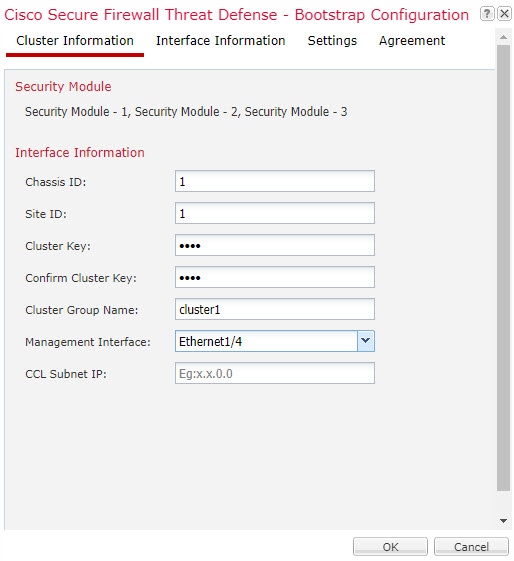
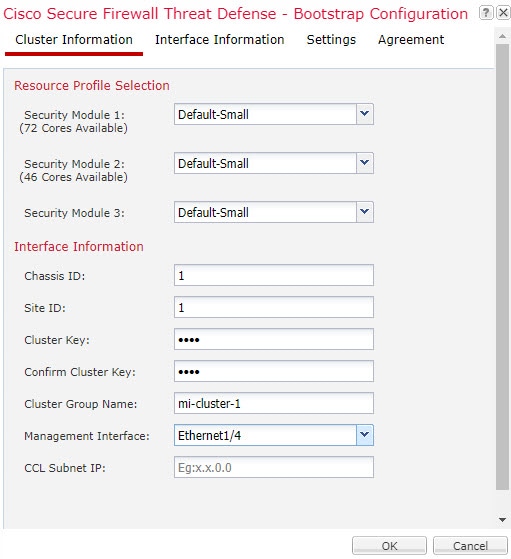
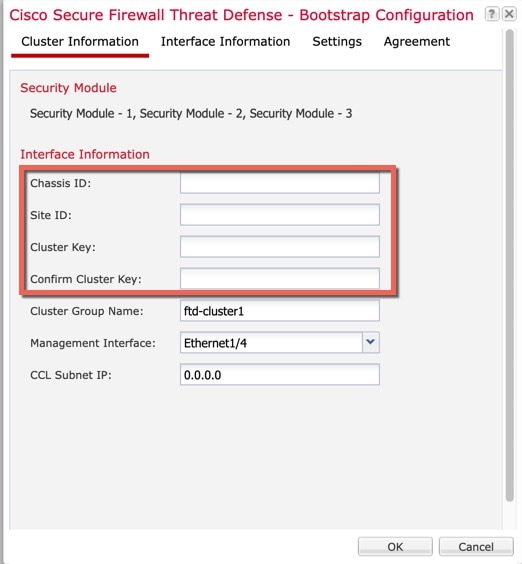
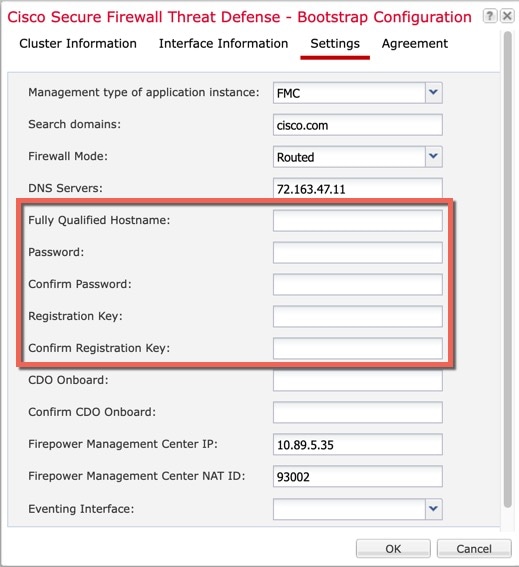
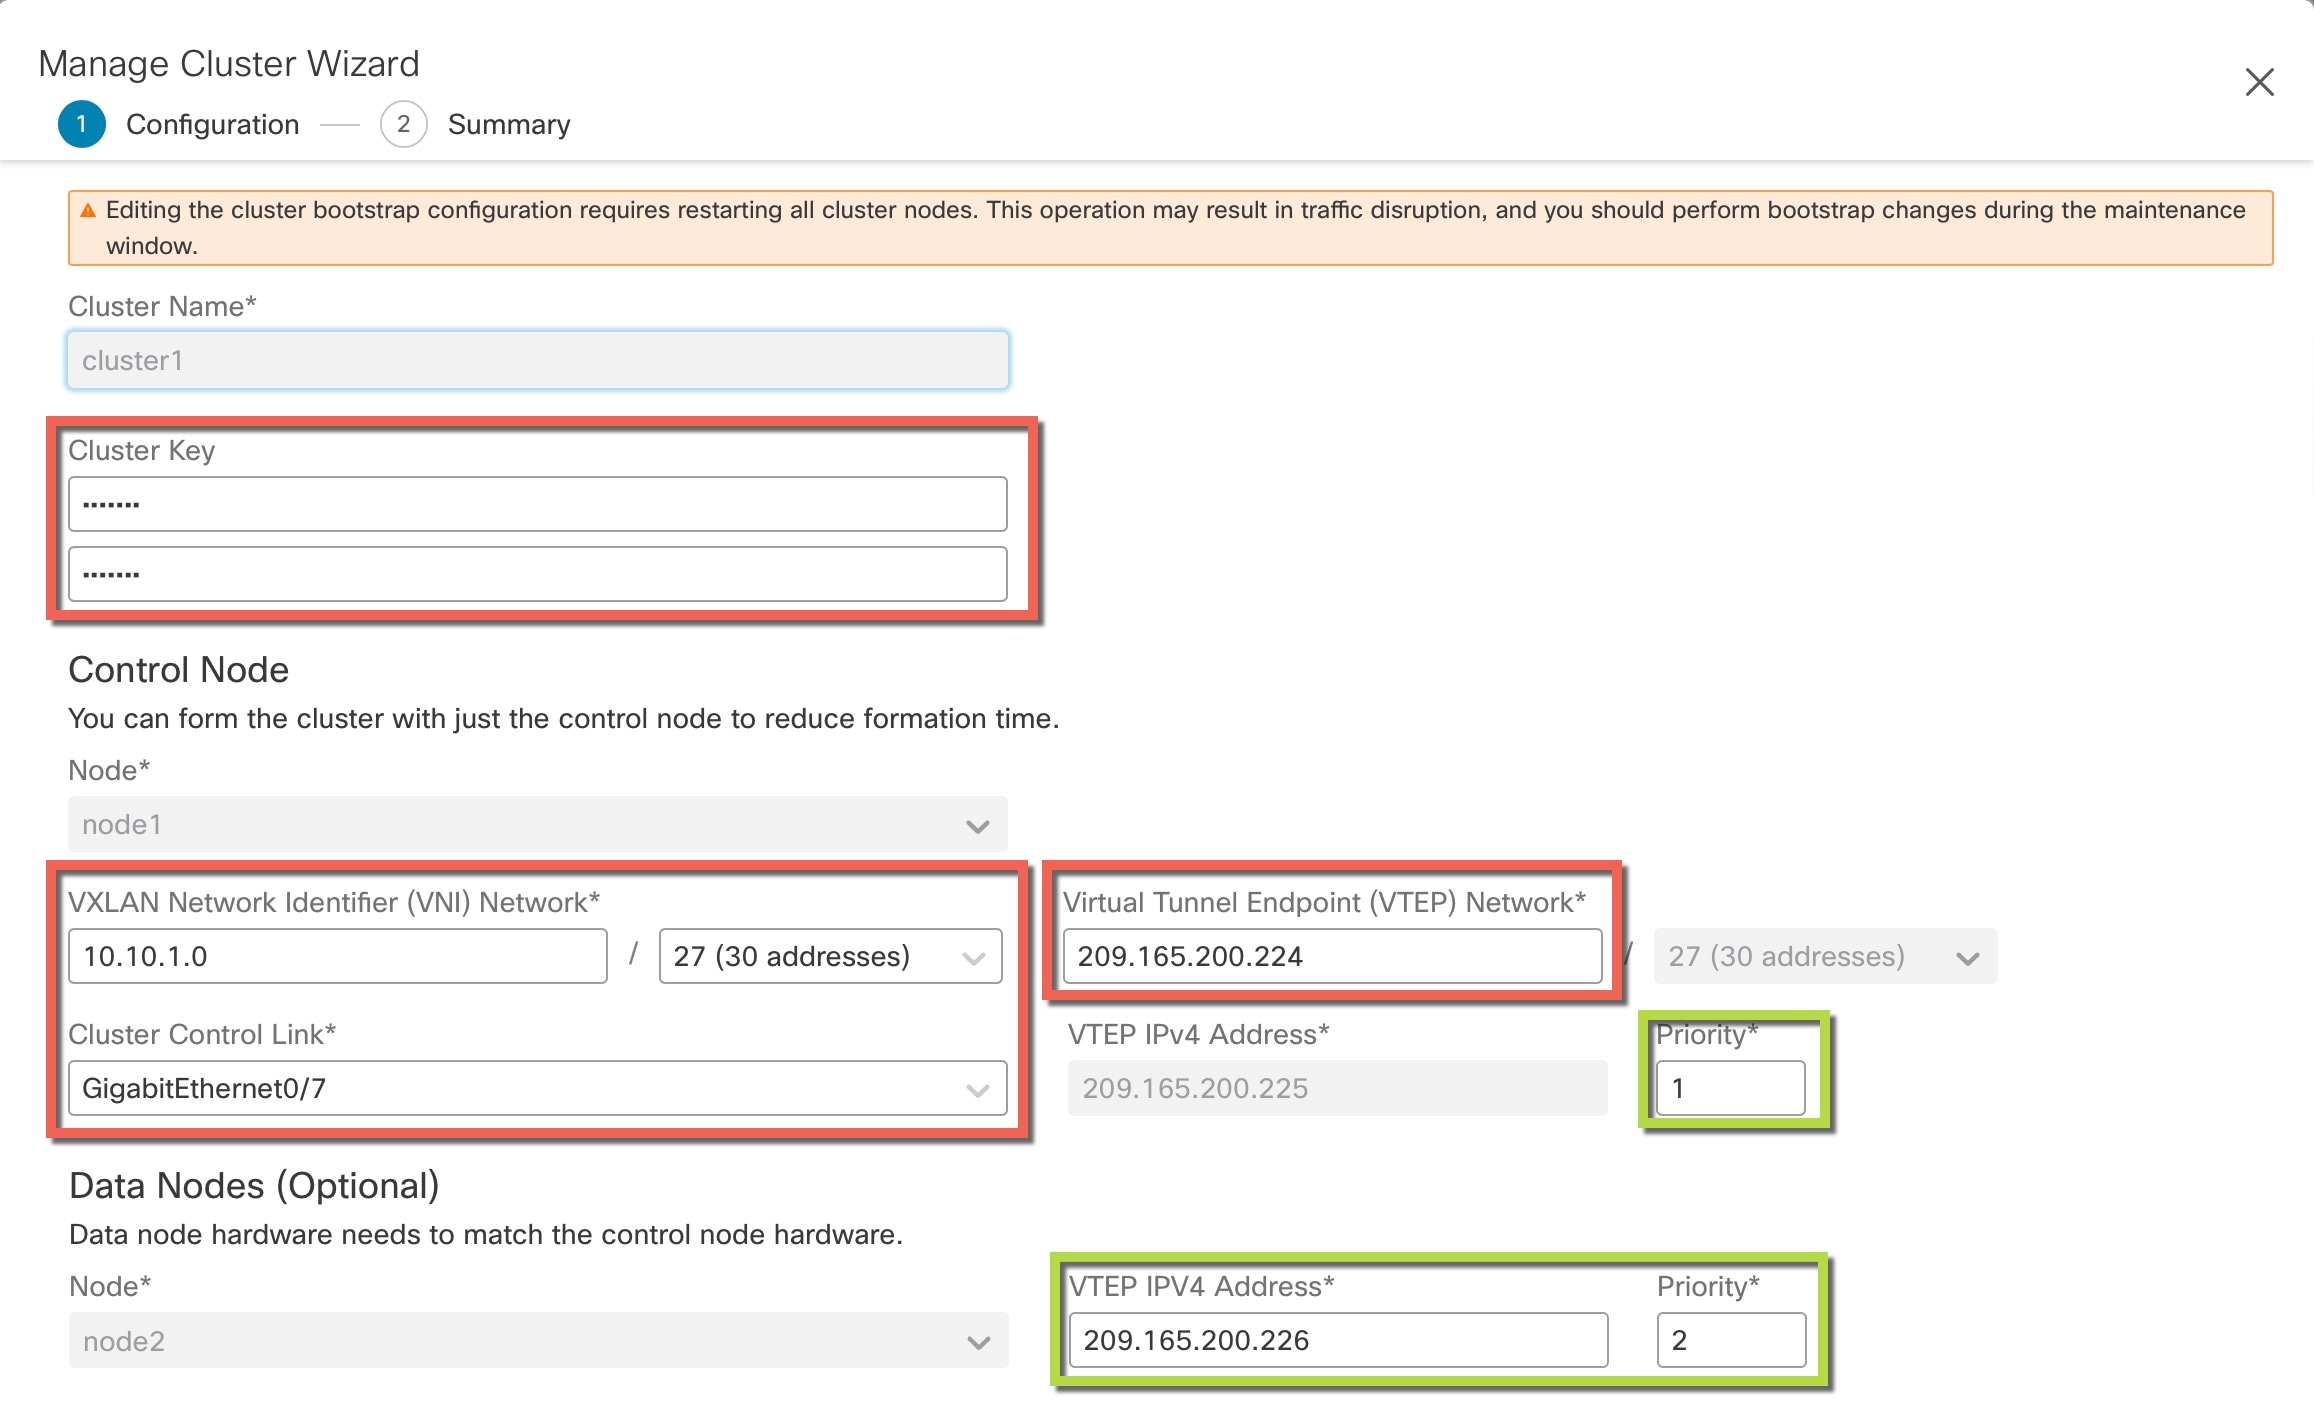
Bootstrap Configuration
When you deploy the cluster, the Firepower 4100/9300 chassis supervisor pushes a minimal bootstrap configuration to each unit that includes the cluster name, cluster control link interface, and other cluster settings.
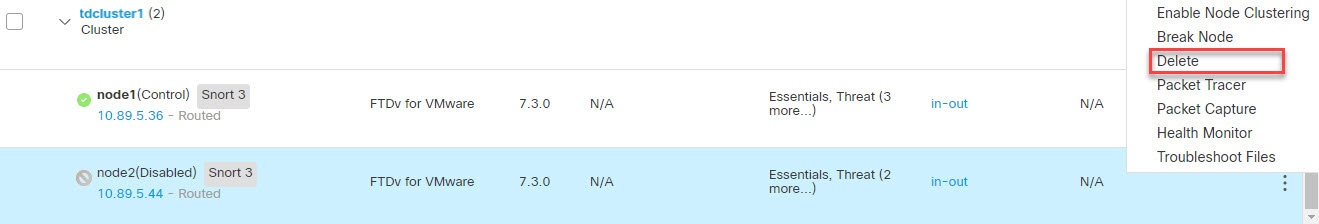
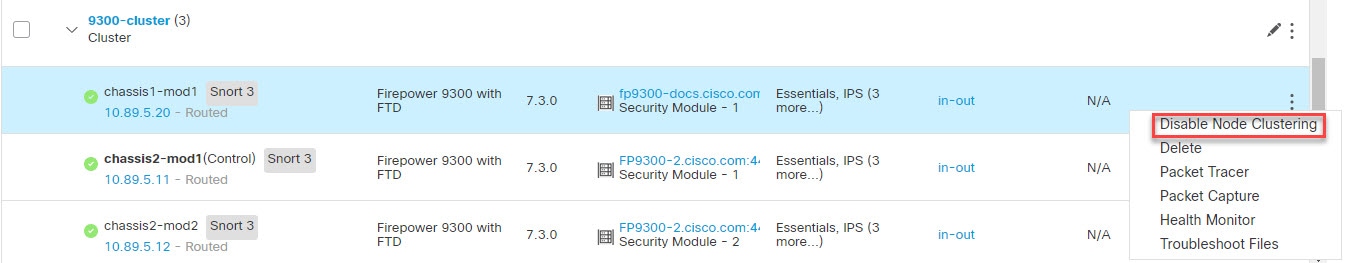
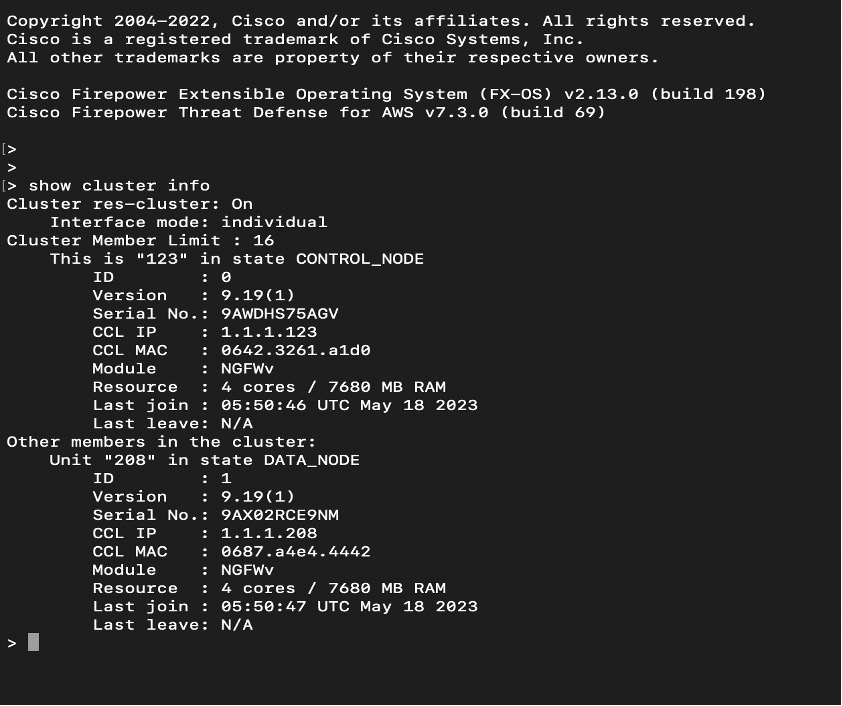
Cluster Members
Cluster members work together to accomplish the sharing of the security policy and traffic flows.
One member of the cluster is the control unit. The control unit is determined automatically. All other members are data units.
You must perform all configuration on the control unit only; the configuration is then replicated to the data units.
Some features do not scale in a cluster, and the control unit handles all traffic for those features. .
Cluster Control Link
For native instance clustering: The cluster control link is automatically created using the Port-channel 48 interface.
For multi-instance clustering: You should pre-configure subinterfaces on one or more cluster-type EtherChannels; each instance needs its own cluster control link.
For a cluster isolated to security modules within one Firepower 9300 chassis, this interface has no member interfaces. This Cluster type EtherChannel utilizes the Firepower 9300 backplane for cluster communications. For clustering with multiple chassis, you must add one or more interfaces to the EtherChannel.
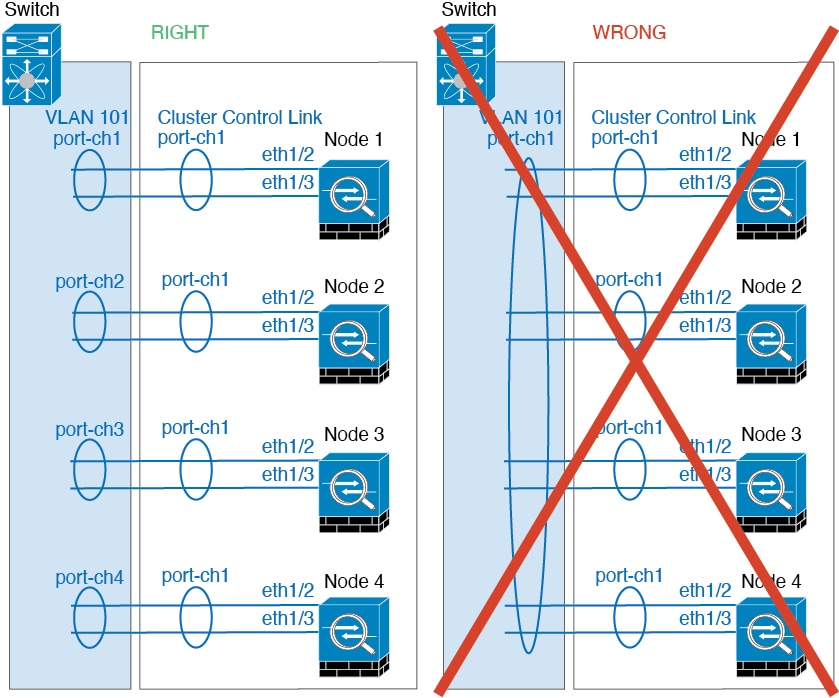
For a cluster with two chassis, do not directly connect the cluster control link from one chassis to the other chassis. If you directly connect the interfaces, then when one unit fails, the cluster control link fails, and thus the remaining healthy unit fails. If you connect the cluster control link through a switch, then the cluster control link remains up for the healthy unit.
Cluster control link traffic includes both control and data traffic.
Size the Cluster Control Link
If possible, you should size the cluster control link to match the expected throughput of each chassis so the cluster control link can handle the worst-case scenarios.
Cluster control link traffic is comprised mainly of state update and forwarded packets. The amount of traffic at any given time on the cluster control link varies. The amount of forwarded traffic depends on the load-balancing efficacy or whether there is a lot of traffic for centralized features. For example:
-
NAT results in poor load balancing of connections, and the need to rebalance all returning traffic to the correct units.
-
When membership changes, the cluster needs to rebalance a large number of connections, thus temporarily using a large amount of cluster control link bandwidth.
A higher-bandwidth cluster control link helps the cluster to converge faster when there are membership changes and prevents throughput bottlenecks.
Note |
If your cluster has large amounts of asymmetric (rebalanced) traffic, then you should increase the cluster control link size. |
Cluster Control Link Redundancy
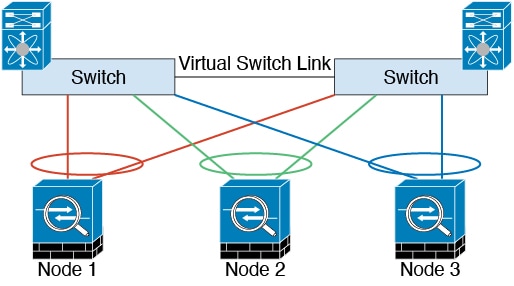
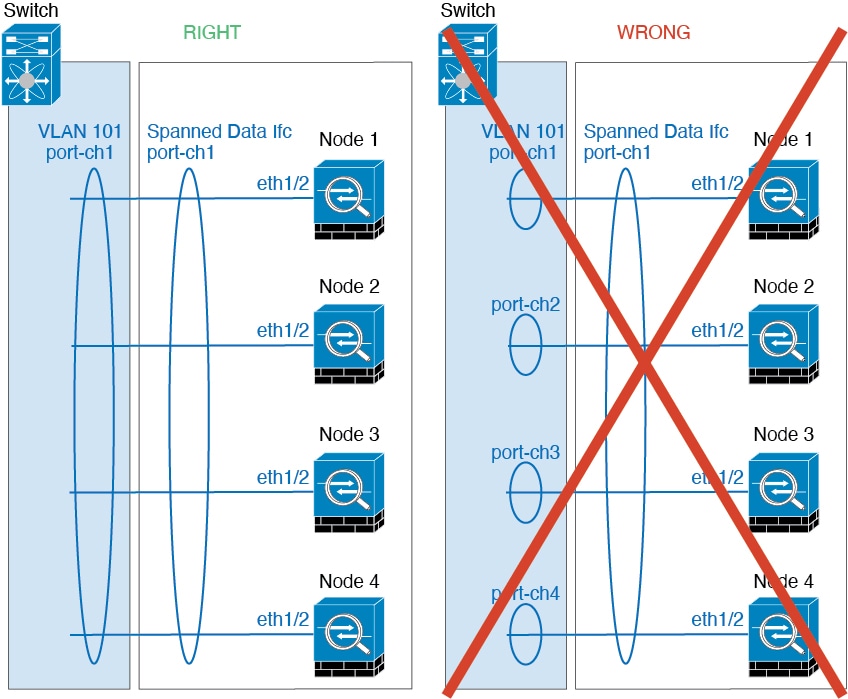
The following diagram shows how to use an EtherChannel as a cluster control link in a Virtual Switching System (VSS), Virtual Port Channel (vPC), StackWise, or StackWise Virtual environment. All links in the EtherChannel are active. When the switch is part of a redundant system, then you can connect firewall interfaces within the same EtherChannel to separate switches in the redundant system. The switch interfaces are members of the same EtherChannel port-channel interface, because the separate switches act like a single switch. Note that this EtherChannel is device-local, not a Spanned EtherChannel.
Cluster Control Link Reliability for Inter-Chassis Clustering
To ensure cluster control link functionality, be sure the round-trip time (RTT) between units is less than 20 ms. This maximum latency enhances compatibility with cluster members installed at different geographical sites. To check your latency, perform a ping on the cluster control link between units.
The cluster control link must be reliable, with no out-of-order or dropped packets; for example, for inter-site deployment, you should use a dedicated link.
Cluster Control Link Network
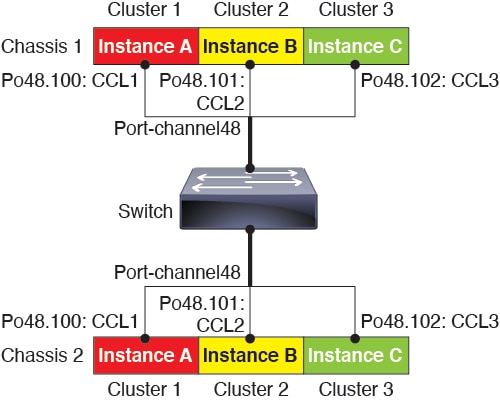
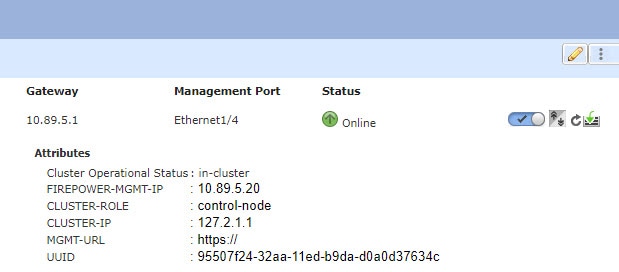
The Firepower 4100/9300 chassis auto-generates the cluster control link interface IP address for each unit based on the chassis ID and slot ID: 127.2.chassis_id.slot_id. For multi-instance clusters, which typically use different VLAN subinterfaces of the same EtherChannel, the same IP address can be used for different clusters because of VLAN separation. The cluster control link network cannot include any routers between units; only Layer 2 switching is allowed.
Management Network
We recommend connecting all units to a single management network. This network is separate from the cluster control link.
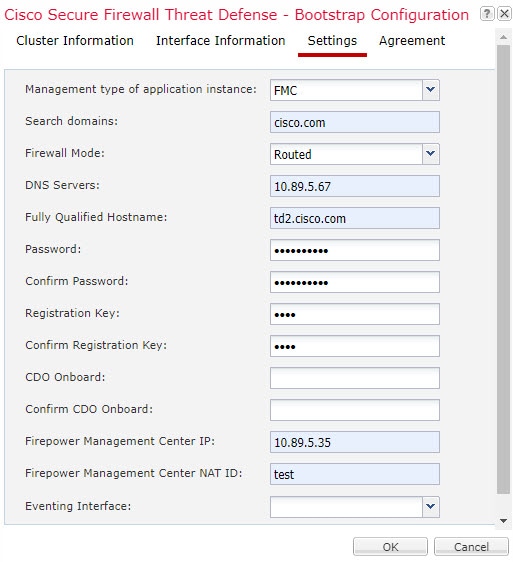
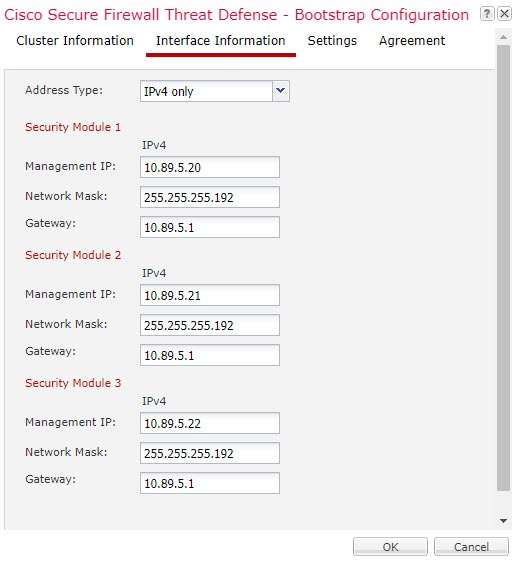
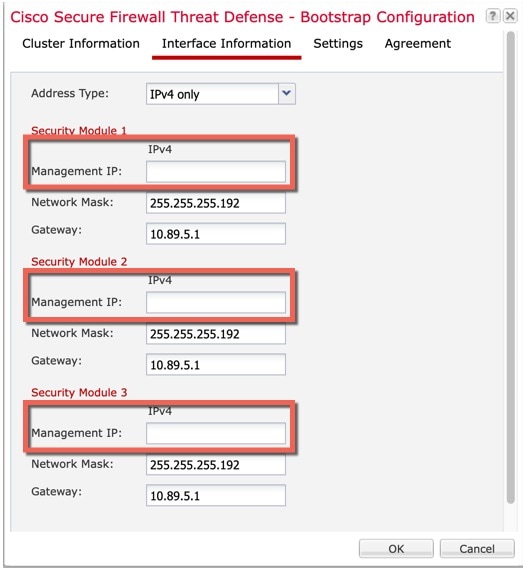
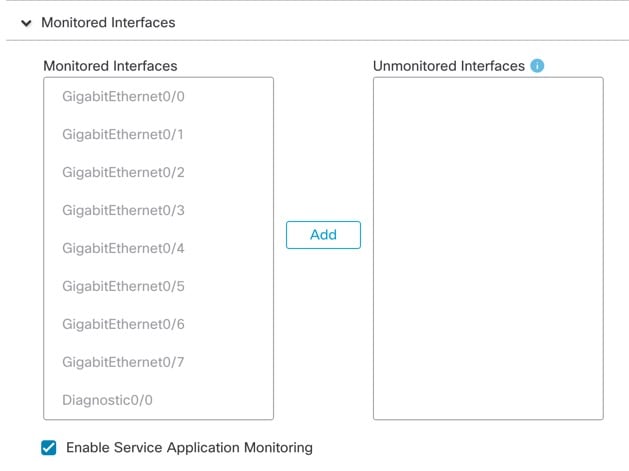
Management Interface
You must assign a Management type interface to the cluster. This interface is a special individual interface as opposed to a Spanned interface. The management interface lets you connect directly to each unit. This Management logical interface is separate from the other interfaces on the device. It is used to set up and register the device to the Secure Firewall Management Center. It uses its own local authentication, IP address, and static routing. Each cluster member uses a separate IP address on the management network that you set as part of the bootstrap configuration.
The management interface is shared between the Management logical interface and the Diagnostic logical interface. The Diagnostic logical interface is optional and is not configured as part of the bootstrap configuration. The Diagnostic interface can be configured along with the rest of the data interfaces. If you choose to configure the Diagnostic interface, configure a Main cluster IP address as a fixed address for the cluster that always belongs to the current control unit. You also configure a range of addresses so that each unit, including the current control unit, can use a Local address from the range. The Main cluster IP address provides consistent diagnostic access to an address; when a control unit changes, the Main cluster IP address moves to the new control unit, so access to the cluster continues seamlessly. For outbound management traffic such as TFTP or syslog, each unit, including the control unit, uses the Local IP address to connect to the server.
Cluster Interfaces
For a cluster isolated to security modules within one Firepower 9300 chassis, you can assign both physical interfaces or EtherChannels (also known as port channels) to the cluster. Interfaces assigned to the cluster are Spanned interfaces that load-balance traffic across all members of the cluster.
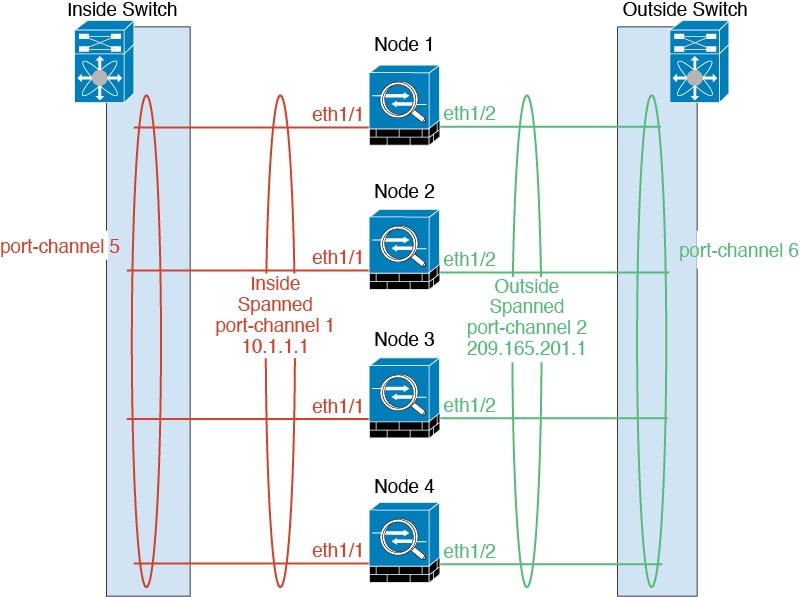
For clustering with multiple chassis, you can only assign data EtherChannels to the cluster. These Spanned EtherChannels include the same member interfaces on each chassis; on the upstream switch, all of these interfaces are included in a single EtherChannel, so the switch does not know that it is connected to multiple devices.
Individual interfaces are not supported, with the exception of a management interface.
Spanned EtherChannels
You can group one or more interfaces per chassis into an EtherChannel that spans all chassis in the cluster. The EtherChannel aggregates the traffic across all the available active interfaces in the channel. A Spanned EtherChannel can be configured in both routed and transparent firewall modes. In routed mode, the EtherChannel is configured as a routed interface with a single IP address. In transparent mode, the IP address is assigned to the BVI, not to the bridge group member interface. The EtherChannel inherently provides load balancing as part of basic operation.
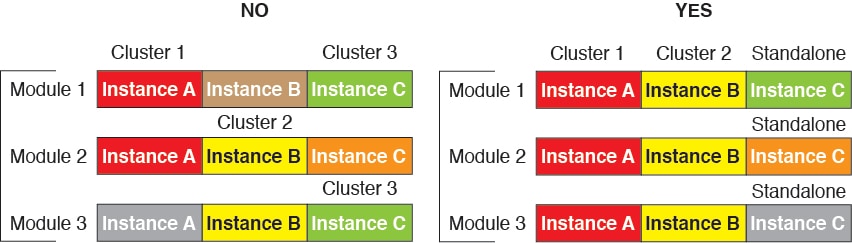
For multi-instance clusters, each cluster requires dedicated data EtherChannels; you cannot use shared interfaces or VLAN subinterfaces.
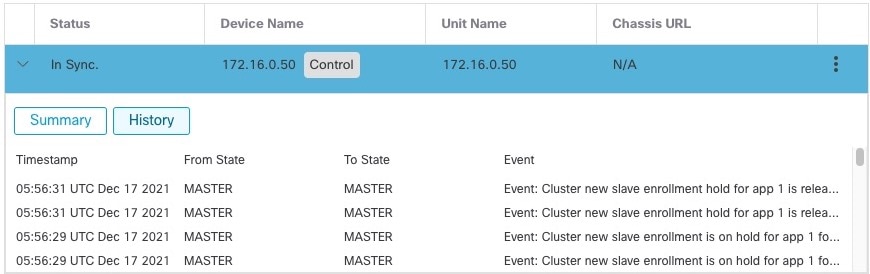
Configuration Replication
All nodes in the cluster share a single configuration. You can only make configuration changes on the control node (with the exception of the bootstrap configuration), and changes are automatically synced to all other nodes in the cluster.
 )
)
 )
)
 )
)
 )
) )
) )
) )
)
 )
)

 )
) )
)
 )
)

 Feedback