Network services use cases
Network services are the key drivers for Metro evolution. These are the applicable network infrastructure use cases of Agile Metro architecture for each service type:
-
Subscriber edge:
-
wireline subscriber termination, and
-
last mile access aggregation.
-
-
Converged transport:
-
4G and 5G mobile network IP transport , and
-
virtual CSR or virtual PE.
-
-
Enterprise business edge connectivity services:
-
middle mile infrastructure service
-
cloud interconnect and on-ramp
-
SD-WAN interconnect, and
-
Private Line Emulation (PLE).
-
-
SPDC centralized and edge DC interconnection
-
External interconnect:
-
public cloud interconnection, and
-
internet peering and content delivery.
-
Subscriber Edge
This section covers the details of delivering IP services to access network wireline subscribers including next-generation BNG using a CUPS architecture.
Wireline subscriber termination
Traditional BNG deployments provide physical BNG functionalities to subscribers in edge routers (primarily, Cisco ASR 9000 Series Routers). This model has limitations in scaling out as the subscriber scale increases. The separation of BNG control plane (CP) and user plane (UP) allows us to create a scalable and resilient subscriber management platform. The breakout to cloud point-of-presence (PoP), edge service, and so on happens after the subscriber termination. Services like CGNAT is supported as in-line service or as service-on-a-stick model using Cisco Virtualized Services Module (VSM) cards.
Last mile access aggregation
Last mile access aggregation refers to the edge leaf device acting as an aggregation for access technologies using their own devices connected upstream through Ethernet. In most cases these devices are PON OLTs or CIN Remote PHY or Remote MACPHY nodes but extend to other access technologies such as Wi-Fi and Active Ethernet.
The image shows the aggregation of these nodes at the edge of the network.
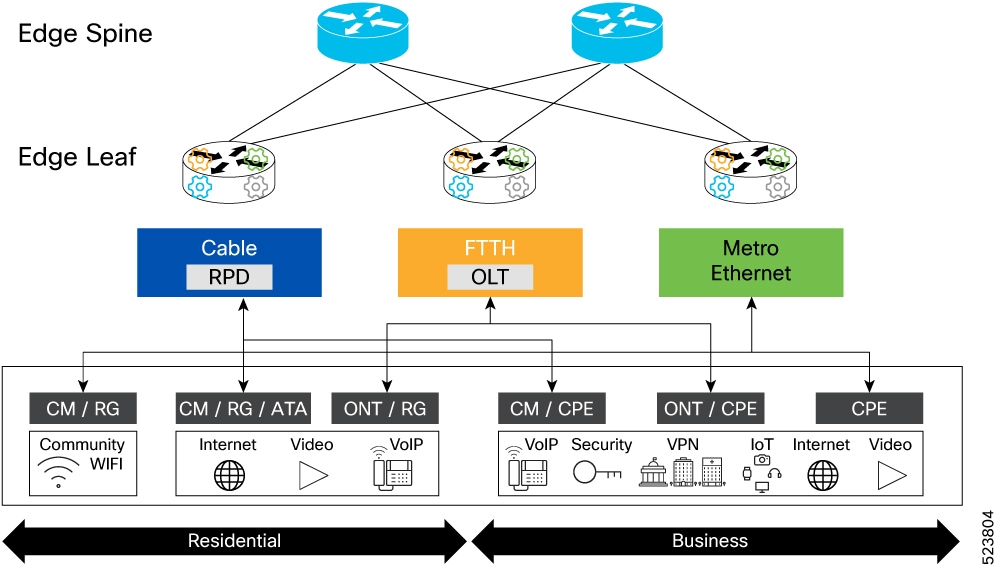
This type of aggregation also applies to virtual network functions in the network which do not reside within a dedicated data center environment. For example, a virtualized cable modem termination system (vCMTS), which is a virtual element terminating cable subscribers typically deployed as part of the SP network and not in a separate DC environment.
Converged transport
The Agile Metro architecture supports these use cases on converged transport.
4G and 5G mobile network IP transport
Historically we have played the role of backhaul IP transport provider. The dis-aggregation of radio access network (RAN) opens opportunity in new stringent transport networks like midhaul and fronthaul. In future, the resource demanding applications will drive the need for guaranteed services in transport network through network slicing and service assurance.
The current Metro solution relies on the existing cell site routers (CSRs) and pre-aggregation routers to provide access transport services. These devices are added as leaf nodes in Metro Fabric to provide last mile cell site connectivity. Overlay services such as SR-EVPN in metro fabric carries the services originated from cell site to packet core, distributed unit (DU), centralized unit (CU), or security gateway (SecGW) depending on the network configuration.
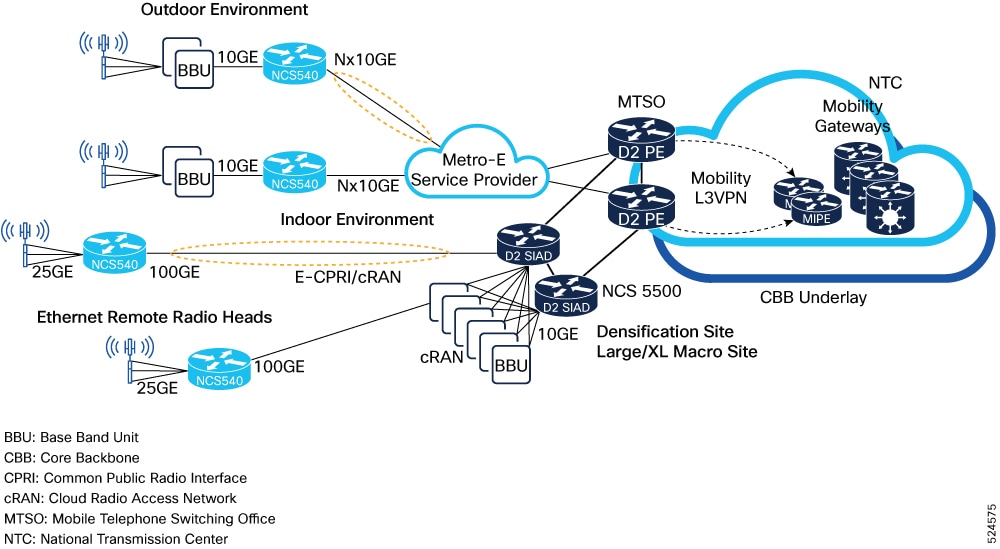
Cisco Agile Metro Release 1.0 focuses on Cisco NCS 540 series routers as the CSRs and Cisco NCS 5500 series routers, and Cisco NCS 5700 series routers as the pre-aggregation routers.
Enterprise business edge connectivity services
Enterprise services cover the use of traditional network service types to deliver end-to-end connectivity or overlay services to enterprise endpoints. These services are not specific to communications service providers (CSPs). Many enterprise and government networks are built to support internal connectivity in much the same way as a service provider network. This section is agnostic to the last mile access network being used; it could be wireline (such as fiber, copper, and so on) to the premise, within a data center facility, or using mobile, or satellite technology.
|
MEF service type |
Carrier network service |
|---|---|
|
E-LINE |
L2VPN EVPN-VPWS |
|
E-LAN |
L2VPN EVPN ELAN |
|
E-TREE |
L2VPN EVPN ETREE |
|
E-TRANSIT (NNI-to-NNI interconnect) |
L2VPN EVPN-VPWS, ELAN, or ETREE |
|
E-ACCESS (NNI-to-UNI interconnect) |
L2VPN EVPN-VPWS, ELAN, or ETREE |
|
L3VPN |
VPNv4, or VPNv6 L3VPN |
|
Internet Access Service (Direct Internet Access) |
DIA (GRT or internet in a VRF) |
Middle mile infrastructure service
The Network-to-Network Interface (NNI) use cases listed above apply to several use cases. Middle mile connectivity services that help to interconnect customer endpoints using P2P service over their converged packet network fall under the category of E-TRANSIT. An example is North America alternative access vendor (AAV), which is the common name for a service provider interconnecting a cell site location to a mobile core location when the mobile carrier does not have their own infrastructure to do so.
Cloud interconnect and onramp
The use case of a CSP connecting their customers to a cloud interconnect provider is another type of enterprise connectivity use case. In this case, the CSP may be the last-mile provider for the enterprise and have connectivity to worldwide interconnect providers who are responsible for interconnecting the customer to a specific cloud provider or data center using their network. This use case falls under the E-ACCESS use case since one UNI leg of the connection is considered on-net for the service provider.
Private Line Emulation
Private Line Emulation (PLE) is a technology to support bit-transparent Ethernet, OTN, SONET or SDH, and Fiber Channel services across an IP packet transport network. At present, the PLE L2VPN circuits are carried over an IP or MPLS network.
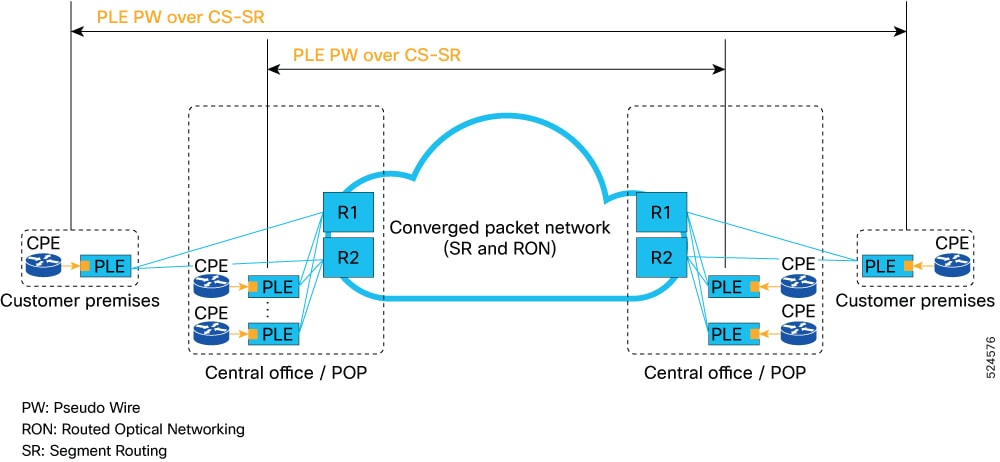
The solution primarily relies on PLE gateways placed at customer premises to transform private line bit stream to SR-MPLS payload. Cisco Cross Network Controller (CNC) sets up end-to-end guaranteed traffic engineering tunnel (SR-CS) to remote PLE gateway to carry the PLE traffic.
SD-WAN
The Agile Metro architecture supports these SD-WAN use cases:
-
SD-WAN interconnect
-
SD-WAN assurance using Cisco PCA
-
SD-WAN and SR-policy integration
SD-WAN interconnect
SD-WAN VPN services have become the primary way by which enterprises create private networks. These services are primarily carried over DIA from service providers. There are hybrid deployments where enterprises may have connectivity over a traditional service provider L3VPN and SD-WAN. In these cases, the service provider must provide interconnection between the provider L3VPN infrastructure and the SD-WAN infrastructure. SD-WAN interconnect covers this use case. Primarily this is done through an L2 or simple L3 hand off since the provider L3VPN and SD-WAN control plane are not interoperable.
SD-WAN assurance using Cisco Provider Connectivity Assurance
The goals of this use case include
-
exposing underlay KPIs that provide business value to overlay operator
-
exposing overlay KPIs that provide business value to underlay operator
-
designing and conducting proof of concept (PoC) in lab set-up, and
-
minimizing overlay and underlay dependencies.
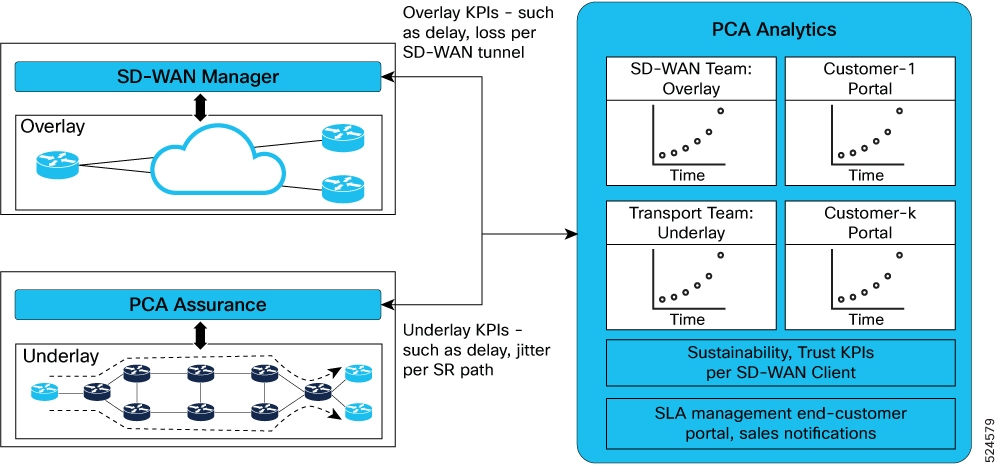
SD-WAN service assurance covers these functionalities:
-
Collect overlay KPI data from Cisco Catalyst SD-WAN solution to monitor the overlay quality
-
Collect KPI data from CNC for topology data and additional infrastructure-level monitoring data
-
Correlate underlay and overlay data providing a complete end-to-end assurance view
In Metro Release 1.0, SD-WAN assurance using PCA is in PoC status.
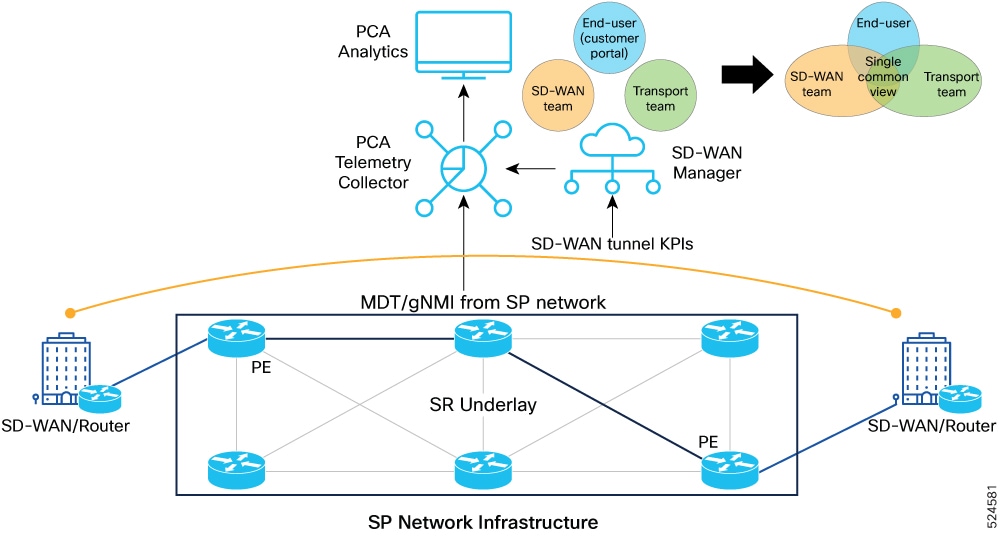
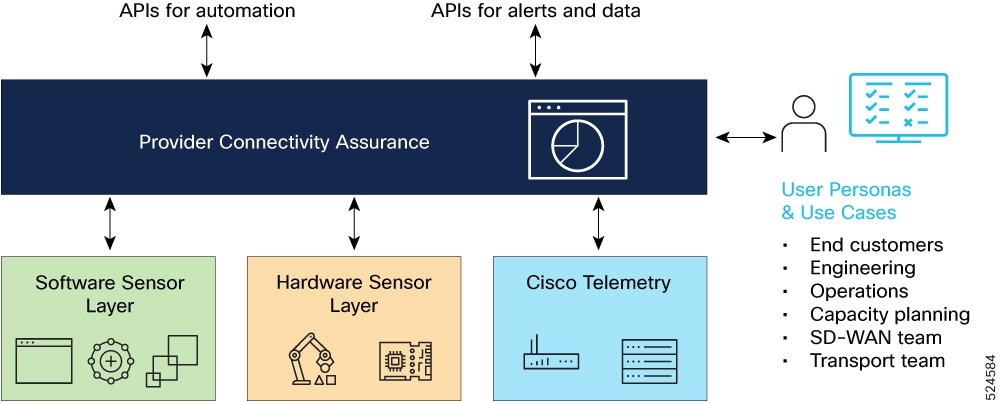
The figure shows the basic visibility and insights leveraging PCA telemetry collector and SD-WAN manager.
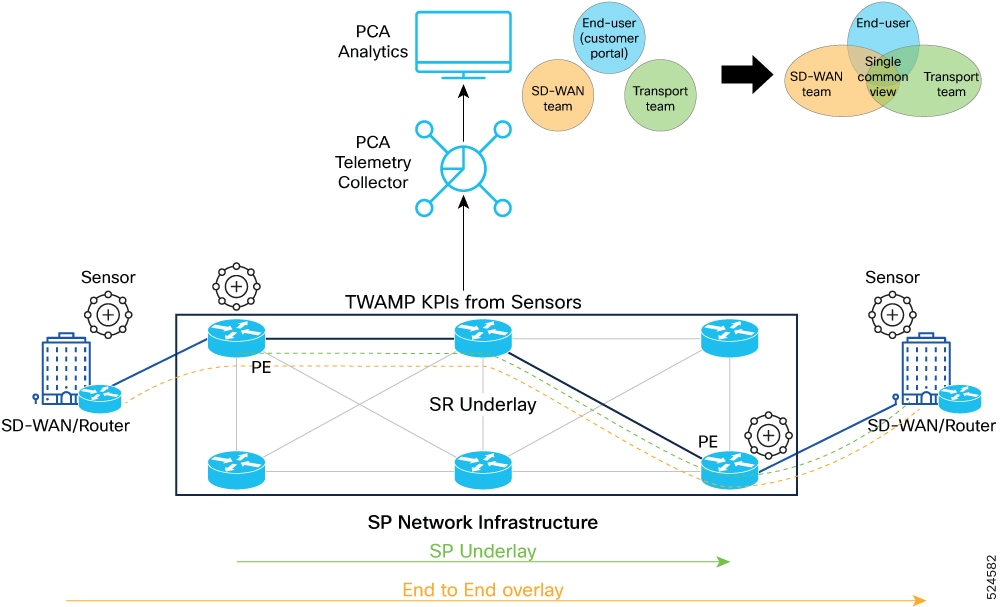
The figure shows the advanced visibility and insights leveraging PCA sensors.
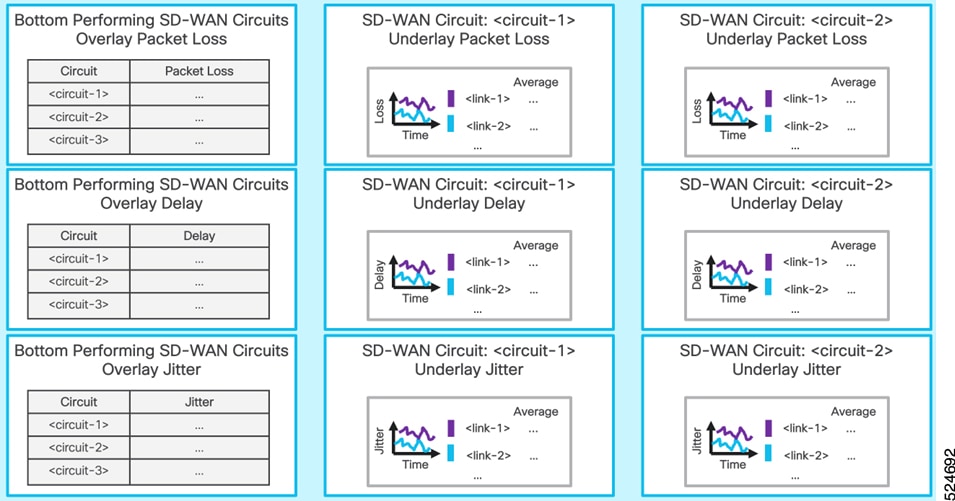
The figure shows a sample dashboard highlighting both SD-WAN and underlay performance data in a single unified dashboard.
Benefits of SD-WAN visualization and assurance
The benefits of SD-WAN visualization and assurance include several values for transport operator, SD-WAN operator, and SD-WAN customer:
-
Transport operator:
-
Per-slice monitoring and accounting
-
Per-tenant, per-circuit monitoring and accounting
-
Improved reactive and proactive Mean Time to Identify (MTTI) and Mean Time Between Failures
-
Pro-active capacity planning
-
-
SD-WAN operator:
-
Per-SLA intent monitoring and assurance
-
Improved reactive and proactive MTTI and MTBF
-
Guaranteed SLA intent on overlay and underlay
-
-
SD-WAN customer:
-
Guaranteed SLA intent on overlay and underlay
-
Greater visibility (for example, trust, sustainability, and SLA reporting)
-
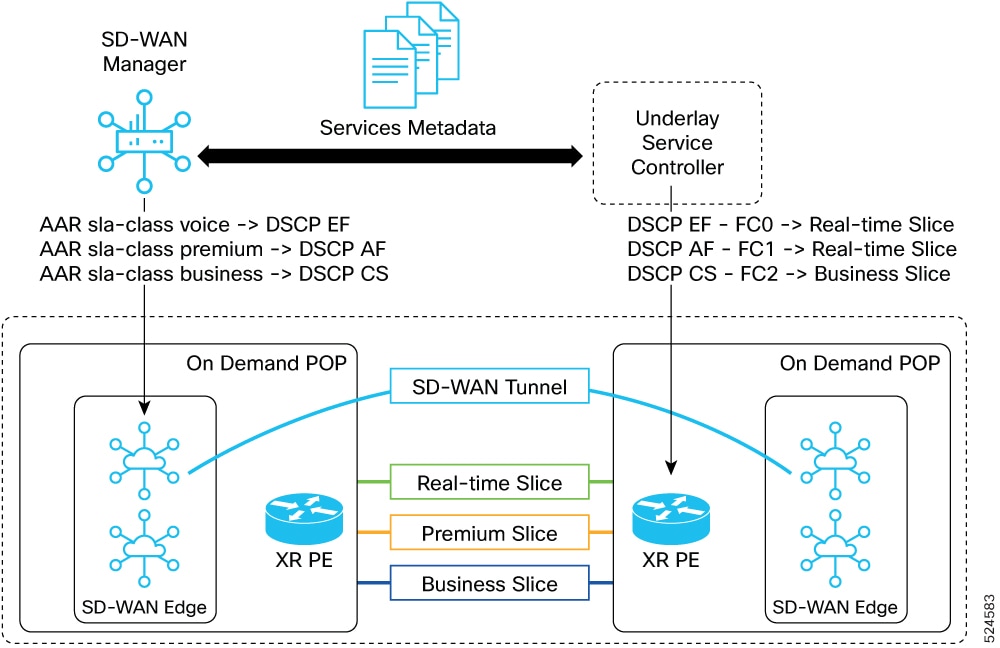
SD-WAN and SR policy integration
The objectives of SD-WAN and SR policy integration use case include
-
creating business value for the SD-WAN operator by offering SLAs enabled by the underlay operator for SR and SRv6
-
designing validation in lab set-up, and
-
minimizing overlay and underlay operational complexity.
The figure shows the SD-WAN and SR policy integration.
Benefits of SD-WAN and SR policy integration
The benefits of SD-WAN and SR policy integration include several values for
-
Transport operator:
-
New revenue streams by offering more services
-
Pay-as-you-use (per-slice monetization)
-
Unlock new SLAs by moving beyond traditional QoS
-
-
SD-WAN operator:
-
Offer differentiated traffic steering
-
Offer more value with application intent and tighter integration with underlay services
-
-
SD-WAN customer:
-
Better value for services
-
Improved application performance
-
Significant reduction in downtime
-
SPDC centralized and edge DC interconnection
There is a resurgence in use cases requiring edge data center connectivity. The same basic connectivity is typically used in the case of a centralized data center. The interior of the data center is considered a different network domain than the metro transport network and is often connected through a border device. However, there are use cases where a single end-to-end control and data plane is used across both metro transport and data center.
External interconnect
This Agile Metro architecture use cases on external interconnect include public cloud interconnection, and internet peering and content delivery use cases.
Public cloud interconnection
Public cloud interconnect refers to these use cases:
-
Interconnecting the carrier or enterprise network to a local instance of a cloud provider infrastructure. For example, AWS Outpost.
-
Carrier or enterprise connecting their network to the network of the cloud provider through private interconnect. For example, AWS Direct Connect, which is used by enterprises to connect directly to AWS, or by service providers aggregating the AWS connections of their customers through a connection to AWS.
Internet peering and content delivery
As bandwidth to subscribers continues to increase, offloading traffic from a provider network is a key method to reduce capacity costs. CDN caches are now deployed in most networks across the world, and continue to be deployed to help optimize video delivery from both on-net and off-net sources. The joint solution of Cisco and Qwilt on open edge caching is one method that providers can use to optimize traffic across the network. The way these caching clusters or traditional internet peering, or transit services are connected to the new edge network is a supported use case.
The robust family of Cisco routers can be used for internet peering within the new Metro network, or at traditional carrier peering facilities.
Network service assurance using PCA
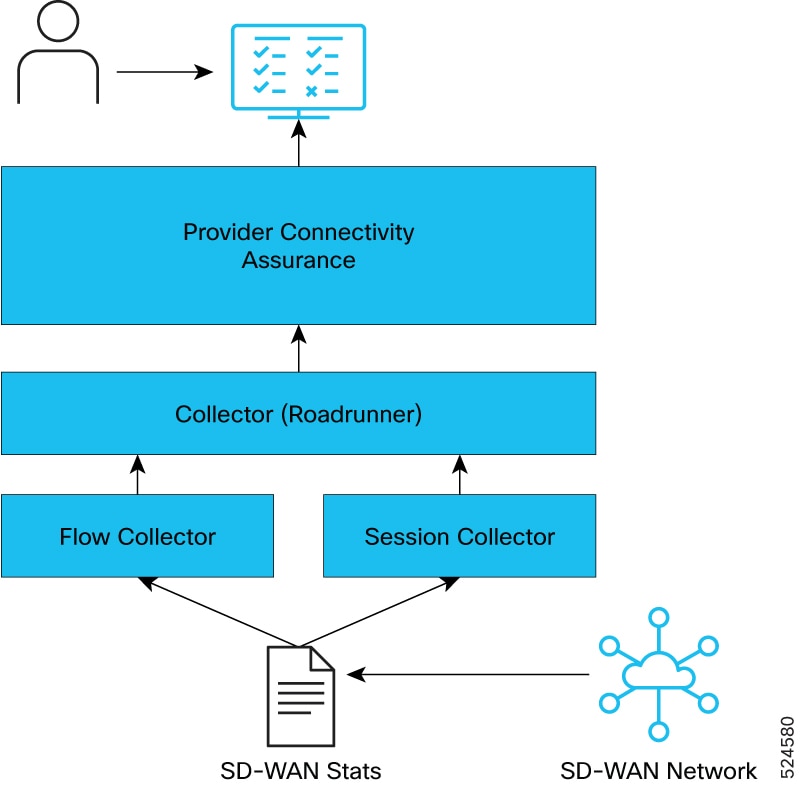
The figure shows the Cisco Provider Connectivity Assurance (PCA) solution components for network service assurance.
These are the network services assurance use cases using Cisco PCA:
-
Routed PON service assurance: PCA adds value to the existing RPON monitoring applications such as PON Manager, by combining network infrastructure information with subscriber-specific RPON data. The PCA RPON dashboard ingests data from the core provider network as well as data from the PON manager.
For details, see Routed PON service assurance using Provider Connectivity Assurance.
-
Business service assurance: PCA covers this use case today, enhancing the capability of service assurance in tools like CNC. PCA sensors are deployed at the customer endpoint, sessions created per service or per SLA are probed, and then reported back to the analytics platform monitoring it per service. Within the context of the Agile Metro architecture, these existing capabilities are augmented using additional network infrastructure assurance data. The network infrastructure assurance data sources are SR-PM and additional PCA sensors.
-
SD-WAN service assurance: SD-WAN connections are overlay services that are considered as an overlay technology. That is, the transport for the SD-WAN connection is agnostic of the underlay network with the only requirement that the underlay network provides IP connectivity between SD-WAN endpoints. In Agile Metro we combine data from the overlay and underlay together to enhance visibility across the service when carried over a service provider network.
The ability to combine and correlate data from overlay and underlay using PCA provides several positive outcomes:
-
Simplified troubleshooting of performance issues
-
Enhanced QoE by mapping high priority SD-WAN sessions to specific underlay paths
-
Ability to offer richer service types
For details, see SD-WAN assurance using Cisco Provider Connectivity Assurance.
-
Provider Connectivity Assurance user experience
Provider Connectivity Assurance user experience (PCA UE) is an automation solution that
-
provides real-time visibility into user traffic flows
-
provides intelligent reporting of user traffic flows, and Quality of Experience (QoE) metrics for individual users, and
-
combines the user data with underlying transport infrastructure data to give an end-to-end view of the entire service.
Benefits of PCA UE solution
The PCA UE solution offers these benefits:
-
provides quick access and visualization tools with real-time actionable AI insights
-
characterizes any type of traffic and encapsulation: QUIC, TCP, UDP, GTP, MPLS/SR/SRv6, and
-
offers visibility at the granularity of individual cell sites and applications.
PCA UE components
The PCA UE solution comprises of these components:
-
PCA UE sensor: responsible for the collection of flow data from the network for further analysis.
-
PCA UE collector: the data collector that is used to ingest and aggregate data coming from the centralized or distributed PCA UE sensors.
-
PCA platform: component that provides visual dashboards and analysis for network wide data and that is also responsible for management of PCA UE sensors.
PCA UE use case
Cisco Agile Metro release 2.0 introduces the support for the PCA UE use case—network intelligence for actionable insights—that enables service providers to gain a deep, actionable understanding of network and application performance from a user's perspective. This use case leads to improved service delivery, proactive issue resolution, and enhanced customer satisfaction. See, How network intelligence provides actionable insights into network and application performance
PCA user experience deployment models
You can deploy PCA user experience solution in either of these models:
-
Distributed deployment model
-
Centralized deployment model
Distributed deployment model for PCA user experience
In distributed deployment model, the PCA UE sensor is deployed as a container running on the Cisco IOS XR application hosting sub-system on a cell-site router (CSR).
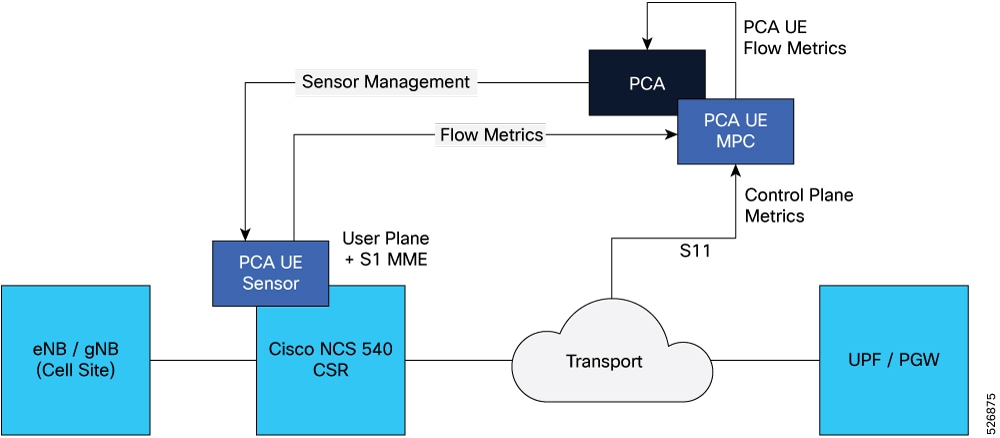
The CSR deployment model supports use cases where IPSec is not being used between the RAN network and mobile core.
Centralized deployment model for PCA user experience
In centralized deployment model, the PCA UE sensor is deployed in a more centralized monitoring point such as the PE device connecting mobile backhaul to the mobile core.
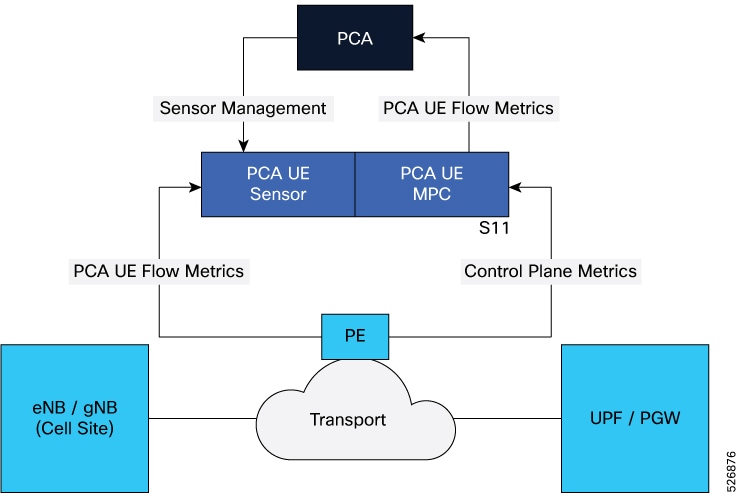
The PCA UE collector collects the user plane and control plane metrics. It then streams combined flow data into the PCA.
You can use the centralized deployment model in these use cases:
-
where it is beneficial to monitor the user traffic at the mobile core due to IPSec transport encryption, or
-
where the CSR is not a supported Cisco IOS XR device.
Supported hardware for PCA user experience sensor
The table lists the hardware support matrix for the distributed PCA UE sensor in Agile Metro solution.
|
Network role |
Product Id |
NPU |
Bandwidth |
Cisco IOS XR Software Release in which support was introduced |
|---|---|---|---|---|
|
Large |
N540-24Q8L2DD-SYS |
Q2A |
800 |
25.3.1 |
| N540-24Q2C2DD-SYS |
Q2A |
800 |
25.3.1 |
|
| Medium | N540-ACC-SYS |
QAX |
300 |
25.3.1 |
|
N540X-ACC-SYS |
QAX |
300 |
25.3.1 |
|
|
N540-24Z8Q2C-SYS |
QAX |
300 |
25.3.1 |
|
| Medium | N540X-16Z4G8Q2C-D/A | QAX | 300 |
25.3.1 |
| N540X-16Z8Q2C-D | QAX | 300 |
25.3.1 |
|
| N540-28Z4C-SYS-D/A | QAX | 300 |
25.3.1 |
|
| N540X-12Z16G-SYS-D/A | QAX | 160 |
25.3.1 |
|
| N540-12Z20G-SYS-D/A | QAX | 160 |
25.3.1 |
|
| Fronthaul | N540-FH-CSR-SYS | QAX | 300 |
25.3.1 |
PCA use case: network intelligence for actionable insights
How network intelligence provides actionable insights into network and application performance
This topic describes the workflow of one of the PCA UE use cases: network intelligence for actionable insights.
Summary
These are the key components involved in this workflow:
-
Ingestion, cleaning, and transformation module: processes and refines real-time network traffic into a clean and compact data source by reading only packet headers
-
PCA UE sensor: uses machine learning algorithms to identify network flows, infer congestion, and enrich data to create a per User Flow Quality of Experience (QoE) data set
-
PCA Analytics: provides actionable insights on consumer QoE, application, and network performance by leveraging Customer Experience (CX) metrics
-
Dashboards: visualizes key metrics such as CX Score per cell-site and application, and network-wide user performance statistics
-
Applications: enables users to understand per-application user experience in detail
-
API: allows the export of CX insights to other external systems for further cross-domain analysis
This process transforms raw network traffic data into actionable insights regarding CX, application, and network performance, leveraging machine learning and advanced analytics to improve service delivery.
Workflow
These stages describe how network intelligence solution provides actionable insights into network and application performance:
- Data preparation: The system processes and refines real-time network traffic by ingesting, cleaning, and transforming it into a clean and compact data source, focusing solely on reading packet headers.
- Intelligent analysis: The PCA UE Sensor applies machine learning algorithms to the prepared data to identify network flows and infer congestion. It then enriches this data with available IP or network-level information, leading to the creation of a comprehensive per User Flow QoE data set.
- Insight generation: PCA Analytics utilizes the generated QoE data and CX metrics to provide actionable insights concerning consumer QoE, application performance, and overall network performance.
-
Insight consumption and integration:
- The system presents insights through dashboards, which display the CX score per cell-site and per application, calculated from flow-based data and network KPIs, along with user performance network-wide statistics.
- Dedicated applications allow for a detailed understanding of the per-application user experience.
- An API facilitates the export of these CX insights to other external systems, enabling further cross-domain analysis and broader operational integration.

 Feedback