Deploying Highly Available Services with Cisco Nexus Dashboard, Release 4.x and Later
Available Languages
Bias-Free Language
The documentation set for this product strives to use bias-free language. For the purposes of this documentation set, bias-free is defined as language that does not imply discrimination based on age, disability, gender, racial identity, ethnic identity, sexual orientation, socioeconomic status, and intersectionality. Exceptions may be present in the documentation due to language that is hardcoded in the user interfaces of the product software, language used based on RFP documentation, or language that is used by a referenced third-party product. Learn more about how Cisco is using Inclusive Language.
- US/Canada 800-553-2447
- Worldwide Support Phone Numbers
- All Tools
 Feedback
 Feedback
This white paper provides a comprehensive guide on deploying a highly available Cisco Nexus Dashboard cluster, emphasizing the importance of reliability, scalability, and fault tolerance.
The Cisco Nexus Dashboard is a powerful solution designed to streamline network operations by providing a unified view of the data center network to monitor, automate and extend network and policies across fabric groups.
The document covers essential concepts of Nexus Dashboard, considerations for determining the optimal number of nodes, and strategies for handling failure scenarios. By following the guidelines outlined in this white paper, organizations can ensure a resilient and efficient Nexus Dashboard environment that meets the demands of modern, containerized applications.
During initial cluster bootstrap, Nexus Dashboard requires the selection of a cluster persona that defines the operational focus of the platform. The two available personas are:
● LAN Persona: Optimized for data center LAN fabric management, including ACI and NX-OS fabrics. This persona supports the full range of controller, telemetry, and orchestration capabilities for LAN environments.
● SAN Persona: Optimized for storage area network (SAN) fabric management, including MDS fabrics.
The choice of persona is made during cluster bootstrap and cannot be changed after deployment. Each persona tailors the platform's capabilities, scale support, and service availability to the specific operational domain.
This document exclusively addresses Nexus Dashboard deployments configured with the LAN persona. All design considerations, best practices, failure scenarios, and recommendations presented in this white paper apply to LAN persona deployments. SAN persona deployments may have different characteristics, scale limits, and operational considerations that are not covered in this document.
Cisco Nexus Dashboard version 4.x is a unified, modern platform that simplifies the management and monitoring of data center networks. With the unification of legacy components (such as NDI, NDO, and NDFC), Nexus Dashboard now provides a seamless experience where you can directly consume telemetry, controller, and orchestration functions as needed, all through a single, integrated interface. This unification streamlines operations, enhances end-to-end visibility, and enables efficient network automation and performance optimization.
Nexus Dashboard is architected as a Kubernetes-based solution, ensuring a resilient, scalable, and flexible foundation for current and future data center needs. The underlying Kubernetes cluster is automatically deployed and fully managed by Nexus Dashboard, remaining transparent. While available as both an on-premises and cloud appliance, this document focuses exclusively on the on-premises deployment model. For Nexus Dashboard deployed on cloud, refer to the Nexus Dashboard Deployment Guide.
Note: Deploying a Virtual Nexus Dashboard (vND) in Amazon Web Services (AWS) is not a Software as a Service (SaaS) offering. In this model, you deploy and fully manage the virtual machines in the cloud from an operational standpoint, leveraging AWS as an Infrastructure as a Service (IaaS) platform. All operational responsibilities—including cluster lifecycle management, software upgrades, backup, and monitoring—remain with the customer, consistent with on-premises deployments.
This streamlined architecture empowers data center teams to accelerate operations, ensure consistent policy enforcement, and gain actionable insights—helping organizations to adapt rapidly to evolving business and technology requirements.
Deploying a Highly Available Nexus Dashboard Cluster
The following considerations were taken into account while writing this white paper:
● Enabling multiple features on a single cluster versus distributing features across federated clusters
● Onboarding of multiple independent fabrics on the same Nexus Dashboard
● Scale of primary, secondary, and stand-by nodes
● Physical placement of cluster nodes
● Failure scenarios and impacts
● General best practices to increase resiliency
Note that with Nexus Dashboard version 4.1, all services are unified into a single platform deployment. You can now directly consume telemetry, automation, and orchestration capabilities for onboarded platforms through an integrated experience. As a result, considerations for high availability and failure scenarios are simplified compared to previous versions (such as Nexus Dashboard 3.2 and earlier). There is no longer a need to manage separate deployment modes or install individual services: the unified architecture streamlines platform management and resiliency.
Additionally, this document focuses exclusively on Nexus Dashboard clusters deployed with the LAN persona. The LAN persona is selected during cluster bootstrap and is optimized for data center LAN fabric management (ACI and NX-OS). Deployments using the SAN persona (optimized for MDS/SAN fabric management) are outside the scope of this document and may have different design considerations and scale characteristics. Refer to the Cisco Nexus Dashboard Deployment and Upgrade Guide for more information.
Physical or Virtual Type of Deployments
Cisco Nexus Dashboard can be deployed in a data center either as a virtual form factor or a physical form factor. It is not possible to mix within the same cluster physical and virtual nodes.
The physical form factor is offered as a cluster of specialized Cisco UCS servers (Nexus Dashboard platform). The virtual form factor currently allows you to deploy a Nexus Dashboard cluster using VMware ESXi, Linux KVM and Nutanix (starting from Nexus Dashboard 4.2) hypervisors. More hypervisor support is currently evaluated.
The choice of form factor does not imply consequences in terms of resiliency of the system.
The following technologies and operations are not supported for Nexus Dashboard virtual form-factor deployments:
● vMotion (VMware)
● Live Motion
● Distributed Resource Scheduler (DRS) and similar automated workload balancing technologies
● Virtual machine snapshot backup and restore
● Remote storage (e.g., NFS, iSCSI, or SAN-backed datastores)
The choice between virtual and physical form factors should be made based on considerations like:
1. Scale of data center fabrics intended to be managed by the Nexus Dashboard cluster.
2. Operational preferences for managing the cluster (i.e. physical servers vs virtual machines).
3. Operational and capital expenses.
You can verify scale considerations on the Nexus Dashboard Capacity Planning tool: physical Nexus Dashboard deployments do support larger flexibility in terms of scale support. For larger fabrics, physical deployment may be required.
This document does not provide considerations for cost. Customers should be able to estimate the comparison between acquiring, cabling, stacking, and operation of a Nexus Dashboard cluster running on a virtual compared to a physical form factor.
Note: Although starting with Nexus Dashboard 4.1 a single cluster could provide automation, telemetry and orchestration capabilities, there are still some limitations on the older physical and virtual platforms. For example, the older generation of hardware SE-NODE-G2 is not capable of running all features. Refer to Nexus Dashboard Capacity Planning for more information.
Recommendation: If deployed in a virtual form factor, we recommend deploying each virtual cluster node in a different server. This will increase the resiliency in case of server failure.
Scale of Primary, Secondary and Standby Nodes
Nexus Dashboard cluster nodes are individual virtual or physical instances that work together to form a resilient and scalable cluster. These nodes collaborate to distribute the workload, enhance performance, and ensure high availability.
A Nexus Dashboard consists of a cluster of primary nodes (1 or 3 primary nodes) and optionally secondary nodes (3 secondary nodes).
Note: 1-node cluster has no redundancy mechanism, and while it is fully supported, it is not recommended for production environments and will not be considered in this document.
A cluster can be brought up with 6 nodes (3 primary and 3 secondary):
● Primary nodes are intended to run Kubernetes control plane capabilities, like the API server, controller manager, scheduler, and etcd (a distributed key-value store for cluster operational data). The control plane manages and controls the overall state of the cluster. On top of those control plane functions, primary nodes also run Nexus Dashboard service pods.
● Secondary nodes provide additional resources to the cluster to load share for Nexus Dashboard pods.
Note: Nexus Dashboard does not support dynamic scale-out of cluster resources. A cluster must be bootstrapped with either 3 nodes (3 primary) or 6 nodes (3 primary + 3 secondary) from the initial deployment. While it is technically possible to add 3 secondary nodes to an existing 3-node primary cluster, this operation does not retroactively increase the cluster's scale capacity to that of a 6-node cluster. The resulting cluster will continue to operate at the scale limits of the original 3-node deployment. To achieve full 6-node scale support, the cluster must be bootstrapped as a 6-node cluster from the outset.
When a new Nexus Dashboard is bootstrapped, you define the role-primary, secondary or standby of each node added to the cluster. Once the role is assigned, it cannot be changed unless the node is removed from the cluster, cleaned up and readded with a different role.
When adding nodes to an existing cluster, the additional nodes must be of the same form factor (physical or virtual) and software version as the rest of the nodes in the cluster.
All cluster nodes must run the same software version at all times. Software upgrades are performed atomically across all nodes in the cluster to ensure consistency. It is not possible to form a cluster with nodes running different software versions, nor can a node running a different software version be added to an existing cluster. This practice ensures the highest availability and stability of the Nexus Dashboard deployment.
Once the cluster is up, you can always verify the role of nodes either from the GUI or from CLI command as shown below.
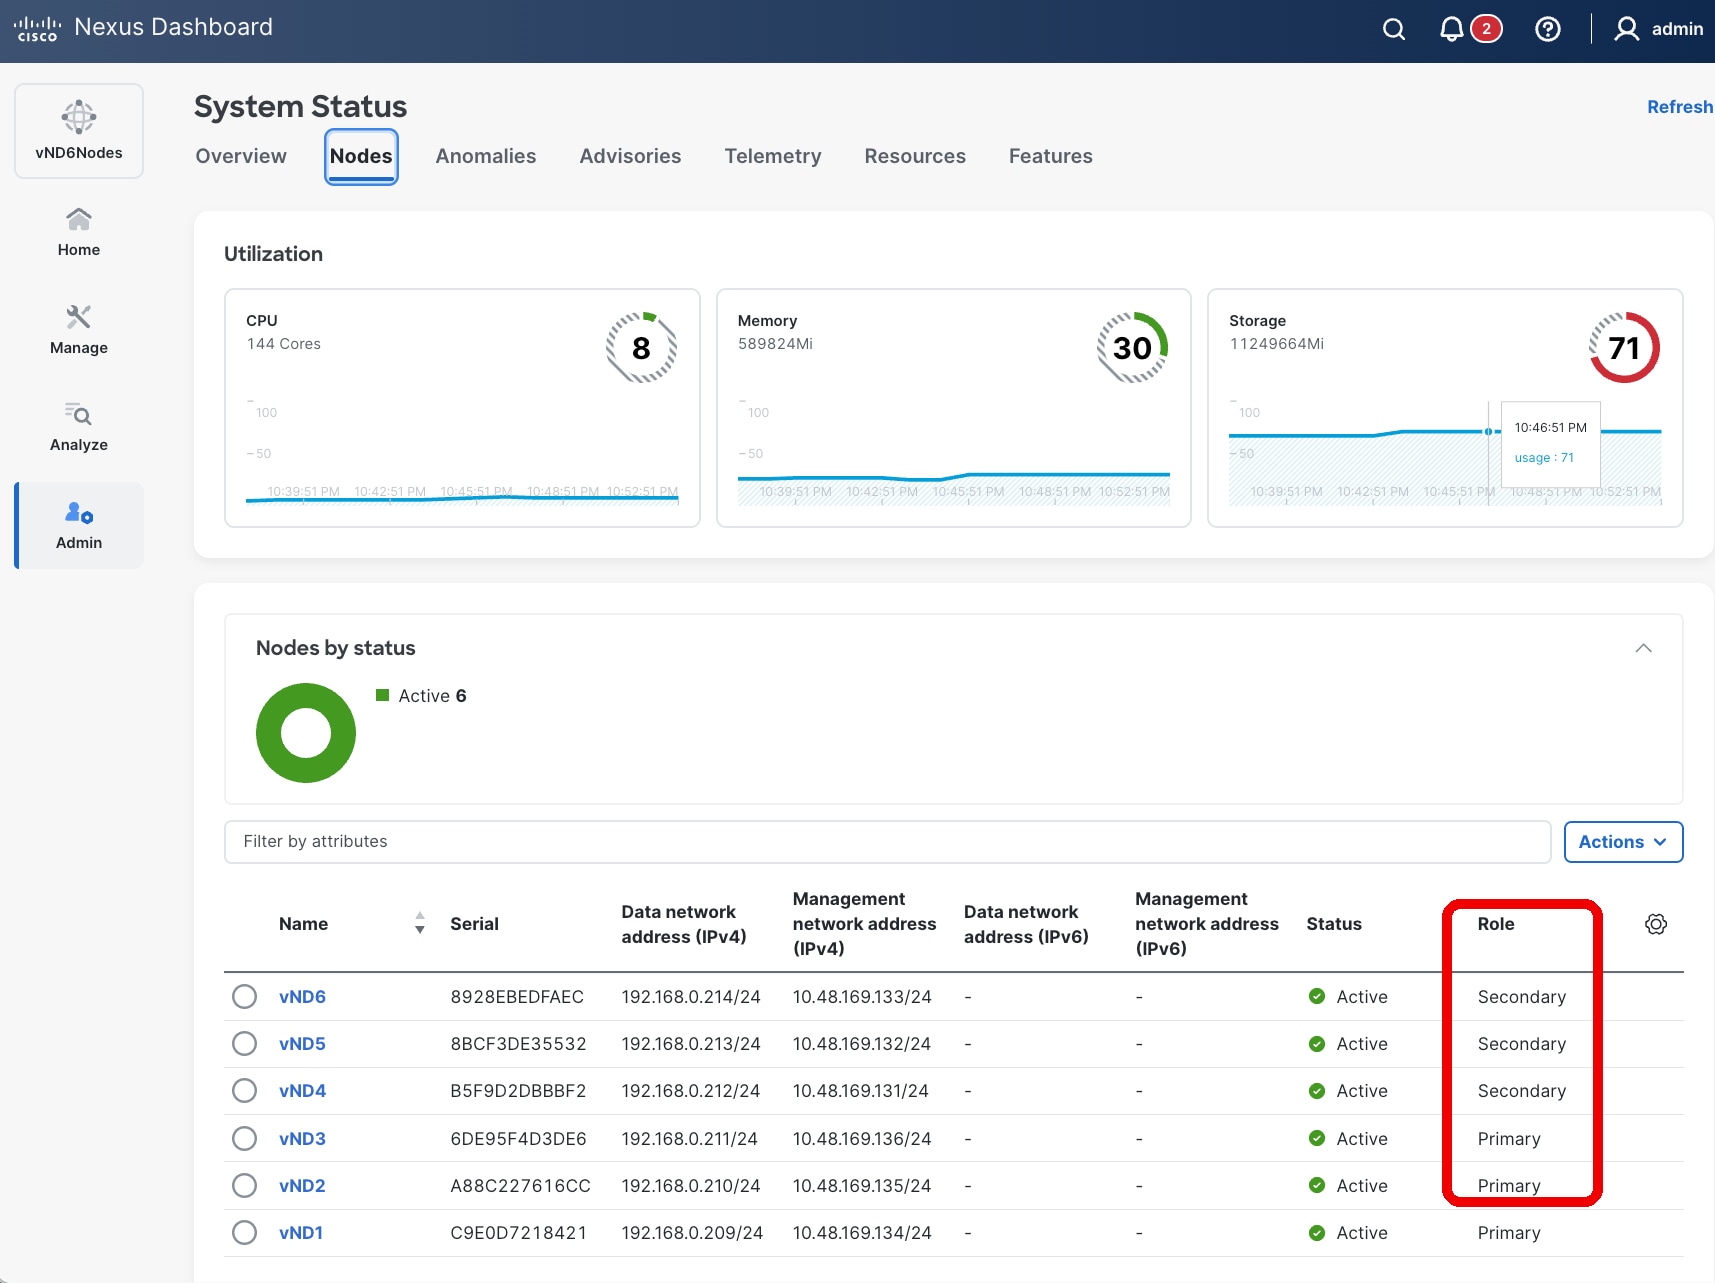
Figure 1 Nexus Dashboard UI showing the cluster node role
rescue-user@vND1:~$ kubectl get nodes
NAME STATUS ROLES AGE VERSION
vnd1 Ready master 245d v1.27.7
vnd2 Ready master 245d v1.27.7
vnd3 Ready master 245d v1.27.7
vnd4 Ready worker 192d v1.27.7
vnd5 Ready worker 192d v1.27.7
vnd6 Ready worker 192d v1.27.7
rescue-user@vND1:~$
Note: In the CLI output the role “master” refers to primary and “worker” to secondary.
It is possible to verify which Kubernetes pod is running in which cluster node either by using the ND GUI or by using the CLI.
From the UI, it is possible to verify which pods are running per node, as shown in the figure below.
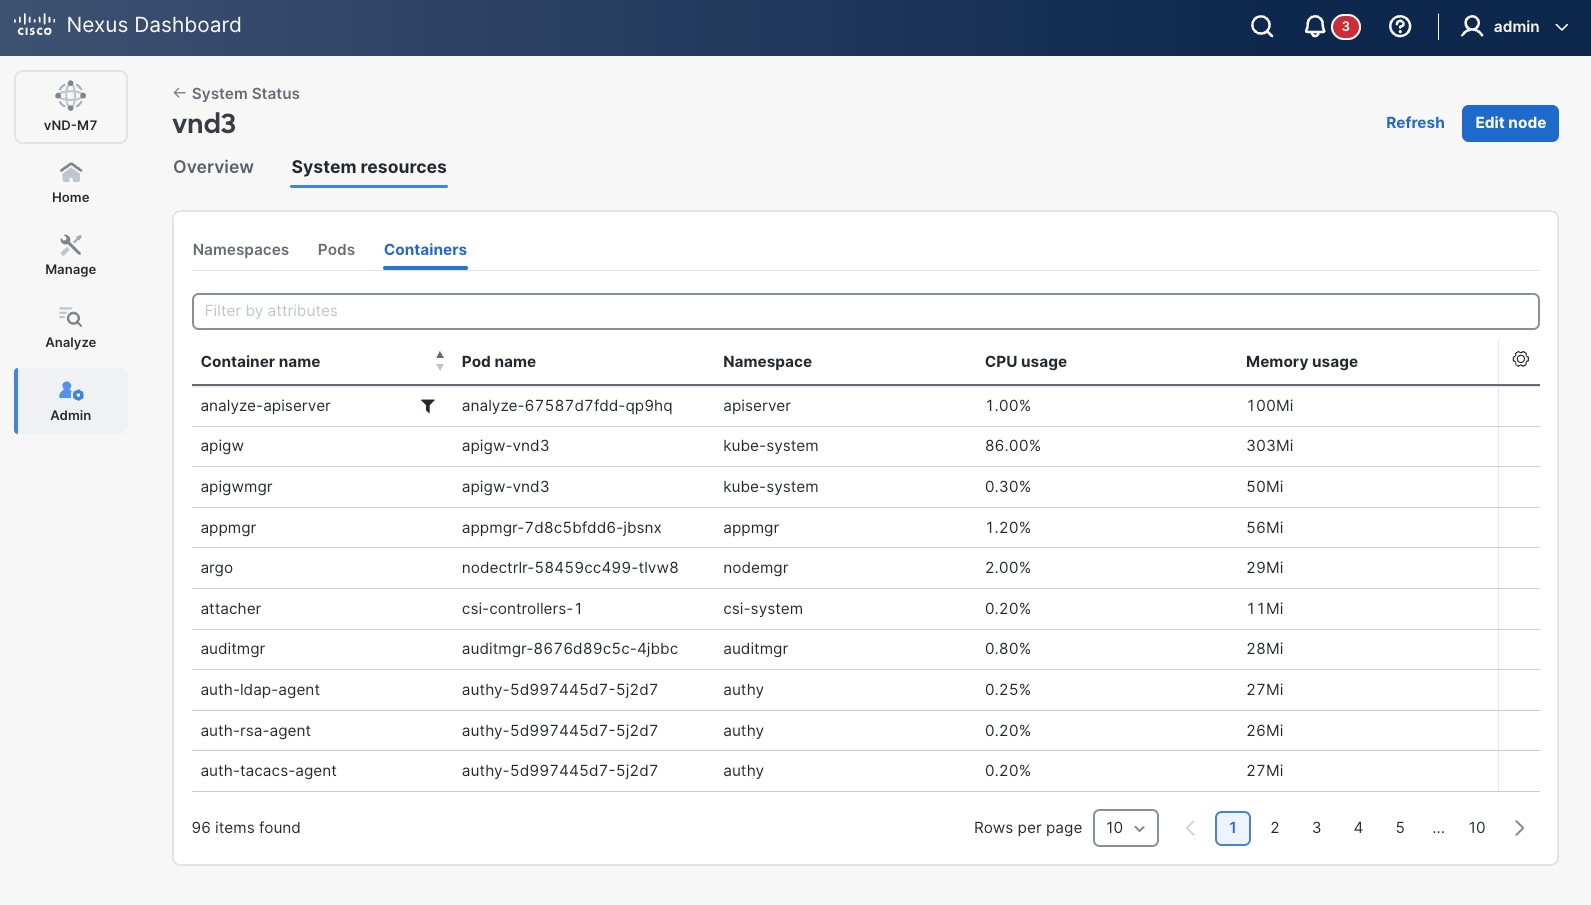
Figure 2 Nexus Dashboard UI shows the details of the pods running on the platform
From the CLI, you can use the kubectl commands to verify on which cluster node the pods are running.
rescue-user@vND3:~$ kubectl get pods -A -o=custom-columns='NAME:.metadata.name,NODE:.spec.nodeName'
NAME NODE
aci-inventory-7457b5d59-8gjc4 vnd2
agni-696fc9cd8d-flpj5 vnd2
agni-696fc9cd8d-r22mr vnd1
apicagent-7598d7dc6d-xdktd vnd2
apiserver-99c66f4c7-4gn99 vnd1
apiserver-99c66f4c7-t8tp7 vnd2
araku-65f6889bbd-zt88b vnd1
aru-9799cdf95-cl576 vnd1
beaver-84d4d7989d-7ks4r vnd1
collectorpersistent1-78658d756d-l8zkt vnd3
collectorpersistent2-76bf7c6877-8qrtw vnd1
collectorpersistent3-5db6dbd8f6-cdc4t vnd2
configagent-7f6d9c8d96-mb2z4 vnd2
correlator-6564c49dc7-ls445 vnd2
devicepolicymgr-65588cbd6f-sgvp8 vnd1
dgraph-c5cfb8d5b-qmtbr vnd1
doon-696c585f69-fl8cx vnd2
[…]
rescue-user@vND3:~$
In a physical form-factor cluster, all nodes should be the same type of Cisco UCS servers. If you combine multiple different hardware nodes, i.e. UCS-C220-M5 (SE-NODE-G2) and UCS-C225-M6 (ND-NODE-L4), then the lowest hardware generation scale would apply for the cluster.
Note: There might be specific limitation in combining different hardware nodes in the same cluster. Refer to the Cisco Nexus Dashboard Deployment and Upgrade Guide for more information.
In a virtual form-factor cluster, primary nodes are ‘Data’ profile nodes, while secondary nodes are ‘App’ profile nodes. This latter profile has lower requirements in terms of virtual CPU, memory, and storage compared to the Data node profile.
Note: It is not possible to change the profile for an existing virtual node.
In a virtual form-factor cluster deployment of Cisco Nexus Dashboard, the following considerations apply:
● When deploying 3-node cluster—3 primary nodes only—the nodes can be configured with either the ‘App’ or ‘Data’ profile. The ‘App’ profile has lower resource requirements and is generally recommended for non-data-intensive applications (i.e. Controller, Orchestration), while the ‘Data’ profile supports maximum scale and performance.
● For a 6-node virtual cluster, the deployment must consist of 3 primary nodes with the ‘Data’ profile and 3 secondary nodes with the ‘App’ profile. This configuration supports enhanced scalability and workload distribution.
● It is not possible to promote an existing 3-node cluster composed solely of ‘App’ profile nodes to a 6-node virtual cluster. This limitation is due to the requirement that the 3 primary nodes in a 6-node cluster must have the ‘Data’ profile.
Note: A 3-node App profile-based cluster does not support the telemetry functionality.
From Nexus Dashboard 4.1 the only Cisco validated options with secondary nodes are the following:
● 3 primary virtual nodes and 3 secondary virtual nodes.
● 3 primary physical nodes and 3 secondary physical nodes.
Note: 6 node cluster is not available on certain hardware. Verify on Nexus Dashboard Capacity Planning tool for more information.
Nexus Dashboard also provides the concept of a standby node. You can add up to two standby nodes to a cluster. Standby nodes are only supported with 3-nodes (or more) Nexus Dashboard cluster deployments. Standby nodes are not supported with a 1-node Nexus Dashboard cluster.
A standby node is designed to rapidly restore full cluster functionality by replacing a failed primary node. Standby nodes remain inactive during normal operation—they do not participate in any cluster workloads but are visible as part of the Nexus Dashboard cluster.
● You can add up to two standby nodes to a cluster.
● Standby nodes are only supported with 3-node (or larger) Nexus Dashboard cluster deployments; they are not supported with a 1-node cluster.
● A standby node is supported for both virtual and physical form factors.
● For virtual form factors, the standby node must be the same node type and software version as the primary cluster nodes (e.g., 'Data' or 'App' profile).
● Standby nodes are not supported for virtual clusters based on KVM or Nutanix hypervisors.
● Each standby node is assigned its own physical IP addresses for the management and data interfaces when added to the cluster.
● Standby nodes are not supported for virtual clusters based on KVM or Nutanix hypervisor.
If a standby node is not available, a failed primary node can be replaced by another available node.
A standby node cannot fail over secondary nodes. To replace a secondary node it is required to delete the failed node from the cluster and add a new node as secondary.
Refer to the Cisco Nexus Dashboard Troubleshooting guide for more information about replacing failed nodes.
The following considerations apply to the increase in the number of cluster secondary nodes.
Increased Performance and Enhanced Scalability
A larger number of cluster nodes allows to scale-up the system for better distribution of tasks and workloads, leading to improved system performance and reflected in higher scale support.
Additional cluster nodes enhance the scalability of the system, accommodating the growth of the network infrastructure.
More cluster nodes may also increase the ability to run multiple features simultaneously. You can refer to the Nexus Dashboard Capacity Planning tool for further information on scale and multi-service support.
Efficient Resource Utilization
The distribution of tasks across numerous nodes promotes efficient resource utilization, preventing overloading on any single node.
Resource-intensive tasks can be distributed, preventing performance degradation.
Cost Implications and Complexity of Management
The cost of additional cluster nodes, either in terms of hardware or virtual resources, should be considered.
However, as the number of nodes increases, the increase of complexity of managing the cluster is negligible. Nexus Dashboard platform fully manages all cluster nodes from a lifecycle and connectivity management standpoint. The only additional operational burden is due to the racking and stacking of the extra cluster nodes (if physical form factor) or planning of virtual computing resources (if virtual form factor), the need for reserving additional IP addresses and the replacement handling in case of failure.
For considerations regarding node failure and their impact on high availability, see Failure Scenarios and Impacts.
Recommendation: Cluster size should be solely chosen based on scalability and co-hosting requirements, as adding more secondary nodes would not directly provide any benefit in terms of redundancy and resiliency of the system.
Recommendation: For physical clusters, consider standby nodes to quickly restore full cluster size in case of a node failure.
Enabling Multiple Features on a Single Cluster
As mentioned, Nexus Dashboard 4.1 revolutionize the way to install and consume features. A single Nexus Dashboard cluster can run multiple features simultaneously for the onboarded fabrics.
In the past, you had to statically decide what services to enable on Nexus Dashboard by selecting a cluster deployment mode at installation. This deployment mode could not be changed once selected.
Starting with Nexus Dashboard 4.1, any service can be enabled or disabled at runtime by selecting the specific feature or features to be activated at fabric level. The choice is done during or after the fabric onboarding by editing the fabric settings.
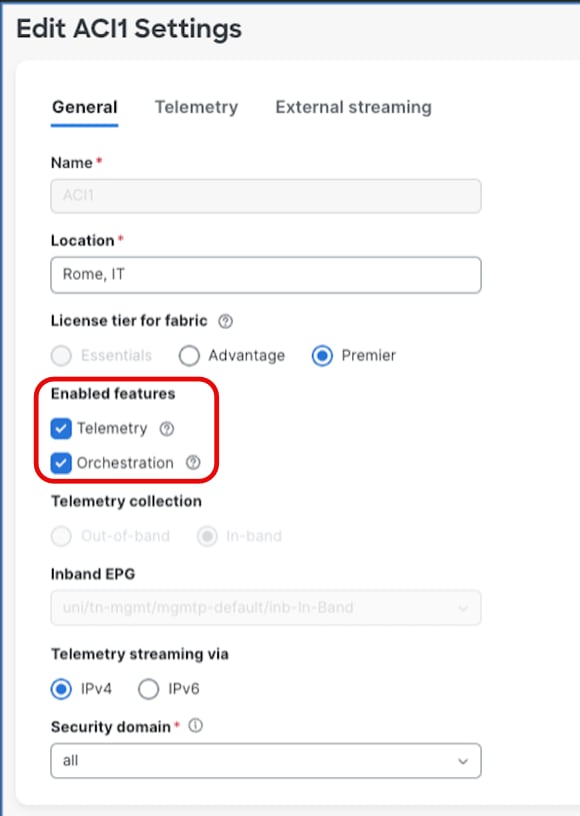
Figure 3 Edit Fabric Settings
Enabling multiple services (features) on the same Nexus Dashboard may involve:
1. Scale impact.
2. Cluster failure considerations.
When enabling more than one feature on the fabrics onboarded on the Nexus Dashboard cluster, for some cluster type there might be scale implications for the maximum number of switches that can be managed. If the scale goes beyond the requirement, an option could be to federate multiple ND clusters and enable a different feature on each for the same managed fabrics. Check the paragraph 'Distributing Features Across Federated Clusters' for more information.
Use the Nexus Dashboard Capacity Planning tool to determine the exact scale support.
Note: With the advent of Unified Nexus Dashboard 4.1, scale impact related to running multiple services on the same cluster has been drastically reduced: where possible, the aim is to provide the same level of scale regardless of what services are enabled on Nexus Dashboard. Currently there are a few exceptions, mostly to provide backward platform and scale compatibility.
Cluster failure considerations
In summary, while enabling multiple features on the same Nexus Dashboard cluster can optimize resource utilization and operational efficiency, it also amplifies the impact of cluster failures. Careful planning of cluster size, deployment architecture, node recovery strategies, and backup procedures is essential to maintain high availability and minimize service disruption in such environments.
Distributing Features Across Federated Clusters
This approach is particularly beneficial when resiliency and high availability are critical for specific features, such as controller and orchestration, but less so for others like telemetry. In such cases, distributing features across dedicated Nexus Dashboard clusters allows mission-critical features to be hosted with tailored configurations that enable rapid failover or recovery in the event of failure. Meanwhile, less critical features can be assigned to separate clusters without stringent availability requirements.
However, this model also entails managing and operating multiple Nexus Dashboard clusters, which introduces additional operational complexity and costs. Therefore, while distributing features across federated clusters can optimize availability for prioritized features, running multiple features on a single Nexus Dashboard cluster generally remains the preferred solution, offering the best balance between resiliency and operational efficiency.
This design consideration should be evaluated carefully based on the specific availability requirements, operational capabilities, and cost constraints of the deployment environment.
Note: When distributing features across multiple Nexus Dashboard clusters managing the same fabrics, federation is required starting with ND 4.1. For high availability implications of federated deployments, see Multi-Cluster Federation and High Availability.
Multi-Cluster Federation and High Availability
Overview of Multi-Cluster Federation
Starting with Nexus Dashboard version 4.1, when multiple Nexus Dashboard clusters are deployed to manage the same or overlapping sets of fabrics (as described in the Distributing Features Across Federated Clusters section), these clusters must be federated to enable coordinated management. Federation establishes a trusted relationship between Nexus Dashboard clusters, allowing them to share fabric information and coordinate service delivery across the federated environment.
In a federated deployment, one cluster is designated as the primary cluster, and all other clusters in the federation are designated as secondary clusters. The primary cluster serves as the coordination point for the federation and plays a central role in maintaining federation state and consistency.
For detailed information on multi-cluster connectivity and federation setup, refer to Connecting Clusters — Understanding Multi-Cluster Connectivity in Nexus Dashboard.
High Availability Implications of Federation
While federation enables operational flexibility through the capability of distributed features across multiple ND federated clusters, it also introduces additional high availability considerations that must be carefully evaluated. The primary cluster plays a critical role in the federation, and its failure has different implications compared to the failure of a secondary cluster.
Failure of a Secondary Cluster
The failure of a secondary cluster in a federation impacts only the features and fabrics managed by that specific cluster. The primary cluster and other secondary clusters in the federation continue to operate normally. Recovery follows the standard Nexus Dashboard cluster restoration procedures described in the see Failure Scenarios and Impacts and Disaster Recovery Consideration sections of this document.
Note: After restoring a failed secondary cluster from backup, the cluster will rejoin the federation automatically, provided that:
● The restored cluster uses the same cluster name as the original cluster from which the backup was taken.
● Network connectivity to the primary cluster is available.
Failure of the Primary Cluster
The failure of the primary cluster has a broader impact on the federation, as it serves as the coordination point for all federated clusters. While secondary clusters continue to operate independently for their locally managed features and fabrics, federation-level coordination is disrupted until the primary cluster is restored.
There are two recovery paths for a failed primary cluster, depending on the severity of the failure:
Option 1: Restore the Primary Cluster (Preferred)
The preferred approach is to restore the primary cluster to operational status. This can be achieved by either:
● Recovering the existing cluster, if the failure is recoverable (e.g., single primary node failure with standby failover or node replacement).
● Restoring from backup onto a new or rebuilt cluster.
Important: When restoring a federated primary cluster from backup, it is mandatory that the restored cluster uses the same cluster name as the cluster from which the backup was taken. If the cluster name does not match, the restored cluster will not be recognized by the federation and will not rejoin the federated environment. This requirement applies to both primary and secondary cluster restorations within a federation.
Option 2: Rebuild the Federation (When Primary Cannot Be Restored)
If the primary cluster cannot be restored (e.g., backup is unavailable or corrupted, or the failure is unrecoverable), the federation must be rebuilt from scratch. This process involves the following steps:
1. Remove all secondary clusters from the federation. Each secondary cluster must be disconnected from the failed federation.
2. Destroy the failed primary cluster's federation state. Ensure that no remnants of the old federation configuration remain.
3. Re-establish the federation by designating a new primary cluster and re-adding the secondary clusters to form a new federation.
Federation Design Recommendations
Based on the above failure scenarios, the following recommendations apply to federated Nexus Dashboard deployments:
● Protect the primary cluster: Since the primary cluster is the most critical component of the federation, apply the highest level of protection to it. This includes:
● Using standby nodes (for physical form factor) to enable rapid failover of failed primary nodes.
◦ Distributing the primary cluster's nodes across multiple availability zones within the same logical DC, where feasible.
◦ Ensuring frequent and reliable backups of the primary cluster, stored in multiple geographical locations.
● Document the cluster name: The cluster name is a critical identifier for federation restoration. Ensure that the cluster name for each federated cluster is documented and accessible as part of your disaster recovery runbook. A mismatch in cluster name during restoration will prevent the cluster from rejoining the federation.
● Plan for federation rebuild scenarios: Even with best practices in place, plan and document the procedure for a full federation rebuild as a last-resort recovery option. This should include:
◦ An inventory of all federated clusters and their roles (primary/secondary).
◦ The features and fabrics managed by each cluster.
◦ The sequence of steps to disconnect secondary clusters, rebuild the federation, and re-onboard fabrics.
● Minimize federation size where possible: Each additional cluster in a federation increases the coordination complexity and the potential blast radius of a primary cluster failure. Only federate clusters when operationally necessary (i.e., when distributing features across clusters is required for the same fabrics).
● Backup all federated clusters independently: Each cluster in the federation should have its own independent backup schedule and storage. Do not rely solely on the primary cluster's backup to restore the entire federation.
Summary of Federation Failure Scenarios
| Failure Scenario |
Impact |
Recovery Path |
| Secondary cluster failure |
Only features and fabrics on the failed cluster are affected. Other clusters in the federation operate normally. |
Restore the failed cluster using standard procedures. Ensure the same cluster name is used when restoring from backup. |
| Primary cluster failure (recoverable) |
Federation coordination is disrupted. Secondary clusters continue local operations. |
Recover the existing cluster (e.g., standby failover, node replacement) or restore from backup using the same cluster name. |
| Primary cluster failure (unrecoverable) |
Federation coordination is lost. Cross-cluster features are impacted. |
Remove all clusters from federation, destroy old federation state, and rebuild the federation with a new primary cluster. |
Consideration for Onboarding of Multiple Independent Fabrics on the Same Nexus Dashboard
Conversely, if the fabrics are operationally and traffic-wise independent — meaning there is no requirement for inter-fabric connectivity nor for end-to-end traffic visibility between them — onboarding them on the same Nexus Dashboard cluster is not strictly necessary, and separate clusters can be deployed based on other design considerations (such as scale, fault isolation, or operational domain separation).
While onboarding multiple fabrics on a single Nexus Dashboard cluster can optimize resource utilization, operational efficiency, and reduce costs, several critical factors must be carefully evaluated:
● Scalability: It is essential to assess the scalability of the Nexus Dashboard cluster services. Consider the total number of fabrics, devices, endpoints, and overall network size to ensure that the cluster can fully support the services required for all onboarded fabrics.
● Version Compatibility: Verify that all devices within each fabric to be onboarded and Nexus Dashboard cluster, are running compatible software versions. Incompatible versions can cause operational issues, so maintaining consistent and up-to-date software versions is crucial. For detailed compatibility information, refer to the Nexus Dashboard Compatibility Matrix.
● Round-Trip Time (RTT) Requirements: Ensure that all fabrics are within the acceptable RTT range for the services managing them. This is important to maintain performance and responsiveness across the fabrics. Refer to the Nexus Dashboard Deployment and Upgrade Guide for details of RTT requirements.
● Impact of Cluster Failure: Similar to enabling multiple features on the same Nexus Dashboard cluster, onboarding multiple fabrics on a single cluster increases the potential impact of a Nexus Dashboard failure. A failure in the cluster can affect all onboarded fabrics simultaneously, potentially causing widespread disruption of the Nexus Dashboard features enabled on those fabrics (e.g., telemetry, controller, orchestrator). Note that this disruption is limited to the Nexus Dashboard management, telemetry, and orchestration control planes; the control and data planes of the managed fabrics are not affected, and production traffic continues to be forwarded normally.
In summary, while onboarding multiple fabrics on the same Nexus Dashboard cluster can provide operational and cost efficiencies, it also amplifies the risk and impact of cluster failures potentially affecting multiple fabrics.
Connection of Nexus Dashboard to the Fabrics
The connectivity model between the Nexus Dashboard cluster and the managed fabrics is a critical design decision that directly impacts operational resilience, fault isolation, and scalability. This section describes the two supported connectivity options, their benefits and limitations, and provides recommendations to guide the design choice.
Nexus Dashboard clusters can be connected to the managed fabrics using either of the following options:
| Connectivity Model |
Description |
| Routed Connectivity |
The Nexus Dashboard cluster connects to fabrics through an external routed network, independent of any specific fabric. |
| Direct Connectivity |
The Nexus Dashboard cluster nodes are directly attached to a fabric (e.g., via an ACI EPG or Cisco NX-OS in-band management). |
In a routed connectivity model, the Nexus Dashboard cluster connects to all managed fabrics through an external routed network that is independent of any individual fabric.
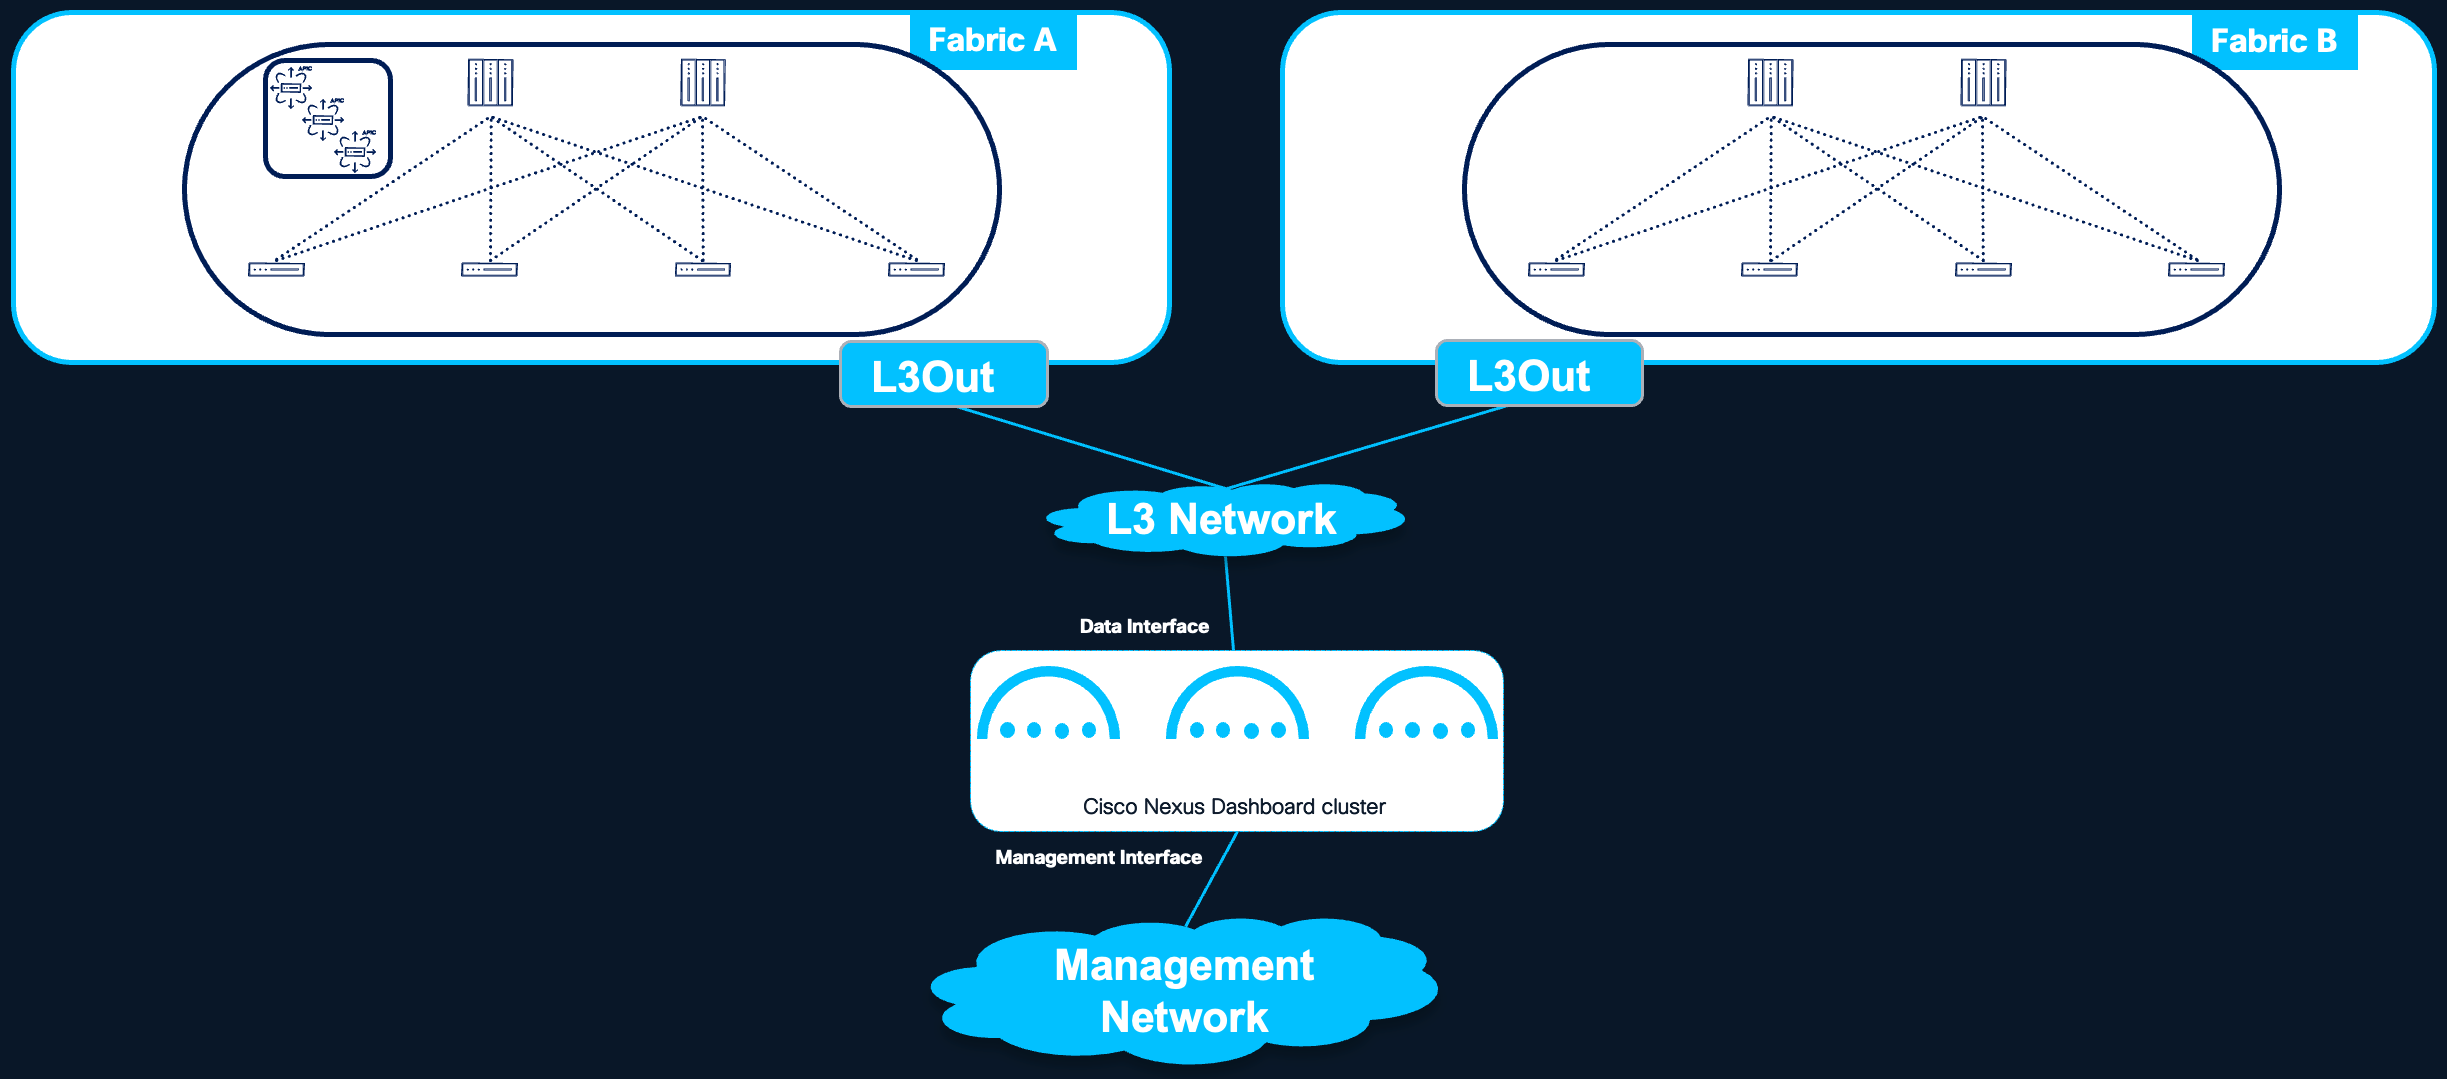
Figure 4 Nexus Dashboard routed connectivity to the fabrics
Benefits
● Fabric Independence: The Nexus Dashboard cluster is not tied to any specific fabric. A failure or misconfiguration within one fabric does not affect the cluster's connectivity to other managed fabrics.
● Fault Isolation: Since the routed network operates independently of the managed fabrics, fabric-level failures or misconfigurations are isolated from the Nexus Dashboard cluster's ability to communicate with other fabrics.
● Simplified Multi-Fabric Management: All fabrics are reachable through the same connectivity infrastructure, simplifying the overall network design when managing multiple fabrics from a single Nexus Dashboard cluster.
Considerations
● Routed Network Reliability: The external routed network becomes a critical dependency for Nexus Dashboard operations. It is essential to plan this network with adequate redundancy, bandwidth, and RTT guarantees to ensure a solid and reliable connection to all managed fabrics.
● Additional Infrastructure: This model requires building and maintaining an external routed network that is independent of the managed fabrics, which may introduce additional infrastructure and operational overhead.
Recommendation: Routed connectivity is the preferred connectivity model when the Nexus Dashboard cluster manages more than one fabric. This design provides the best fault isolation, scalability, and operational flexibility.
For more information, see the Nexus Dashboard and Services Deployment and Upgrade Guide for further guidance on the requirements for this architecture.
In a direct connectivity model, the Nexus Dashboard cluster nodes are physically or logically attached directly to the managed fabric — for example, connected to an ACI Inband EPG. This connectivity model is applicable to ACI fabrics only; for NX-OS fabrics, direct connectivity is not recommended due to the bootstrap dependency described below, and routed connectivity must be used.
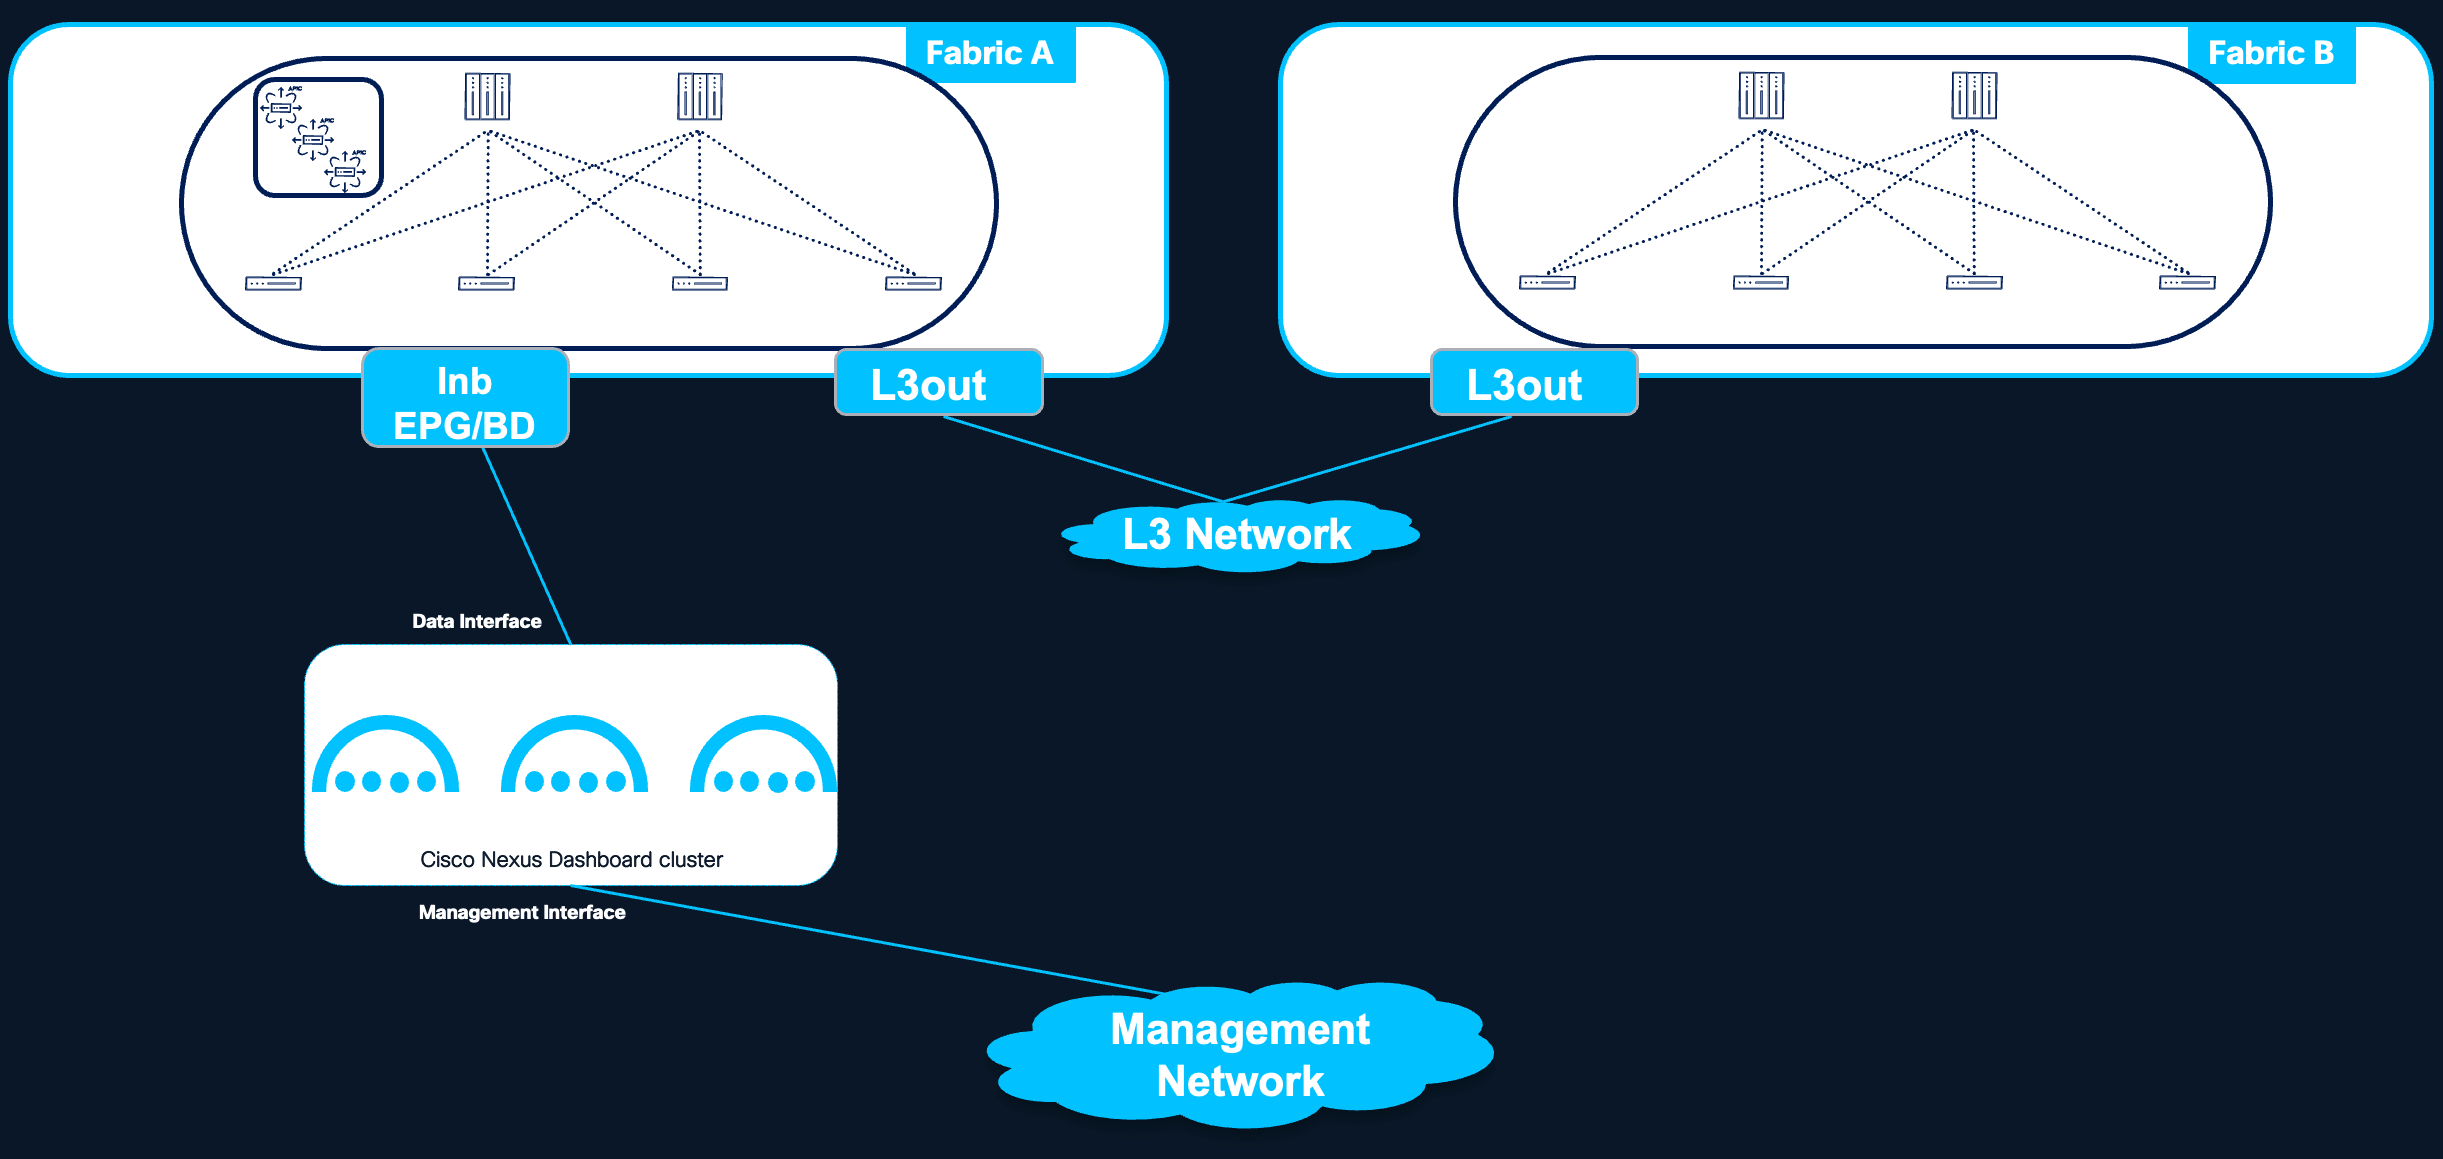
Figure 5 Nexus Dashboard direct connectivity to the fabric
Benefits
● Simplified Design for Single ACI Fabric Deployments: When the Nexus Dashboard cluster is dedicated to managing a single ACI fabric, direct connectivity can simplify the design by eliminating the need to build and maintain a separate external routed network.
● Reduced Infrastructure Overhead: No additional routed network infrastructure is required between the Nexus Dashboard cluster and the fabric.
Limitations
● Fabric Dependency: The Nexus Dashboard cluster's connectivity is tied to a specific fabric. A failure or misconfiguration of that fabric can directly impact the cluster's ability to operate, including its connectivity to other managed fabrics (if any).
● Bootstrap Dependency (Chicken-and-Egg Problem): When the fabric is managed and provisioned by the Nexus Dashboard controller capability itself, a circular dependency arises: the fabric must be operational for the Nexus Dashboard cluster to be reachable, but the Nexus Dashboard cluster must be operational to bring up the fabric. This bootstrap dependency applies to NX-OS fabrics, where Nexus Dashboard is responsible for initial fabric provisioning (e.g., switch bootstrap via POAP, fabric configuration). For this reason, direct connectivity is not recommended for NX-OS fabrics managed by Nexus Dashboard, and routed connectivity must be used. ACI fabrics do not have this dependency, as the APIC cluster bootstraps the fabric independently of Nexus Dashboard; direct connectivity therefore remains a valid design option for ACI deployments.
● Multi-Fabric Connectivity Constraints: When managing multiple fabrics from the same Nexus Dashboard cluster with direct connectivity, the following limitation applies:
◦ Connectivity from the Nexus Dashboard cluster to other fabrics (i.e., fabrics to which the cluster is not directly attached) must use an ACI L3Out.
◦ It is not supported to extend in-band fabric connectivity to the Nexus Dashboard cluster nodes through the VXLAN data plane across IPN (Inter-Pod Network) or ISN (Inter-Site Network) networks.
● Reduced Fault Isolation: Since the cluster depends on the fabric for its own connectivity, fabric-level issues can cascade and affect the Nexus Dashboard cluster's management of all onboarded fabrics.
Direct connectivity is less preferred than routed connectivity for multi-fabric environments due to the fabric dependency and reduced fault isolation described above. Additionally, direct connectivity is only applicable to ACI fabric deployments, as NX-OS fabrics cannot be directly attached to the Nexus Dashboard cluster due to the bootstrap dependency. For single ACI fabric deployments where simplicity is prioritized, direct connectivity can be an appropriate choice.
For detailed requirements and configuration guidance, refer to the Nexus Dashboard and Services Deployment and Upgrade Guide.
The following table summarizes the considerations for both direct and routed connectivity options.
| Criteria |
Routed Connectivity |
Direct Connectivity |
| Recommended for |
Multi-fabric deployments |
Single-fabric deployments |
| Fabric independence |
Yes — cluster is not tied to any fabric |
No — cluster depends on the attached fabric |
| Fault isolation |
High — fabric failures do not affect ND connectivity to other fabrics |
Low — fabric failure can impact ND operations for all fabrics |
| Bootstrap dependency |
None — ND cluster operates independently of fabric state |
Possible — circular dependency if ND provisions the fabric |
| Multi-fabric support |
Native — all fabrics reachable via external routed network |
Limited — requires L3Out or NX-OS external connectivity; VXLAN over IPN/ISN not supported |
| Infrastructure overhead |
Requires external routed network |
No additional network required |
| Operational complexity |
Moderate — external network must be maintained |
Lower for single fabric; higher for multi-fabric |
Centralized vs Distributed Deployments
Nexus Dashboard is a critical component in network management and demands careful consideration for the placement of its cluster nodes to ensure optimal system resiliency. The choice of where to place cluster nodes within the data center environment significantly affects the system's ability to withstand failures and maintain continuous operation.
This section defines the deployment models, discusses their resiliency implications, and provides recommendations for optimal node placement.
Scope of This Chapter
This chapter exclusively addresses Nexus Dashboard cluster deployments within a single logical Data Center. Deploying Nexus Dashboard cluster nodes across multiple geographically dispersed locations outside of a metro area is strongly discouraged and is not considered in this document. Such deployments introduce significant complexity and expose the cluster to inter-site communication failures that can render it unavailable. For guidance on disaster recovery across logical Data Centers, refer to the Disaster Recovery Consideration section.
Defining a Logical Data Center
In the context of Cisco Nexus Dashboard deployments, a logical Data Center (DC) is defined as:
● One or multiple rooms within a single physical data center facility, or one or multiple buildings within a metro area, representing a geographically localized cluster of data center sites.
● A logical Data Center is operated as single DC (even if built with multiple fabrics).
● A logical Data Center may contain one or more network fabrics, fabric pods, or availability zones that are interconnected with low-latency, high-bandwidth links.
For simplicity, the term Data Center (DC) in the following sections refers to this logical Data Center definition.
Deployment Models
Within a single logical Data Center, two primary Nexus Dashboard deployment models are considered:
| Model |
Description |
| Centralized Deployment |
All cluster nodes are located within a single fabric or fabric pod in the logical Data Center. |
| Distributed Deployment |
Cluster nodes are spread across different rooms, pods, or fabrics within the same logical Data Center. |
Centralized Deployment
In a centralized deployment, all nodes in a Nexus Dashboard cluster reside within the same fabric or fabric pod inside the logical Data Center.
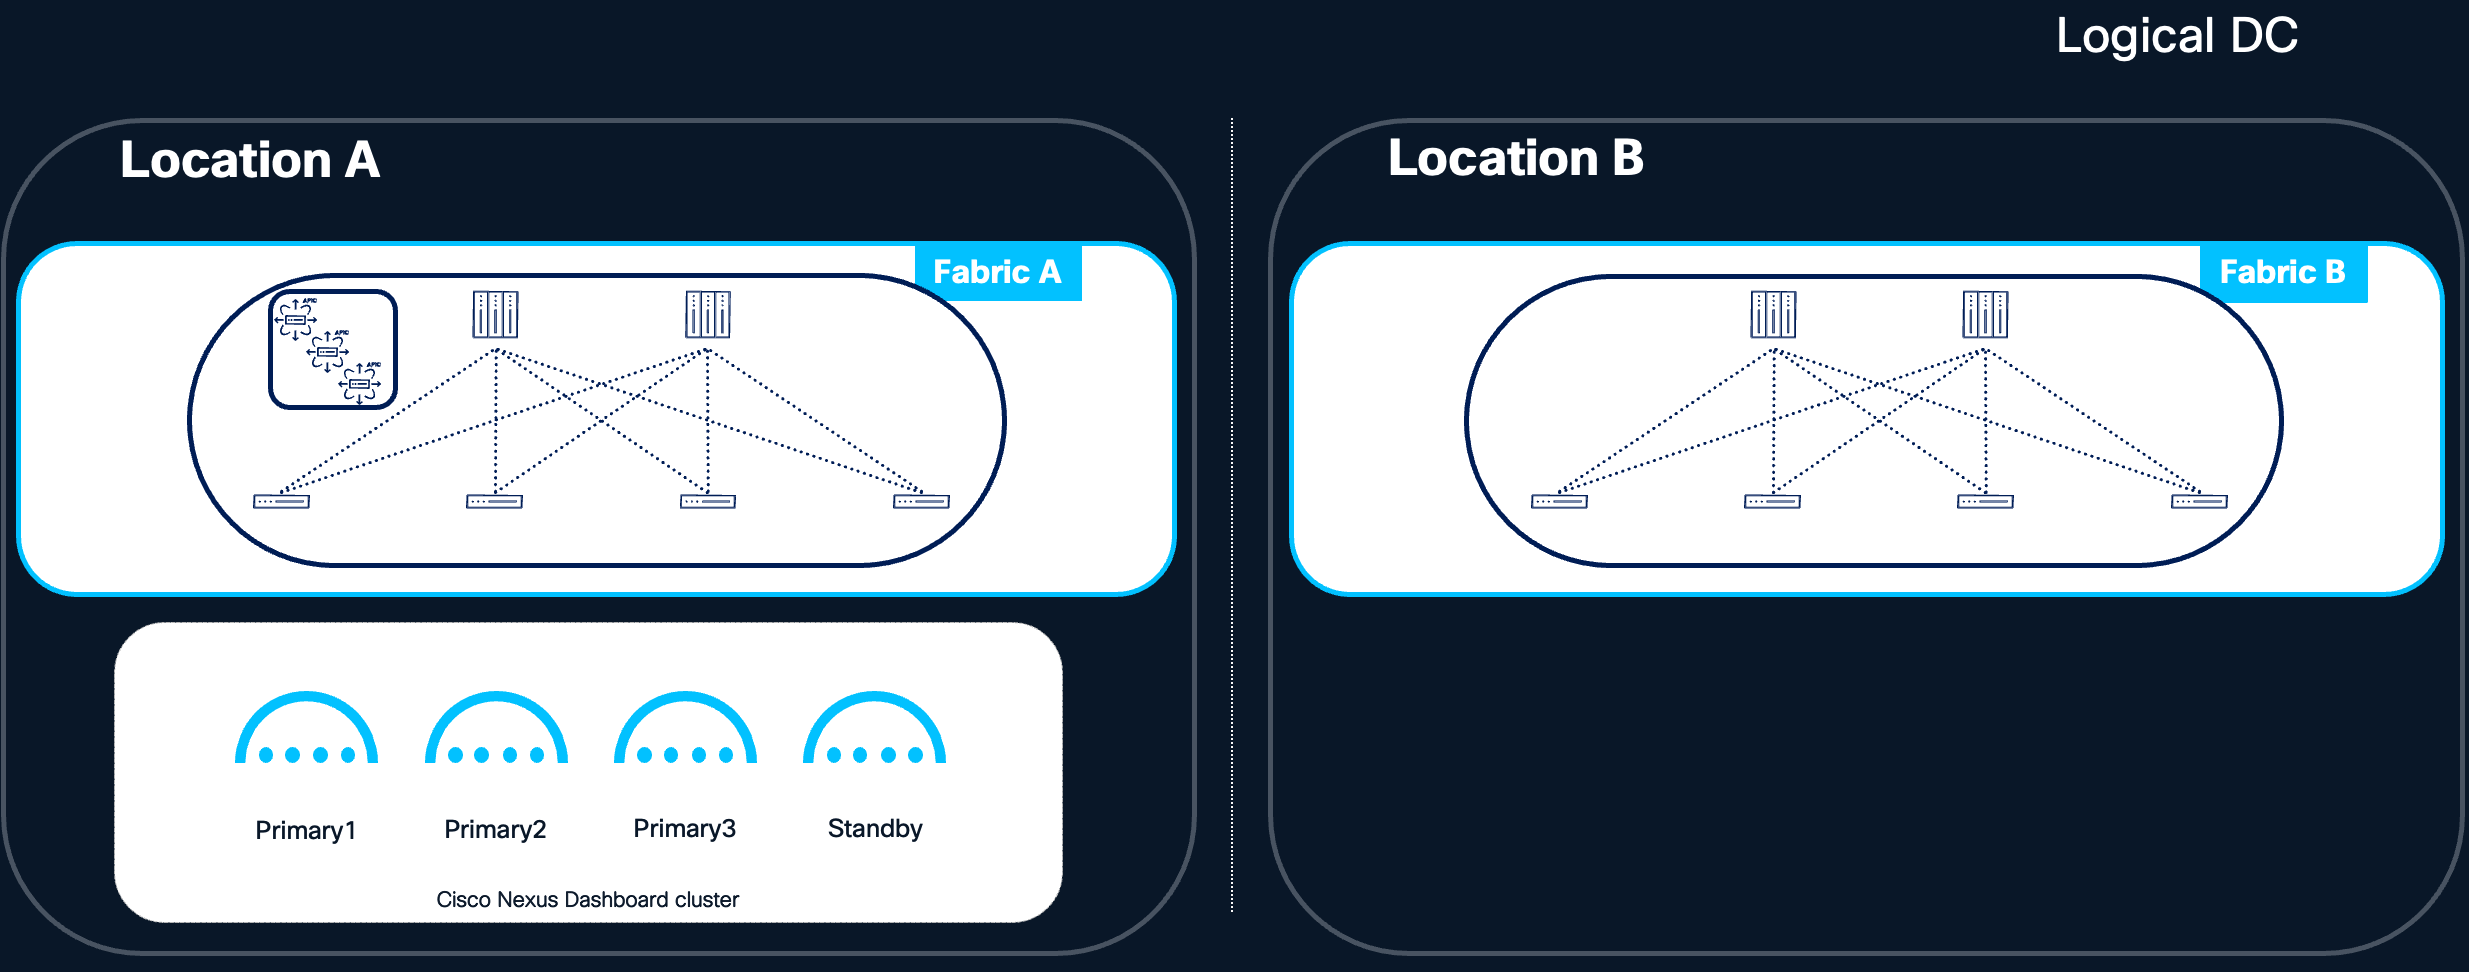
Figure 6 Nexus Dashboard cluster located in the same Availability Zone
Benefits:
● Low Latency Communication: Nodes within the same logical Data Center benefit from reduced communication latency, enabling rapid data exchange. The round-trip time (RTT) between nodes typically ranges from 50ms to 150ms, depending on the software version. Detailed latency requirements are documented in the Nexus Dashboard and Services Deployment and Upgrade Guide.
● Predictable telemetry Flows: Telemetry data from both local and remote fabrics is streamed to a single centralized location, simplifying traffic predictability and capacity planning.
● Simplified Network Topology: Communication within a single logical Data Center is generally less complex, reducing potential points of failure and easing network management for the Nexus Dashboard cluster.
● No Cross-Fabric Dependencies: The Nexus Dashboard cluster has no dependency on inter-fabric or inter-pod connectivity for its own internal operation, isolating it from failures in other parts of the network.
Limitations:
● Single Point of Exposure: All Nexus Dashboard nodes are subject to the same fabric or pod-level risks. A catastrophic failure affecting that specific fabric or pod could impact all cluster nodes simultaneously.
● Limited Availability Zone Diversity: If the fabric or pod resides in a single physical room or rack group, hardware-level failures (e.g., power, cooling) could affect multiple nodes.
Centralized Deployment Recommendation:
A centralized deployment is the simplest and most operationally efficient model. It is the recommended starting point for most deployments, as it eliminates cross-fabric or cross-pod dependencies for the Nexus Dashboard cluster's internal operation.
Recommendation: Since the loss of two primary nodes cannot be tolerated, restore a single failed primary node as soon as possible to minimize the risk of data loss. For physical form factor-based clusters, we strongly recommend using a standby node to accelerate failover. The alternative—requesting a Return Material Authorization (RMA) for the faulty node—is more time-consuming and extends the period of degraded services and reduced high availability.
Centralized Deployment with Cold Standby Cluster
For deployments that prioritize the simplicity of a centralized model but also require strict disaster recovery guarantees, a centralized Nexus Dashboard cluster can be combined with a cold standby cluster deployed in a different logical Data Center. In this design, the active Nexus Dashboard cluster is deployed in a centralized fashion within the primary logical Data Center, following all the operational benefits described in the Centralized Deployment section. A second Nexus Dashboard cluster — the cold standby — is pre-provisioned in a geographically separate logical Data Center and remains inactive during normal operations.
The cold standby cluster is intended to be activated only in the event of a catastrophic failure of the primary cluster, such as the loss of the entire logical Data Center hosting the active cluster. Upon activation, the standby cluster is brought online by restoring the most recent backup of the primary cluster onto it, following the procedures described in the Disaster Recovery Consideration section.
Requirements for the cold standby cluster (as previously noted in the Standby Cluster for Disaster Recovery section):
● Connectivity to all fabrics onboarded on the active cluster.
● Compliance with the RTT requirements for all managed fabrics.
● Same form factor and size as the active cluster to allow for a successful backup restoration.
Key design characteristics:
● Recovery Time Objective (RTO): Because the standby cluster is cold (inactive), activation requires time to restore the backup and, depending on the fabric type, re-establish telemetry connectivity (see Telemetry Restoration After Backup Restore). Organizations adopting this design should size their RTO expectations accordingly.
● Recovery Point Objective (RPO): The freshness of the restored cluster depends directly on the frequency of backups. Automated backup scheduling with geographically diverse backup storage is essential.
● Operational simplicity during steady state: The active cluster benefits from the simplicity of centralized deployment, while the standby cluster requires no active management beyond periodic verification of its readiness (e.g., network connectivity, backup accessibility, software version alignment).
● Cost consideration: This design requires provisioning a second Nexus Dashboard cluster that remains unused during normal operations, which has a direct cost implication in terms of hardware or virtual resources. However, it offers a significantly stronger disaster recovery posture compared to a single centralized cluster relying solely on backup restoration onto a newly built cluster.
This design is particularly well-suited for environments where:
● Three or more independent availability zones within the same logical Data Center are not available, making a distributed deployment impractical (see Centralized vs Distributed Deployments).
● Disaster recovery SLAs require faster recovery than a full re-deployment of a new cluster would allow.
● Operational simplicity of the active cluster is a priority.
Note: The standby cluster in this design is a distinct concept from the standby nodes discussed in the Standby Nodes and Node Replacement section. Standby nodes are individual nodes within a single cluster intended to replace failed primary nodes; a standby cluster is an entirely separate Nexus Dashboard cluster intended to replace the primary cluster in a disaster scenario.
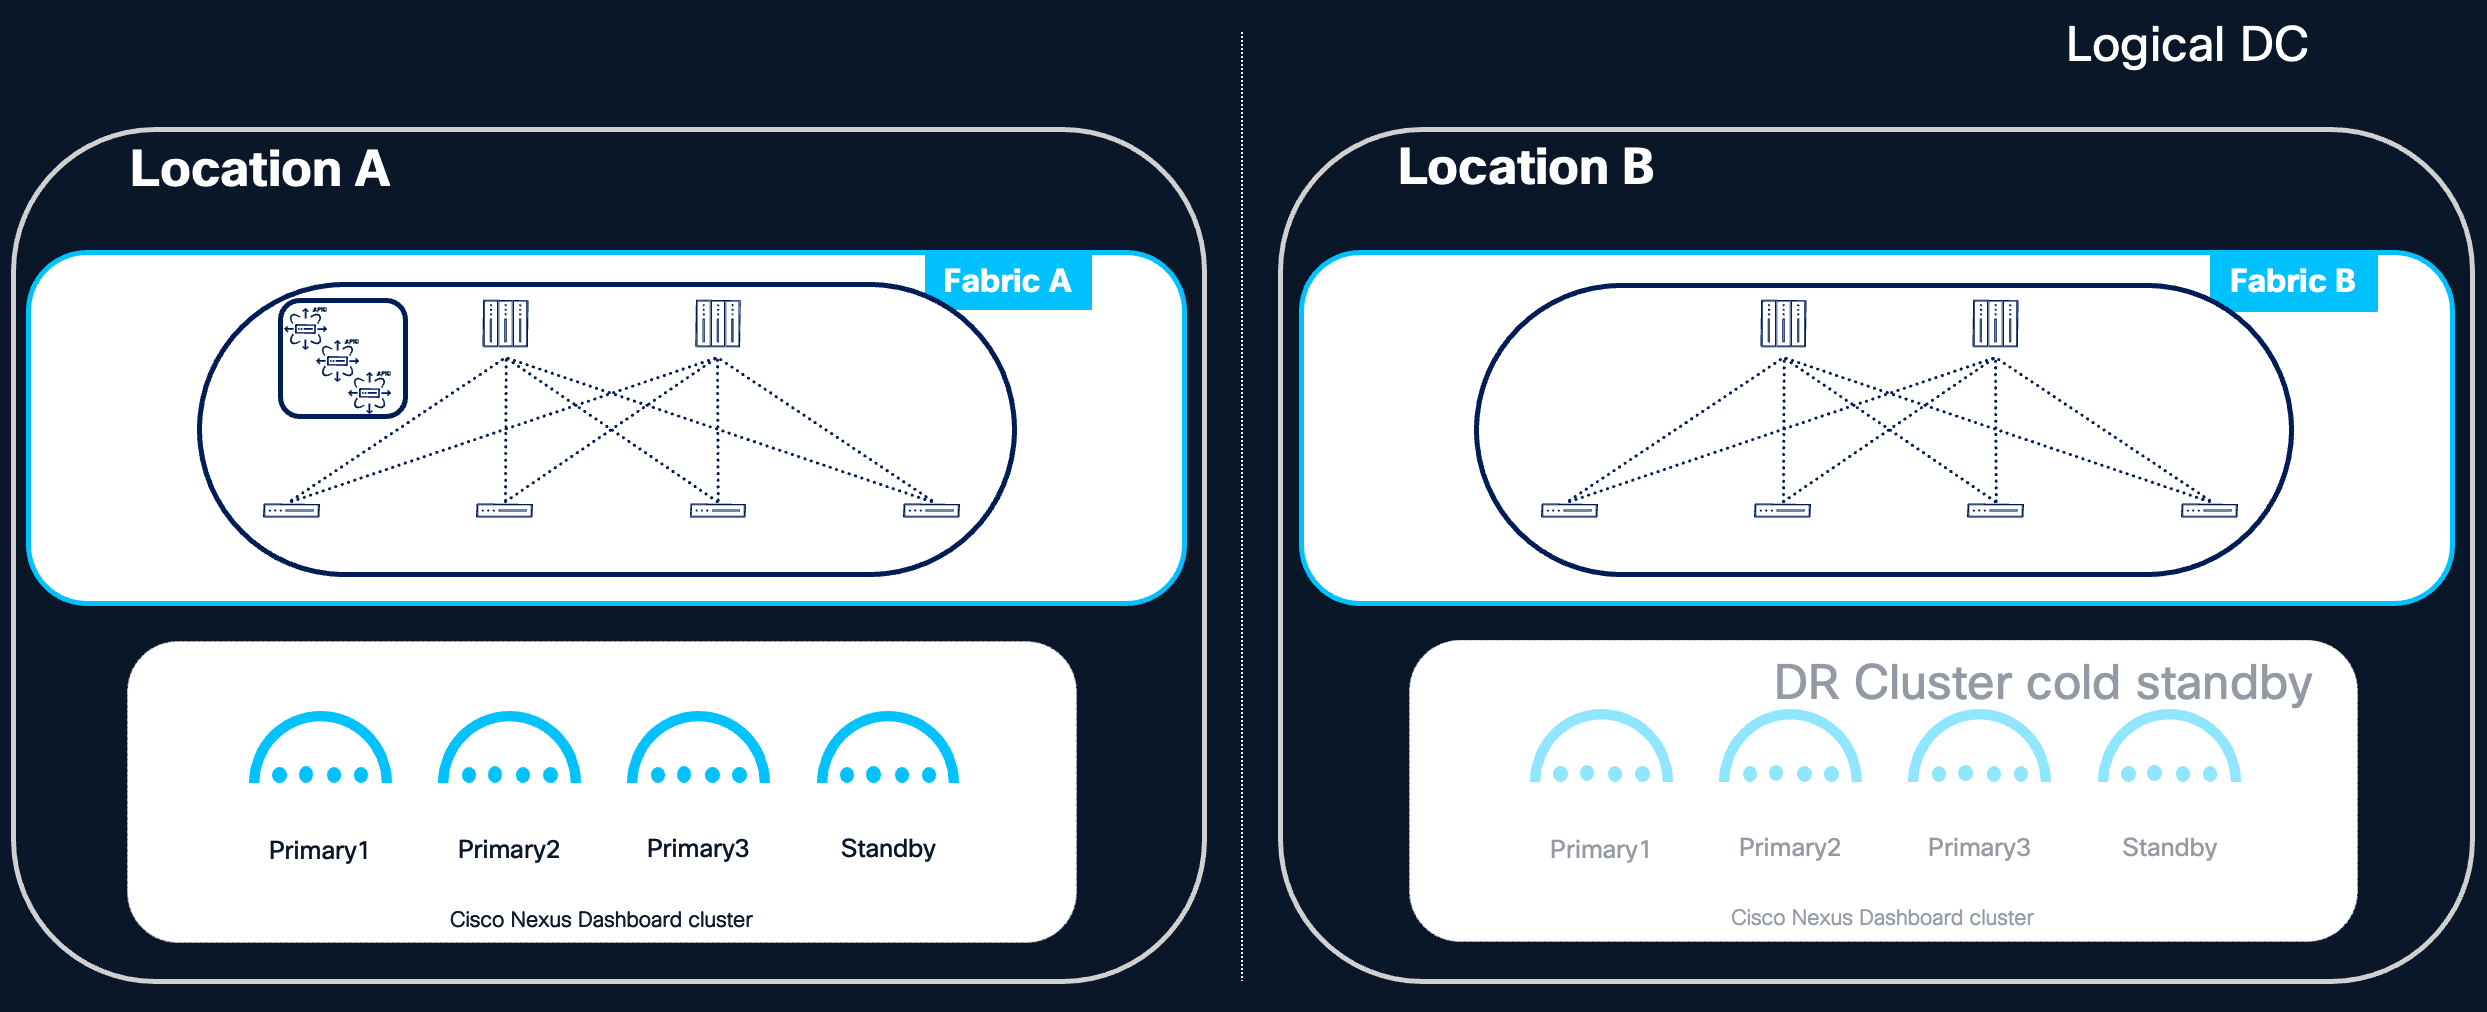
Figure 7 Centralized ND design with cold standby cluster
In a distributed deployment, Nexus Dashboard cluster nodes are placed across different rooms, pods, or fabrics within the same logical Data Center. This model aims to increase resilience by ensuring that a localized failure within the logical DC does not affect all cluster nodes simultaneously.
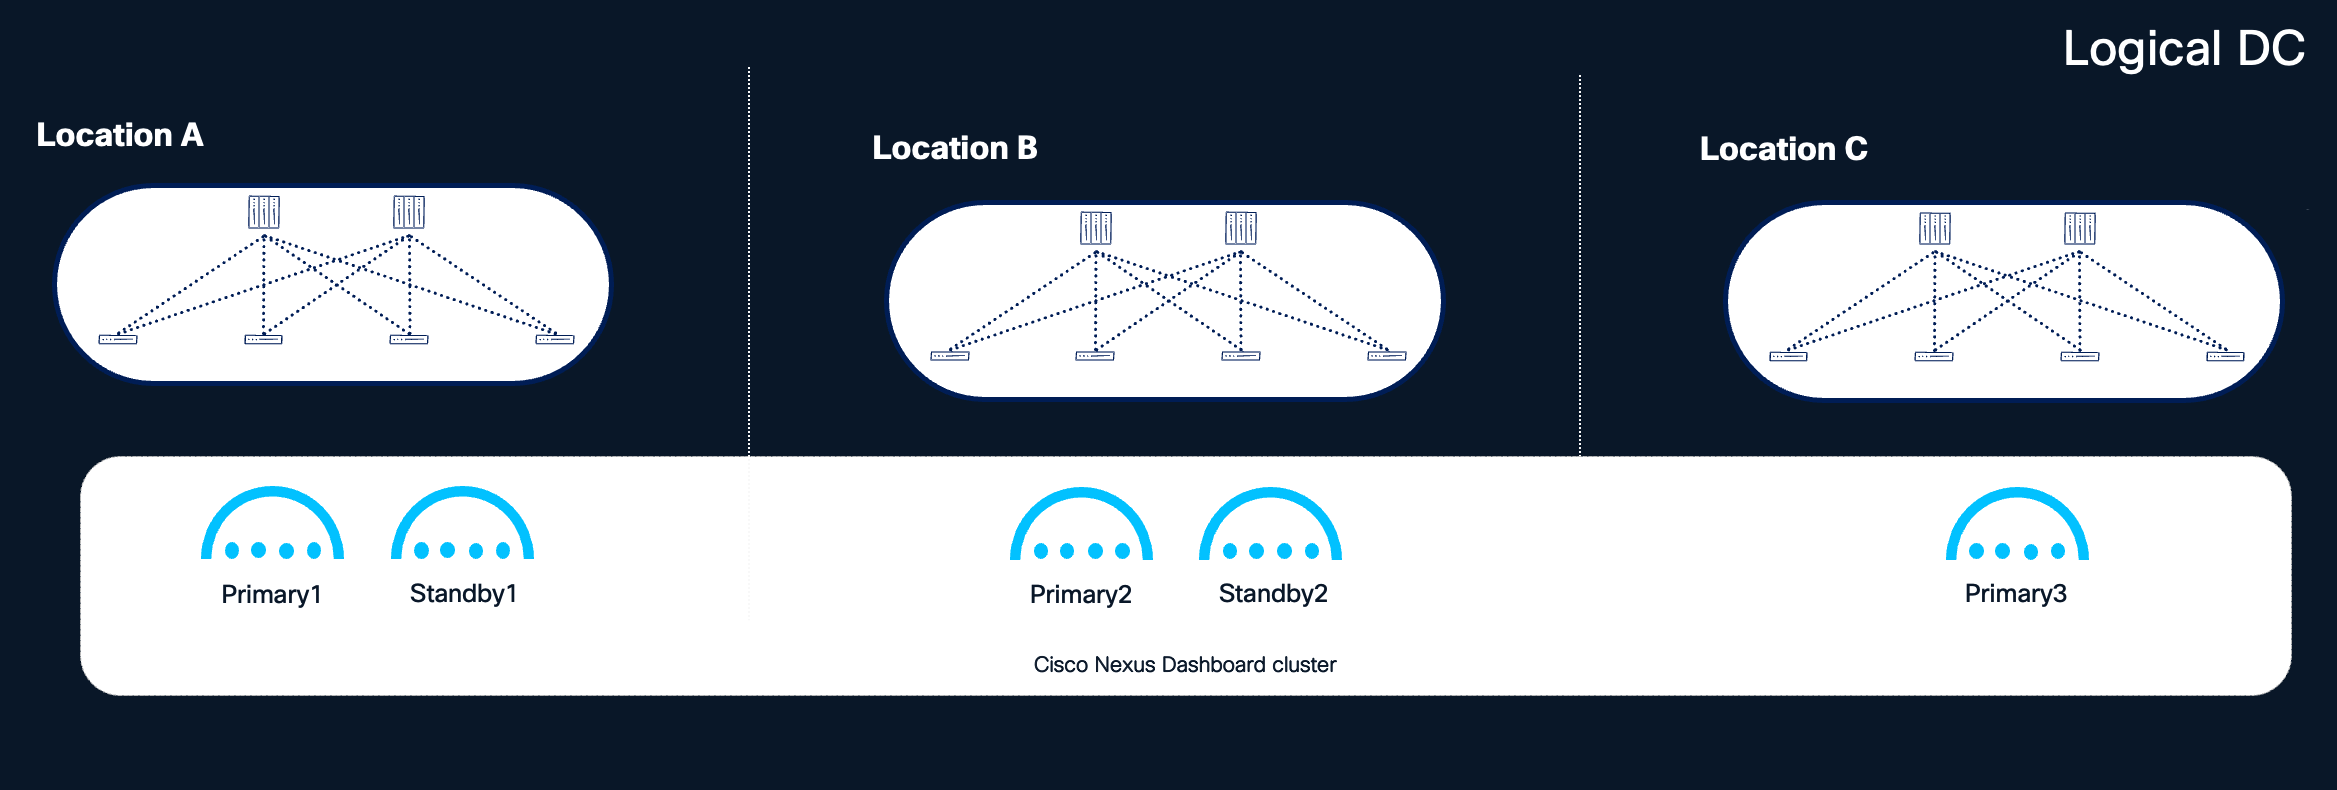
Figure 8 Nexus Dashboard clusters distributed in different locations within the same logical DC
Benefits:
● Increased Availability Zone Diversity: By placing each primary node in a different room, pod, or fabric within the logical DC, the loss of a single availability zone results in the loss of only one primary node, a failure that the cluster can tolerate and recover from.
● Improved Disaster Tolerance Within the Logical DC: Localized events such as power failures, cooling issues, or network outages affecting a single room or pod do not compromise the entire cluster.
Considerations:
● Minimum 3 locations are needed: Distributing Nexus Dashboard cluster nodes across multiple locations is only beneficial when at least three independent locations (availability zones) are available within the logical Data Center. This is because the Nexus Dashboard cluster can tolerate the loss of only a single primary node; with only two locations, any distribution of the three primary nodes will place two nodes in one location and one in the other. The loss of the location hosting two primary nodes would render the cluster unavailable and unrecoverable without a full backup restore. As a result, a two-location distributed deployment does not provide any high availability benefit over a centralized deployment and is therefore not recommended.
● Network Configuration Complexity: Managing communication between nodes across different rooms, pods, or fabrics requires careful network planning to ensure consistent low-latency connectivity between all cluster nodes.
● L2 Adjacency Requirement: Deployments using Layer 2 (L2) adjacency for the data network require stretching the L2 data network across all locations where cluster nodes reside within the logical DC.
● L3 Mode Considerations: Deployments using Layer 3 (L3) mode allow different subnets for each cluster node's data interface. When nodes are placed in different locations under L3 mode, routed connectivity across these L3 subnets is mandatory —check also BGP requirements below.
● RTT Requirements: Ensure that the round-trip time between all cluster nodes remains within the supported range, even when nodes are distributed across different locations within the logical DC. The Round Trip Time (RTT) required for ND inter-node connectivity is 50ms. Refer to the Nexus Dashboard and Services Deployment and Upgrade Guide for more details on RTT requirements.
BGP Requirements for L3 Mode (Nexus Dashboard 4.1+):
Starting with Nexus Dashboard 4.1, if network connectivity for Nexus Dashboard is configured to Layer 3, Border Gateway Protocol (BGP) must be enabled on the Nexus Dashboard nodes for the data interface to advertise persistent IP host routes. BGP configuration is required during cluster bootstrap.
Key BGP configuration considerations include:
● The BGP implementation in Nexus Dashboard supports single-hop peering only (TTL = 1). Multi-hop BGP is not supported. As a consequence, each BGP peer must reside in the same IP subnet as the Nexus Dashboard node's data interface, and the directly connected gateway must be defined as the eBGP peer.
● Each Nexus Dashboard node can be configured as a separate AS, or all nodes can share a single AS.
● Each Nexus Dashboard node can peer with one or two peers via IPv4 or IPv6.
● When BGP is configured, persistent IPs must reside in an IP subnet that does not overlap with any Nexus Dashboard node's local IP address. Check Nexus Dashboard Deployment and Upgrade Guide for more details about persistent IP.
When to Consider a Distributed Deployment:
A distributed deployment within the same logical DC is recommended when three or more independent availability zones (e.g., separate rooms, pods, or fabrics within the same logical DC) are available. Distributing primary nodes across these zones provides additional redundancy: the loss of an entire availability zone results in only a single cluster node loss, which the cluster can tolerate and recover from.
Standby node placement recommendations based on availability zone count:
| Availability Zones |
Recommended Standby Configuration |
| 3 AZs |
Place two standby nodes, one in each of the two AZs not hosting the third primary node alongside another primary. This ensures that even in the event of an AZ loss, a standby node remains available for rapid failover. |
| 4 or more AZs |
Place a single standby node in an AZ that does not host any other cluster node. This provides optimal redundancy with minimal resource overhead. |

Figure 9 Recommended distribution of nodes with 3 or more locations available
Note: The above recommendations assume that each availability zone is independent from the others, and that a disaster affects only one availability zone at any given time. Under this assumption, even with the loss of an entire availability zone, it is possible to recover the Nexus Dashboard cluster by promoting a standby node.
Note: One of the availability zones (e.g., Location C in the figure above) could serve as a shared site dedicated to hosting quorum nodes for all clustered applications, minimizing the infrastructure footprint required for redundancy.
The Cisco Nexus Dashboard platform is engineered for resilience, designed to maintain service availability despite node failures. Specifically, the platform can tolerate:
● The loss of a single primary node.
● The loss of all secondary nodes.
● The simultaneous loss of a single primary node and all secondary nodes.
This tolerance refers to the system's ability to restore cluster functionality by recovering or replacing failed nodes. However, until full restoration is achieved, system performance and service availability may be temporarily impacted.
Impact of Node Failures
When a single primary or one or multiple secondary nodes fail, the cluster may experience transient impacts as services rebalance workloads across remaining nodes. During this rebalancing period, you may observe:
● Temporary unresponsiveness or unexpected messages in the User Interface.
● Temporary loss of ingested data from switches, fabric controllers, and integrated platforms until services are redistributed.
● Failure of certain dynamic jobs, such as assurance collection, bug scans, and user-triggered tasks.
Primary Node Failure
When a primary node fails, the cluster operates in a degraded state until the node is restored. With reduced resources, some dynamic jobs—such as connectivity analysis, bug scans, and pre-change validation—may fail or experience delays.
Secondary Node Failure
Secondary node failures generally do not cause significant service degradation. However, if the cluster is operating near maximum capacity, performance and data collection may be adversely affected.
Recommendation: Restore failed nodes promptly, whether primary or secondary. Avoid running dynamic jobs in Nexus Dashboard until the cluster is fully restored to its intended size.
Critical Failure Conditions
The failure of two or more primary cluster nodes renders the system unavailable and unrecoverable through normal means. In such cases, the entire cluster must be restored using the unified backup and restore procedure provided by Nexus Dashboard. This procedure simultaneously restores the platform—including its cluster deployment configuration—and all running services. Detailed information on this capability is available in the Nexus Dashboard User Content documentation.
Recommendation: Regularly back up your platform and services. Nexus Dashboard supports automated backup scheduling, which is strongly recommended. Store backup files in multiple geographically diverse locations to ensure availability for cluster restoration when needed.
Note: The Nexus Dashboard restoration procedure requires that the target cluster has the same or greater resources than the original cluster (i.e. same cluster size and format). To improve restoration time following an ND cluster failure, ensure that adequate resources are pre-provisioned and available.
Telemetry Restoration After Backup Restore
After restoring a Nexus Dashboard cluster from backup, two aspects of telemetry must be considered: the restoration of operational (historical) telemetry data, and the re-establishment of telemetry connectivity between the managed switches and the restored cluster.
Operational Data Restoration
The behavior of operational telemetry data during backup and restore depends on the Nexus Dashboard software version:
● Prior to Nexus Dashboard 4.2.1: Only the telemetry feature configuration is included in the backup. Historical telemetry and analysis data (such as anomalies, advisories, and flow records) are not preserved across a restore. Following the restoration, telemetry starts collecting fresh data from the moment connectivity to the switches is re-established.
● Starting with Nexus Dashboard 4.2.1: Operational telemetry data can optionally be backed up and restored in addition to the feature configuration. During the restore process, the operational data is aggregated from 5-minute granularity to 3-hour granularity, resulting in reduced resolution of historical telemetry compared to the original data set. For more details, refer to Backing UP and Restoring Telemetry Operational Data.
Telemetry Connectivity Re-Establishment
In addition to operational data considerations, it may be necessary to re-establish telemetry connectivity between the managed switches and the restored Nexus Dashboard cluster. Whether this step is required depends on the fabric type and the persistent IP addresses of the restored cluster.
NX-OS Fabrics
For NX-OS fabrics, telemetry re-configuration is always required after a backup restore, regardless of whether the restored cluster retains the same persistent IP addresses as the original. This is due to how telemetry configuration is applied to NX-OS switches: the existing telemetry configuration must be cleared and re-pushed by the restored Nexus Dashboard cluster to re-establish the streaming relationship between the switches and the cluster. Plan for this step in every NX-OS disaster recovery scenario.
ACI Fabrics
For ACI fabrics, telemetry re-configuration is typically not required when the restored Nexus Dashboard cluster retains the same persistent IP addresses that were previously used. In this case, the leaf switches continue streaming telemetry data to the same destination IPs, and no configuration change is needed on the fabric side.
However, telemetry re-configuration is required for ACI fabrics when the restored Nexus Dashboard cluster uses different persistent IP addresses than the original cluster. This typically occurs in disaster recovery scenarios where the cluster is restored in a different logical Data Center, on a different IP subnet, or when the persistent IP pool has been modified. In this case, the ACI fabric must be reconfigured to stream telemetry to the new persistent IP addresses of the restored cluster.
Re-Configuration Process
When telemetry re-configuration is required (always for NX-OS, conditionally for ACI), the process involves:
● Removing the existing telemetry configuration from the managed switches or fabric.
● Re-pushing the updated telemetry configuration from the restored Nexus Dashboard cluster.
Nexus Dashboard will prompt you to approve this procedure, which is then fully automated and executed by Nexus Dashboard itself. This step ensures that the switches are properly re-aligned with the restored cluster and can resume streaming telemetry data to the correct persistent IP addresses. Until this process is completed, telemetry data ingestion from the affected fabrics may be interrupted.
Recommendation: Plan for this additional post-restoration step when defining your disaster recovery procedures and SLAs. For NX-OS fabrics, always include telemetry re-configuration in the recovery runbook, as it is required regardless of the restored cluster's IP configuration. For ACI fabrics, include telemetry re-configuration in recovery scenarios where the restored cluster will use different persistent IP addresses than the original. The telemetry re-configuration process may cause a brief disruption to telemetry data ingestion as the fabric-side configuration is cleared and re-applied. No fabric data plane impact is expected during this operation — switches continue to forward production traffic normally. Only the telemetry control plane between the fabric and the Nexus Dashboard cluster is temporarily affected.
Orchestrator-Specific Consideration
If the failed cluster had orchestration capabilities enabled, an additional limitation applies: the Nexus Dashboard backup cannot restore the orchestration capability if any of the managed fabric sites (e.g., an APIC cluster) is unreachable. This means that disaster recovery scenarios involving the simultaneous loss of the Nexus Dashboard cluster and one or more APIC clusters are not currently supported for the orchestration capability. Other capabilities, i.e. controller and telemetry, can be restored.
To mitigate this risk, consider distributing Nexus Dashboard nodes across multiple availability zones (i.e. different rooms or sites in a metro area) within the same logical data center, where feasible. Refer to the Centralized vs Distributed Deployments section for further guidance.
Note: If the failed cluster is part of a federation, additional recovery considerations apply depending on whether the cluster is the federation primary or a secondary. See Multi-Cluster Federation and High Availability.
Disaster Recovery Consideration
In the event of a disaster—such as the loss of an entire Nexus Dashboard cluster as a consequence of a logical Data Center failure—the following considerations apply. Note that this is the only scenario in this document where recovery involves a different logical Data Center, and it is addressed strictly as a post-failure restoration procedure, not as a deployment model.
Backup and Restoration
● A backup of the platform and all services is required for restoration of the cluster.
● Store backups frequently in multiple geographical locations to ensure availability.
● The cluster can be restored from backup, provided that another Nexus Dashboard cluster is available. The recommendation is to restore the backup into a cluster with the same form factor and size as the failed one.
Capability-Specific Restoration Limitations
| Capability |
Limitation |
| Orchestration |
Orchestration (ACI Multi-site) feature cannot be restored unless all managed sites are reachable. |
| Telemetry |
Prior to Nexus Dashboard 4.2.1, telemetry backup could restore service configuration only—historical telemetry and analysis data could not be restored. Starting with Nexus Dashboard 4.2.1, it is possible to back up and restore telemetry operational data in addition to service configuration. However, during the restore process, the operational data is aggregated from 5-minute granularity to 3-hour granularity, resulting in reduced resolution of historical telemetry and analysis data compared to the original. For more details, refer to Backing Up and Restoring Telemetry Operational Data |
Standby Cluster for Disaster Recovery
Recommendation: If disaster recovery scenarios require a strict SLA, maintain a standby Nexus Dashboard cluster in a different logical Data Center from the primary cluster. This standby cluster must:
● Have connectivity to all fabrics onboarded on the active cluster.
● Meet the RTT requirements for all managed fabrics.
● Be of the same form factor and size as the active cluster.
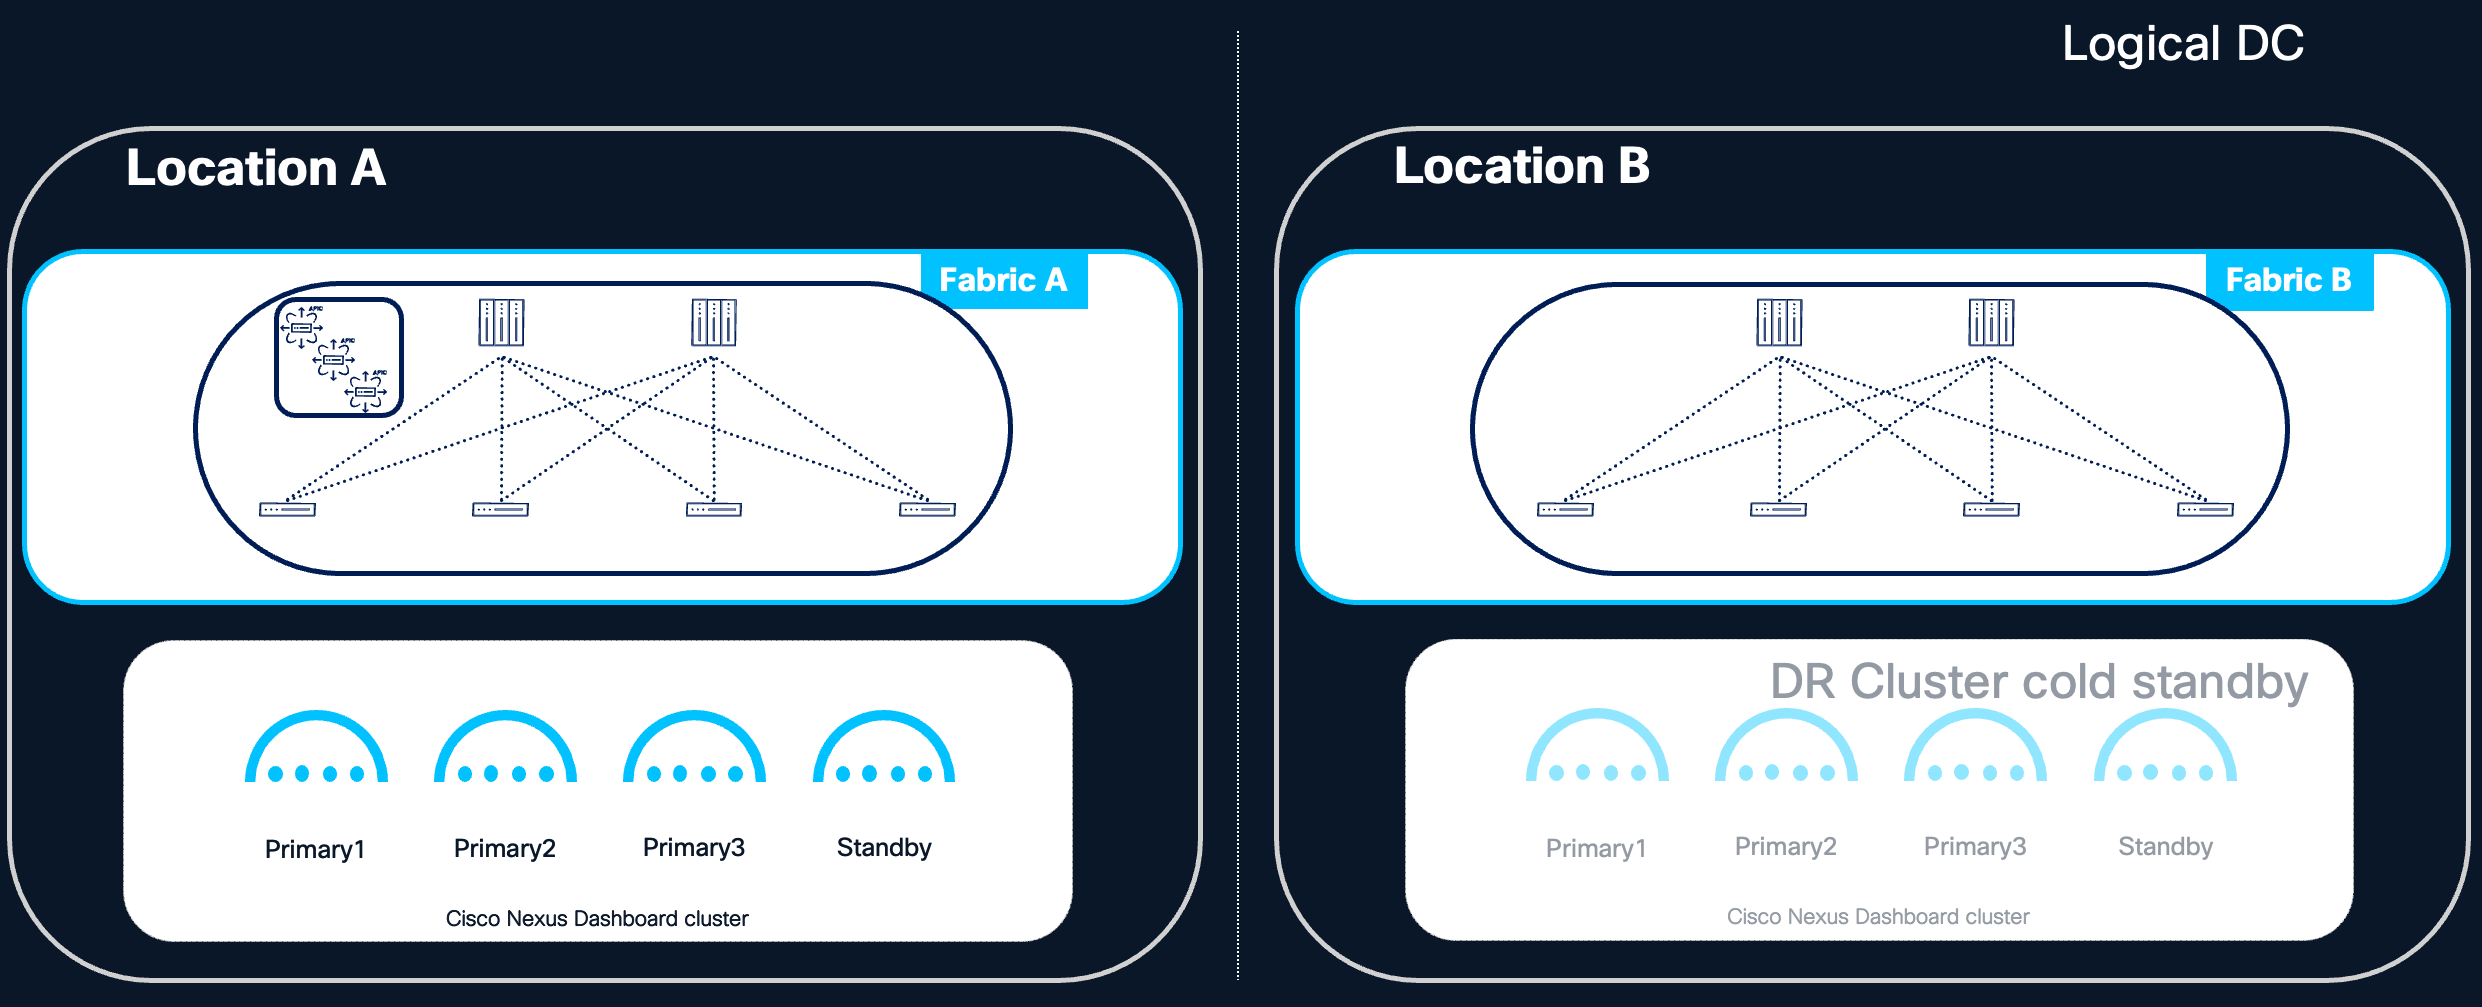
Figure 10 Active and standby Cluster for DR design
Note: For federated Nexus Dashboard deployments, additional considerations apply to backup and restoration. In particular, the cluster name must match the original when restoring from backup to ensure the cluster can rejoin the federation. See Multi-Cluster Federation and High Availability for details.
Standby Nodes and Node Replacement
Refer to the Scale of Primary, Secondary and Standy Nodes for more information about standby nodes.
The figure below shows the selection of Type (Standby) when adding a new node.
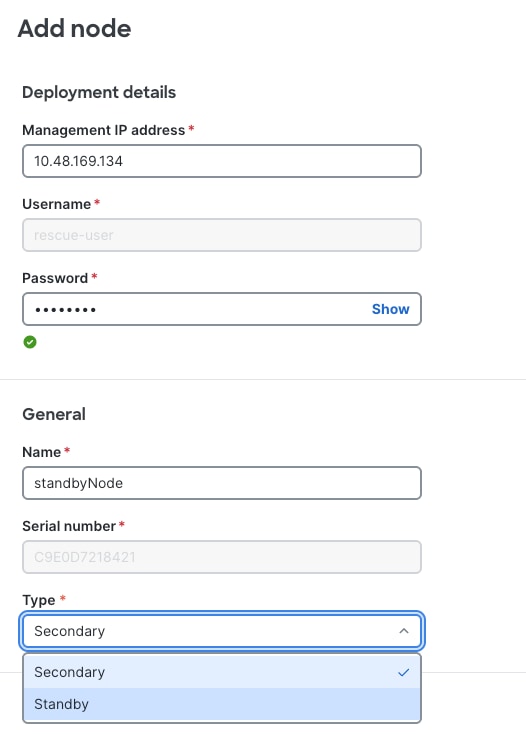
Figure 11 Nexus Dashboard UI shows how to add a new cluster node of type Standby
Failover of a Primary Node
If a primary node fails and a standby node is available, failover can be performed quickly via the Nexus Dashboard UI. Having a standby node provides significant benefits:
● Ensures spare resources are immediately available.
● The standby node is already running the correct software version.
● Eliminates the need to wait for hardware replacement (RMA), which is especially valuable for physical ND cluster nodes.
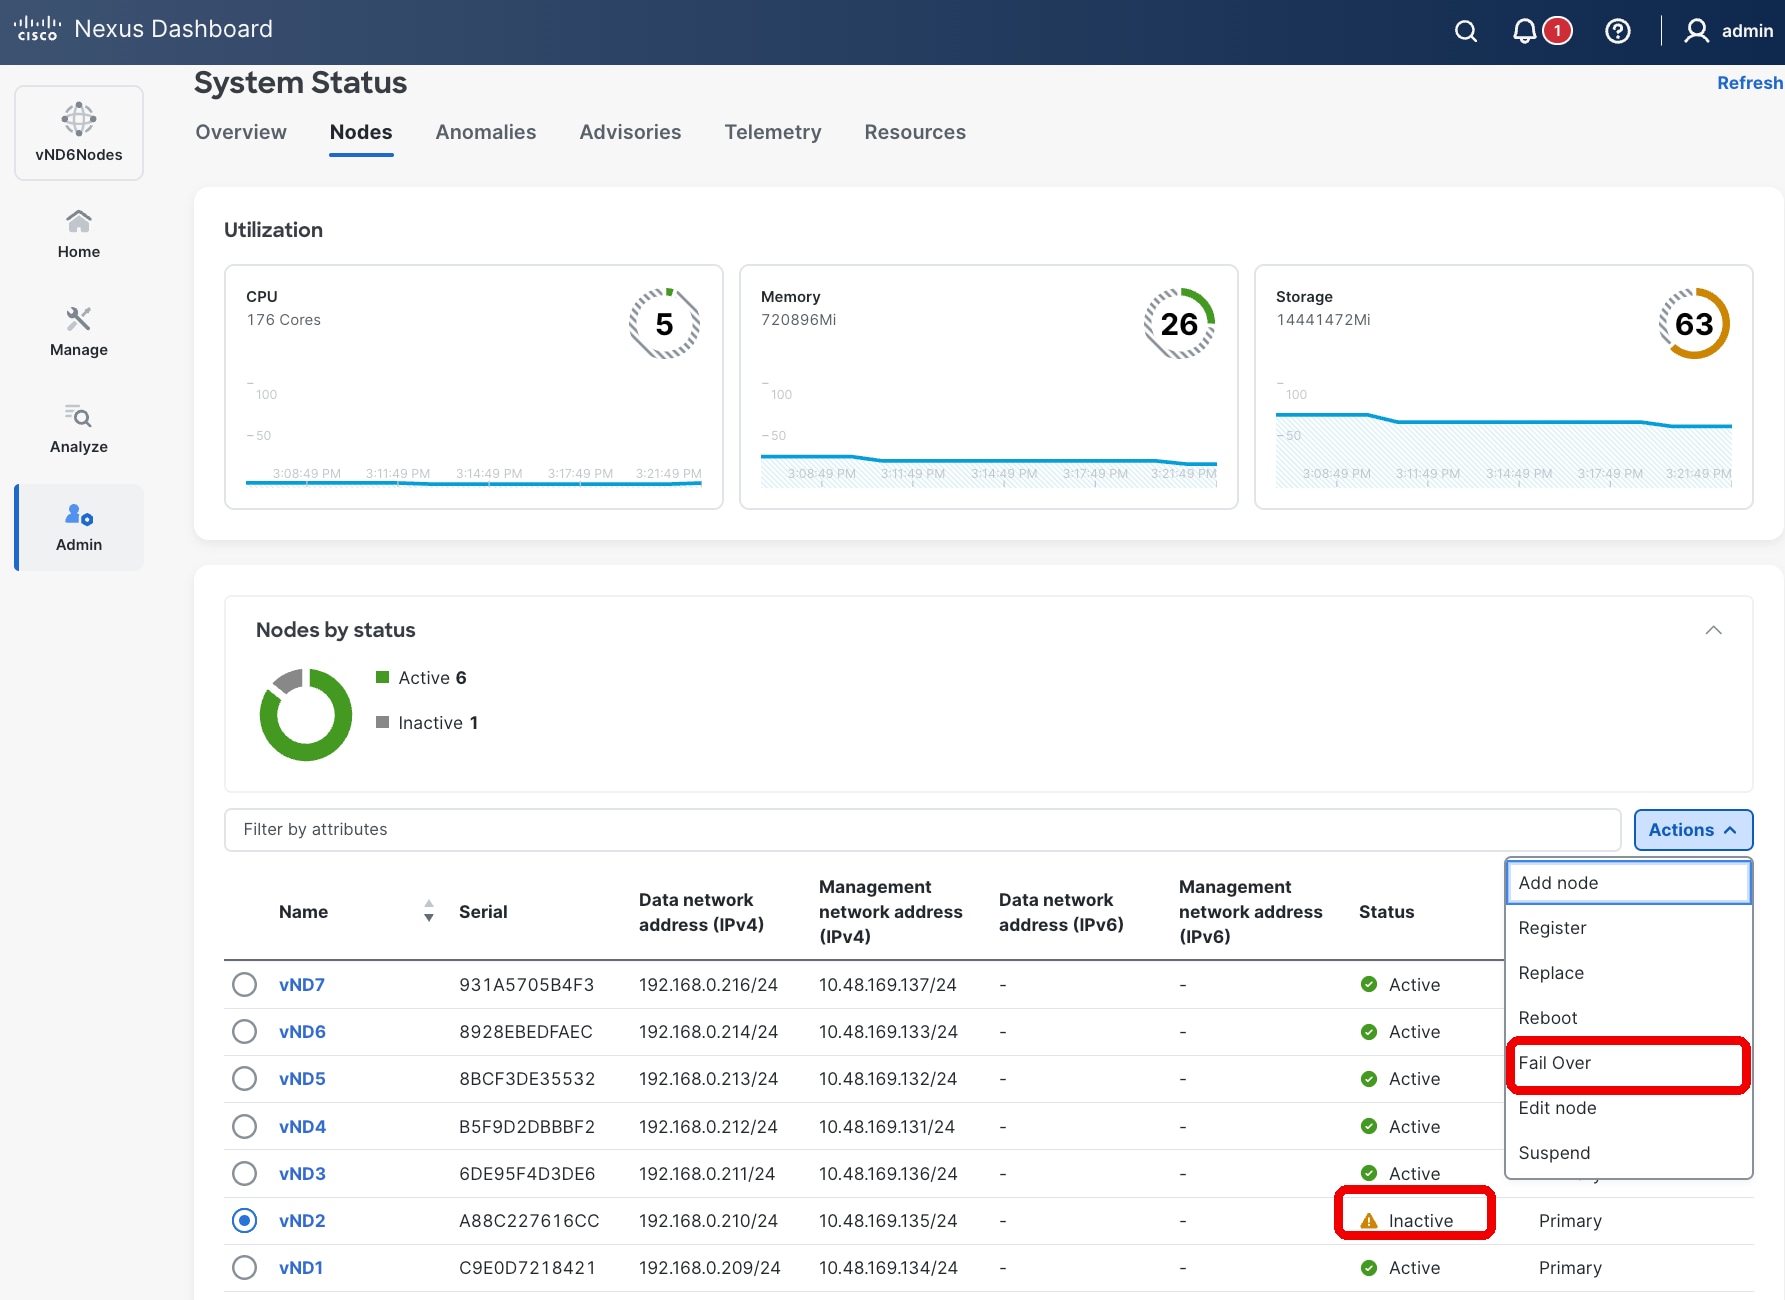
Figure 12 Nexus Dashboard UI showing how to fail over or replace a failed primary node
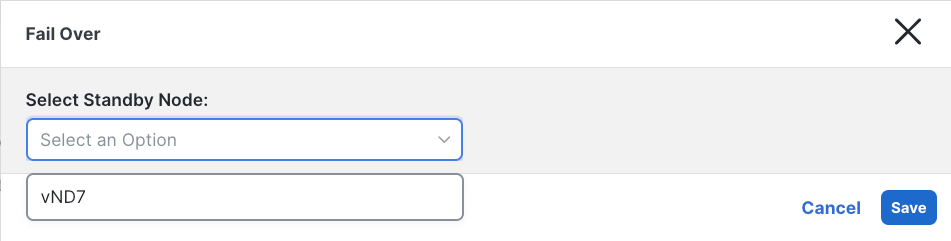
Figure 13 Primary failed node Fail Over
Replacing a Primary Node (Without Standby)
If no standby node is available, a failed primary node can be replaced with a greenfield node running the same Nexus Dashboard version. This replacement option is available for inactive primary nodes in the UI and serves as an alternative to failover.
The figure below shows the operation of failing over or replace a failed primary node from the User Interface.
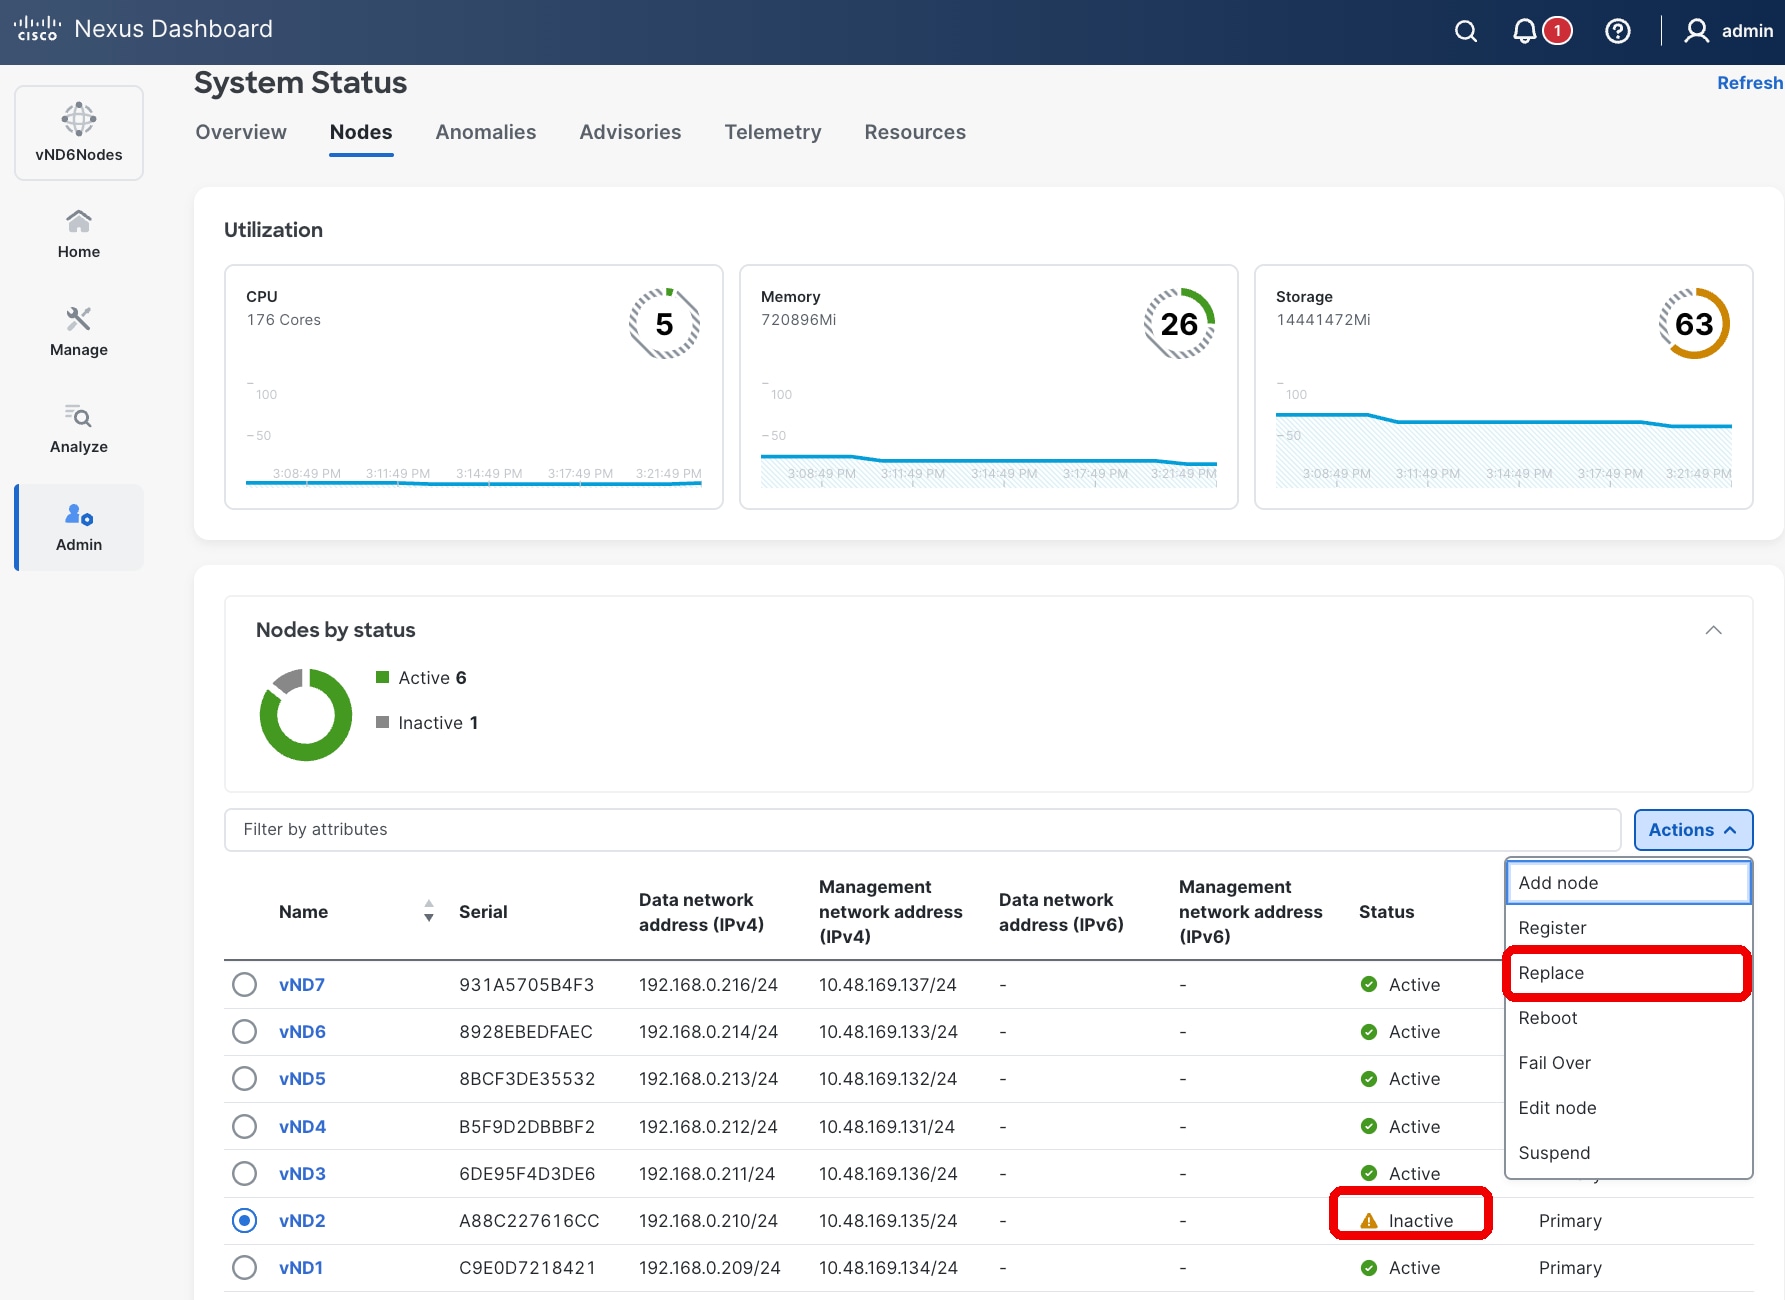
Figure 14 Nexus Dashboard UI showing how to fail over or replace a failed primary node
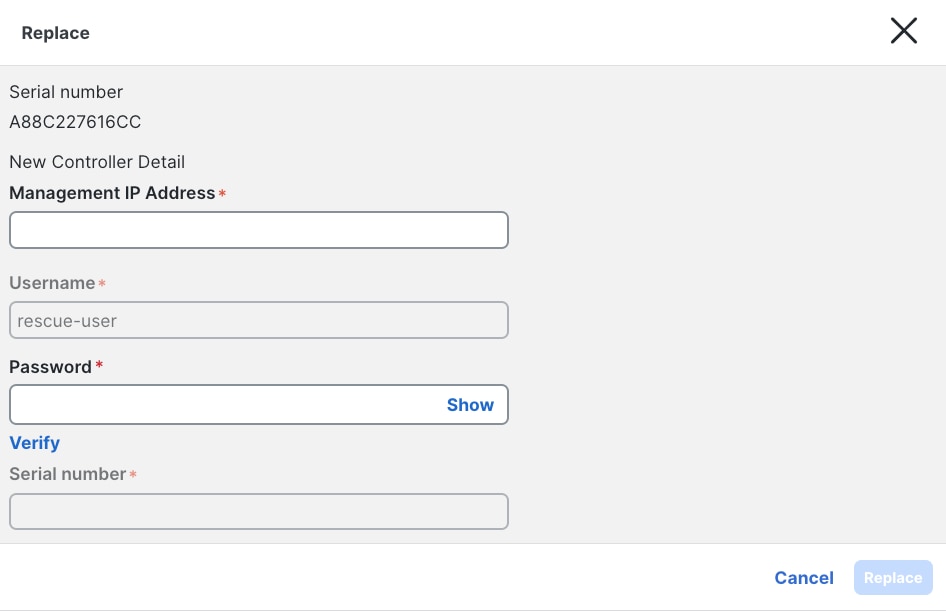
Figure 15 Primary failed node Replace
Key differences between Failover and Replace:
| Aspect |
Failover |
Replace |
| Prerequisite |
Requires a pre-existing standby node added to the cluster. |
Allows adding a new node as needed (e.g., during RMA). |
| IP Address Behavior |
Retains the standby node's management and data IP addresses. |
Assigns the failed node's IP addresses to the replacement node. |
After replacement, services rebalance to restore full cluster availability. This process may take several minutes and can cause minimal service degradation.
Secondary nodes cannot be failed over or replaced directly. To replace a failed secondary node:
● Delete the failed node from Admin → System Status → Nodes.
● Add a new node as a secondary, assigning either the same or new management and data IP addresses.
Note: A standby node cannot fail over secondary nodes. Refer to the Cisco Nexus Dashboard Troubleshooting Guide for more information about replacing failed nodes.https://www.cisco.com/c/en/us/td/docs/dcn/nd/4x/articles-421/analyzing-and-troubleshooting-your-network.html
Persistent IP addresses
Persistent IP addresses (also known as external service IP addresses) are dedicated IPs assigned to key controller and telemetry services within the Nexus Dashboard cluster. These services are implemented as one or more Kubernetes containers that provide specific platform capabilities.
The term "persistent" reflects that, although service instances may move between different Nexus Dashboard nodes during node or pod failures, the IP address associated with the service remains constant. This persistence ensures that switches in the fabric do not require any configuration changes in the event of a Nexus Dashboard failure, maintaining uninterrupted communication.
Persistent IP Address Allocation
Persistent IP addresses can be assigned within both the management and data subnets, refer to the white paper for Deploying Nexus Fabrics with Telemetry on Cisco Nexus Dashboard for more information. The following persistent IP addresses are used in Nexus Dashboard:
| Service |
Persistent IPs Required |
| Telemetry collector |
1 IP (single-node cluster) or 3 IPs (clusters with 3+ nodes) |
| SNMP trap and syslog receiver |
1 IP |
| Switch bootstrap service (POAP/PnP) |
1 IP |
Enhanced Resiliency in Nexus Dashboard 4.1
Starting with Nexus Dashboard version 4.1, the use of persistent IP addresses has been enhanced to improve resiliency during failure scenarios:
● Switches and fabric controllers now stream telemetry exclusively to the persistent IP address.
● If a Nexus Dashboard node fails, after a brief transition period during which the service relocates to another active node, telemetry streaming resumes automatically without requiring any configuration changes on the switch side.
This design ensures high availability and seamless failover for critical telemetry and control services within the Nexus Dashboard cluster, supporting robust and resilient network operations.
Disk Failure
Nexus Dashboard cluster nodes are configured with RAID0 for their HDDs. RAID0 has been chosen to provide the best resource utilization and performance for the cluster. However, as a consequence, the failure of a single disk can result in:
● Loss of operational data on the affected node.
● Severe impact to the server's functionality.
Recommendation: If you experience a disk failure, replace the server as soon as possible. Use a standby node (if available) to fail over the affected primary node while arranging for hardware replacement.
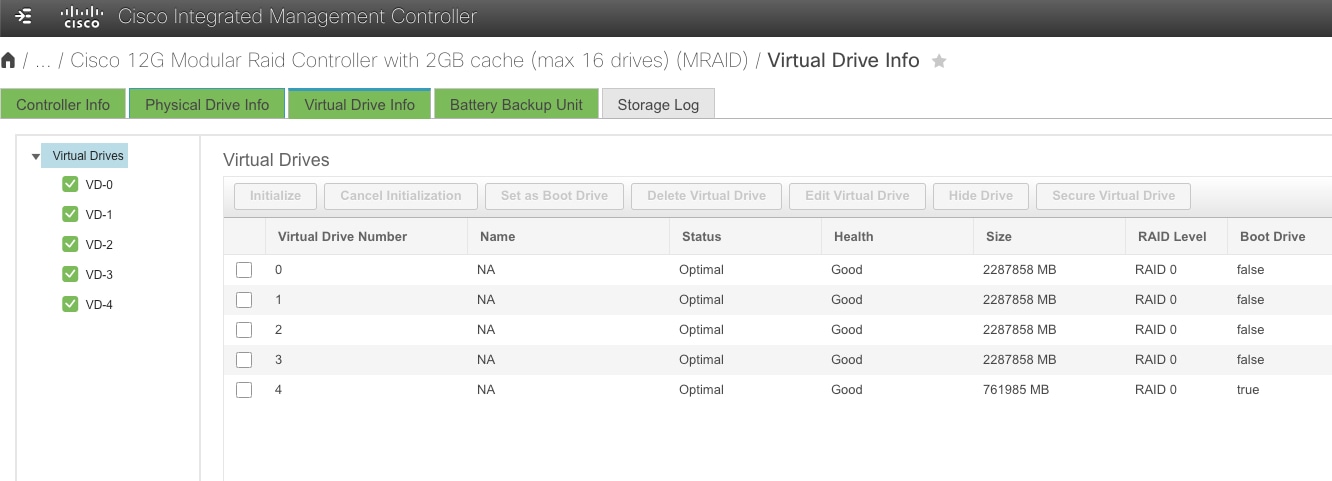
Figure 16 View of the HDD from CIMC of a Nexus Dashboard node
NIC Failure
All physical Nexus Dashboard cluster nodes are provisioned with:
● 2 management network NICs
● 2 data network NICs
Nexus Dashboard automatically creates two Linux bond interfaces (one for management, one for data), configured as an active/standby pair. If the active port connectivity is lost, the Nexus Dashboard node automatically fails over to the standby interface.
Recommendation: Connect each NIC interface to a different switch to maximize redundancy. This ensures that a single switch failure does not result in loss of connectivity for the Nexus Dashboard node.
Software Upgrade Impact on Availability
Software upgrades are a routine but critical operational activity for maintaining the security, stability, and feature currency of the Nexus Dashboard platform. Understanding the impact of upgrades on cluster availability is essential for planning maintenance windows and ensuring continuity of network management services.
Upgrade Process Overview
Nexus Dashboard manages the software upgrade process atomically across all nodes in the cluster. The platform orchestrates the upgrade end-to-end, ensuring that all cluster nodes are upgraded to the same software version in a single, coordinated operation. There is no need—and no option—to upgrade individual nodes independently or in a staged, node-by-node fashion.
This atomic upgrade approach ensures version consistency across all cluster nodes at all times, which is a fundamental requirement for cluster stability and high availability. It also simplifies the operational process: the administrator initiates the upgrade from the Nexus Dashboard UI, and the platform handles the sequencing, validation, and execution across all nodes automatically.
Service Availability During Upgrades
During the upgrade process, service availability is temporarily impacted. The following behaviors should be expected:
● Platform services are unavailable for a portion of the upgrade window as nodes are restarted and services are redeployed on the updated software.
● The Nexus Dashboard UI is temporarily inaccessible during the upgrade process.
● Telemetry data ingestion is interrupted during the upgrade. Switches continue to buffer and/or retry telemetry streaming, but data collected during the upgrade window may be lost or delayed depending on the duration of the outage and switch-side buffering capabilities.
● Dynamic jobs (such as assurance collection, bug scans, pre-change validation, and connectivity analysis) that are running or scheduled during the upgrade will fail or be deferred until the upgrade is complete.
● Controller and orchestration operations are suspended during the upgrade. No configuration changes should be initiated or expected to complete during this period.
Important: While the Nexus Dashboard cluster is being upgraded, the fabric’s network data plane is not affected. Switches and fabrics continue to forward traffic normally. Only the management, telemetry, and orchestration control planes between the Nexus Dashboard cluster and the managed fabrics are interrupted for the duration of the upgrade.
Prerequisites for a Successful Upgrade
To ensure a smooth upgrade with minimal risk, the following prerequisites are automatically verified by system before initiating the process:
● All cluster nodes must be healthy. All primary, secondary, and standby nodes are in a healthy, operational state before starting the upgrade. System does not initiate an upgrade if any node is in a failed, degraded, or unreachable state.
● No active dynamic jobs. No assurance collections, bug scans, pre-change validations, or other dynamic jobs are currently running. Allow any in-progress jobs to complete or cancel them before proceeding.
● Sufficient disk space. Verify that all cluster nodes have adequate free disk space to accommodate the upgrade image and temporary files required during the process.
Also make sure that:
● Current backup is available. Perform a full platform and services backup immediately before initiating the upgrade. Store the backup in a secure, geographically separate location. This ensures that if the upgrade fails or introduces issues, the cluster can be restored to its pre-upgrade state.
● Run the Nexus Dashboard Pre-Upgrade Validation script. It is highly recommended that you run the Nexus Dashboard Pre-Upgrade Validation script before performing any Nexus Dashboard upgrade. This is a Python script that performs various checks for known issues that have been identified to affect the success of a Nexus Dashboard upgrade. The script is continuously updated and maintained to mitigate any new upgrade-related issues that are detected in the field. Running this script before each upgrade significantly reduces the risk of encountering known issues during the upgrade process and is considered an essential step in upgrade preparation.
● Review release notes and compatibility. Consult the release notes for the target software version and verify compatibility with managed fabrics.
Recommendation: Always perform upgrades during a planned maintenance window when dynamic jobs can be suspended and temporary loss of telemetry and management connectivity is acceptable. Communicate the maintenance window to all stakeholders who depend on Nexus Dashboard services.
Standby Node Behavior During Upgrades
Standby nodes, if present in the cluster, are included in the atomic upgrade process. The platform automatically upgrades standby nodes along with all primary and secondary nodes, ensuring that after the upgrade completes, all nodes—including standby—are running the same software version.
This behavior is important for maintaining the standby node's readiness: if a standby node were left on an older software version, it would be unable to replace a failed primary node after the upgrade, since all cluster nodes must run the same version.
Note: No special action is required for standby nodes during an upgrade. The platform handles them automatically as part of the coordinated upgrade process.
Federation Upgrade Considerations
In federated Nexus Dashboard deployments, each cluster in the federation is upgraded independently. However, the upgrade order matters and must be carefully planned to maintain federation compatibility and coordination.
Required Upgrade Order
1. Upgrade the federation primary cluster first. The primary cluster must be upgraded to the target software version before any secondary clusters in the federation.
2. Upgrade federation secondary clusters. After the primary cluster upgrade is complete and the cluster has returned to a healthy operational state, proceed with upgrading the secondary clusters. Secondary clusters can be upgraded sequentially or in parallel, depending on operational preferences and maintenance window constraints.
Important: Do not upgrade a federation secondary cluster to a version higher than the federation primary cluster. The primary cluster must always be running the same or higher software version compared to all secondary clusters in the federation. Failure to follow this order may result in federation incompatibility and communication failures between clusters.
Federation Availability During Upgrades
During the upgrade of any individual cluster in the federation, the following impacts apply:
| Cluster Being Upgraded |
Impact on Federation |
| Primary cluster |
Federation coordination is temporarily unavailable. Secondary clusters continue to operate independently for their locally managed services and fabrics, but cross-cluster coordination is suspended until the primary cluster upgrade is complete. |
| Secondary cluster |
The federation continues to operate normally. Only the services and fabrics managed by the secondary cluster being upgraded are temporarily impacted. The primary cluster and other secondary clusters are unaffected. |
Recommendation: For federated deployments, plan a staggered maintenance window that accommodates the sequential upgrade of the primary cluster followed by secondary clusters. Ensure adequate time between upgrades to verify that each cluster has returned to a healthy state and that federation connectivity has been re-established before proceeding to the next cluster.
Upgrade Rollback and Recovery
If an upgrade fails or introduces unexpected issues, the following recovery options are available:
● Platform-managed rollback: In some cases, the Nexus Dashboard platform may automatically roll back an unsuccessful upgrade. Consult the release notes for version-specific rollback capabilities and behavior.
● Restore from backup: If the upgrade completes but the cluster exhibits issues, and an automatic rollback is not available, restoring from the pre-upgrade backup requires careful consideration due to the following platform constraints:
◦ Downgrading is not supported. Nexus Dashboard does not support downgrading to a previous software version on an existing cluster.
◦ Backup version must match the running version. A backup can only be restored to a Nexus Dashboard cluster that is running the exact same software version as the version on which the backup was taken. It is not possible to restore a backup taken on one version to a cluster running a different version.
Therefore, to restore the pre-upgrade backup, it is necessary to re-deploy a Nexus Dashboard cluster running the pre-upgrade software version from scratch, and then restore the backup onto that freshly deployed cluster. The specific procedure depends on the form factor of the deployment:
● Virtual Nexus Dashboard (vND): Redeploy a new Nexus Dashboard cluster using the OVA or qcow2 virtual machine image corresponding to the pre-upgrade software version. This involves provisioning new virtual machines, bootstrapping the cluster, and configuring it with the same cluster parameters (cluster name, persistent IPs, network settings) as the original cluster to ensure compatibility with the backup.
● Physical Nexus Dashboard (pND): Re-image each physical cluster node by booting from the ISO installer of the pre-upgrade software version. This performs a clean installation of the previous software release on each node, effectively wiping the current software. Once all nodes have been re-imaged, bootstrap the cluster with the same cluster parameters (cluster name, persistent IPs, network settings) as the original cluster before restoring the backup.
Important: Ensure that the pre-upgrade software image — the OVA/qcow2 file for virtual deployments or the ISO image for physical deployments — is retained and accessible in the event that a rollback via backup restoration becomes necessary. Without access to the pre-upgrade software image, rollback via backup restoration is not possible.
Recommendation: After a successful upgrade, perform a post-upgrade backup as soon as the cluster has stabilized. This establishes a new recovery baseline for the updated software version and ensures that future restore operations can be performed against the current running version.
Summary of Upgrade Best Practices
| Best Practice |
Details |
| Plan a maintenance window |
Upgrades temporarily impact all platform services. Schedule accordingly and notify stakeholders. |
| Verify all nodes are healthy |
Do not upgrade a cluster with failed or degraded nodes. |
| Back up before upgrading |
Perform a full platform and services backup immediately before the upgrade. |
| Review release notes and compatibility |
Ensure target version compatibility with all managed fabrics, controllers, and federated clusters. |
| Run pre-upgrade script |
Ensure the pre-upgrade script is run to validate the status of the cluster is ready for upgrade. |
| Upgrade federation primary first |
In federated deployments, always upgrade the primary cluster before secondary clusters. |
| Verify health after each upgrade |
Confirm cluster health, service availability, and federation connectivity before proceeding to the next cluster. |
| Back up after upgrading |
Establish a new recovery baseline with a post-upgrade backup. |
| Do not run dynamic jobs during upgrade |
Allow the upgrade to complete fully before resuming operational tasks. |
Monitoring and Health Checks
Proactive monitoring of the Nexus Dashboard cluster is essential for maintaining high availability and detecting potential issues before they escalate into service-impacting failures. Nexus Dashboard provides multiple mechanisms for monitoring cluster health, ranging from interactive interfaces to automated alerting integrations.
This section describes the available monitoring options and provides recommendations for establishing an effective health monitoring practice.
Monitoring via the Nexus Dashboard UI
The Nexus Dashboard graphical user interface provides a comprehensive view of cluster health and operational status. Key monitoring capabilities available through the UI include:
● Cluster Overview: The Admin → System Status page provides a real-time summary of all cluster nodes, including their roles (primary, secondary, standby), operational status (healthy, degraded, inactive), and resource utilization.
● Node-Level Details: Drill down into individual nodes to view detailed information such as CPU utilization, memory usage, disk consumption, and the list of Kubernetes pods running on each node.
● Service Health: Monitor the health and status of all platform services and capabilities (controller, telemetry, orchestration) to identify services that may be degraded or experiencing issues.
● Platform Alerts and Notifications: The UI displays platform-generated alerts for events such as node failures, service restarts, resource threshold breaches, and connectivity issues. These alerts provide immediate visibility into conditions that may require operator attention.
Recommendation: Regularly review the Nexus Dashboard UI — particularly the System Status and platform alerts — as part of routine operational health checks. Establish a cadence (e.g., daily or at shift changes) for operators to verify cluster health.
Figure 17 System Status — Nexus Dashboard
Monitoring via the REST API
Nexus Dashboard exposes a comprehensive REST API that allows external systems and automation tools to programmatically query cluster health, node status, service availability, and platform events. The REST API enables:
● Automated health checks: Integrate Nexus Dashboard health queries into existing monitoring and orchestration frameworks (e.g., scripts, CI/CD pipelines, or third-party monitoring platforms).
● Custom dashboards: Extract cluster and service health data for display in centralized network operations center (NOC) dashboards or enterprise monitoring tools.
● Event-driven automation: Trigger automated workflows based on cluster health status changes, such as opening incident tickets or notifying on-call personnel.
The REST API provides the same level of detail as the UI and is the recommended approach for organizations that require continuous, automated monitoring of their Nexus Dashboard infrastructure.
Recommendation: Leverage the Nexus Dashboard REST API to integrate cluster health monitoring into your existing enterprise monitoring and alerting infrastructure. This ensures that Nexus Dashboard health is continuously monitored without relying solely on manual UI checks.
Alerting and External Notification Mechanisms
In addition to interactive monitoring through the UI and REST API, Nexus Dashboard supports several external notification mechanisms that enable proactive, real-time alerting when platform events or health conditions require attention.
Syslog
Nexus Dashboard can be configured to send syslog messages to external syslog servers. Platform events, alerts, and health status changes are forwarded as syslog messages, enabling integration with centralized log management and SIEM (Security Information and Event Management) systems.
Syslog integration is particularly useful for:
● Centralizing Nexus Dashboard events alongside events from other network infrastructure components.
● Enabling correlation of Nexus Dashboard platform events with fabric-level events for holistic troubleshooting.
● Retaining a historical audit trail of platform events for compliance and post-incident analysis.
Email Notifications
Nexus Dashboard supports email-based notifications for platform alerts and events. Administrators can configure email recipients and notification policies to ensure that critical events — such as node failures, service degradation, or backup failures — are promptly communicated to the appropriate personnel.
Email notifications are particularly useful for:
● Ensuring visibility of critical events for teams that may not have constant access to the Nexus Dashboard UI or integrated monitoring platforms.
● Providing a simple, low-overhead alerting mechanism that requires no additional infrastructure.
Kafka Message Bus Integration
Nexus Dashboard supports publishing platform events to a Kafka message bus. This integration enables streaming of platform events and health data to external consumers such as:
● Enterprise event processing and analytics platforms.
● Custom monitoring and automation applications.
● Data lake or data warehouse systems for long-term operational analytics.
Kafka integration is recommended for organizations with mature event-driven architectures that require real-time streaming of platform events into centralized event processing pipelines.
SNMP
Nexus Dashboard supports SNMP (Simple Network Management Protocol) for monitoring and alerting. SNMP traps can be configured to notify external network management systems (NMS) of platform events and health status changes. SNMP polling can also be used to query cluster and node health metrics.
SNMP integration is particularly useful for organizations that rely on traditional network management platforms and wish to incorporate Nexus Dashboard health monitoring into their existing SNMP-based monitoring infrastructure.
Summary of Monitoring and Alerting Options
| Monitoring Method |
Type |
Use Case |
| Nexus Dashboard UI |
Interactive |
Real-time visual health checks, drill-down diagnostics, platform alert review. |
| REST API |
Programmatic |
Automated health checks, custom dashboards, event-driven automation. |
| Syslog |
Push notification |
Centralized logging, SIEM integration, event correlation, audit trails. |
| |
Push notification |
Critical event alerts to personnel without access to monitoring platforms. |
| Kafka |
Streaming |
Real-time event streaming to enterprise analytics and event processing platforms. |
| SNMP |
Push / Poll |
Integration with traditional NMS platforms, SNMP-based monitoring infrastructure. |
Monitoring Best Practices
The following best practices are recommended for establishing a robust monitoring posture for Nexus Dashboard:
● Implement multiple monitoring layers. Do not rely on a single monitoring method. Combine automated REST API-based health checks with push-based alerting (syslog, email, or SNMP) to ensure comprehensive coverage.
● Monitor all node types. Ensure that primary, secondary, and standby nodes are all monitored. A degraded standby node may not be immediately apparent but could prevent successful failover when needed.
● Integrate with existing enterprise monitoring. Leverage syslog, SNMP, Kafka, or REST API integrations to bring Nexus Dashboard health data into your centralized monitoring and incident management platforms, ensuring consistent operational visibility across all infrastructure.
● Perform regular health checks. In addition to automated monitoring, establish a regular cadence for manual review of cluster health through the UI. This is particularly important after events such as node replacements, software upgrades, or backup restorations.
● Monitor backup health. Ensure that automated backups are completing successfully and that backup files are being stored in the designated locations. A failed or missing backup may not be discovered until it is needed for a restoration, at which point it is too late.
Recommendation: At a minimum, configure syslog and email notifications for all production Nexus Dashboard clusters to ensure that critical platform events are promptly detected and communicated, even if no operator is actively monitoring the UI.
Conclusion
This white paper has provided a comprehensive guide to deploying a highly available Cisco Nexus Dashboard cluster, covering the full spectrum of design decisions that organizations must evaluate to achieve a resilient and efficient network management infrastructure.
Key Design Decisions Covered
Throughout this document, the following critical design areas were addressed:
● Form Factor Selection: Choosing between physical and virtual deployments based on scale requirements, operational preferences, and resource considerations.
● Cluster Sizing: Determining the appropriate number of primary, secondary, and standby nodes to balance performance, scalability, and recovery capabilities.
● Feature Architecture: Evaluating the trade-offs between running multiple features on a single cluster versus distributing features across federated clusters.
● Multi-Cluster Federation: Understanding the high availability implications of federated deployments, including the critical role of the federation primary cluster and recovery procedures.
● Fabric Onboarding: Assessing the impact of onboarding multiple independent fabrics on a single cluster, including scalability, version compatibility, and failure blast radius considerations.
● Fabric Connectivity: Selecting the appropriate connectivity model—routed or direct—based on the number of managed fabrics, fault isolation requirements, and operational simplicity.
● Node Placement: Choosing between centralized and distributed deployment models within a logical Data Center, informed by availability zone diversity and failure tolerance requirements.
● Failure Scenarios and Recovery: Understanding the platform's fault tolerance boundaries, standby node capabilities, persistent IP behavior, and backup restoration procedures.
● Disaster Recovery: Planning for catastrophic failure scenarios with appropriate backup strategies, standby clusters, and awareness of capability-specific restoration limitations.
Core Recommendations
The following core recommendations should guide every Nexus Dashboard high-availability deployment:
1. Deploy a 3-node primary cluster minimum for all production environments.
2. Use standby nodes for physical form factor clusters to accelerate failover and minimize degraded operation time.
3. Run multiple features on a single cluster unless scale limits or strict per-feature SLA requirements mandate distributing features across federated clusters.
4. Use routed connectivity for environments managing more than one fabric.
5. Deploy centralized unless three or more independent availability zones are available within the logical Data Center.
6. Back up regularly using automated scheduling and store backups in multiple geographically diverse locations.
7. Restore failed nodes promptly—avoid running dynamic jobs while the cluster is in a degraded state.
8. For federated deployments, protect the primary cluster with the highest level of resiliency and document cluster names as part of the disaster recovery runbook.
9. If strict disaster recovery SLAs are required, maintain a standby Nexus Dashboard cluster in a different logical Data Center.
Next Steps
To proceed with planning and deploying a highly available Nexus Dashboard cluster, we recommend the following next steps:
● Assess scale requirements using the Cisco Nexus Dashboard Capacity Planning Tool to determine the appropriate cluster size, form factor, and cohosting capabilities for your environment.
● Review compatibility using the Nexus Dashboard Compatibility Matrix to ensure that all fabric devices and software versions are supported.
● Follow deployment procedures detailed in the Nexus Dashboard and Services Deployment and Upgrade Guide for step-by-step cluster installation and configuration instructions.
● Establish operational procedures for backup scheduling, health monitoring, node replacement, and disaster recovery, using the guidance in this white paper and the Nexus Dashboard Troubleshooting Guide.
● Engage Cisco Services for assistance with design validation, deployment planning, or operational readiness assessments for complex or large-scale environments.
By following the guidelines and best practices outlined in this white paper, network administrators and architects can ensure the efficient operation, resilience, and long-term scalability of their Nexus Dashboard-based network management infrastructure.
The following documents and tools are referenced throughout this white paper and provide essential supplementary information for planning, deploying, and operating a highly available Nexus Dashboard cluster.
Product Documentation
| # |
Reference |
Description |
| 1 |
Central documentation hub for all Nexus Dashboard guides, release notes, and technical references. |
|
| 2 |
Detailed procedures for cluster deployment, configuration, and software upgrades, including network connectivity and RTT requirements. |
|
| 3 |
Guidance on platform operations, including backup and restore procedures. |
|
| 4 |
Procedures for diagnosing and resolving cluster issues, including node replacement and recovery operations. |
Planning Tools
| # |
Reference |
Description |
| 5 |
Interactive tool for determining cluster size, form factor, scale support, and cohosting capabilities based on deployment requirements. |
|
|
|
Validation script is a Python script that performs various checks for known issues that have been identified to affect the success of a Nexus Dashboard upgrade. |
Feature-Specific Documentation
| # |
Reference |
Description |
| 7 |
Backing Up and Restoring Telemetry Operational Data (ND 4.2.1+) |
Documentation on the enhanced telemetry backup and restore capability introduced in Nexus Dashboard 4.2.1, including operational data aggregation behavior. |
| 8 |
Connecting Clusters — Understanding Multi-Cluster Connectivity in Nexus Dashboard |
Guidance on establishing and managing multi-cluster federation for enabling different features across federated Nexus Dashboard clusters. |
| 9 |
API reference for programmatically querying cluster health, node status, and platform events. |