Deploying Nexus Fabrics with Telemetry on Cisco Nexus Dashboard
Available Languages
Bias-Free Language
The documentation set for this product strives to use bias-free language. For the purposes of this documentation set, bias-free is defined as language that does not imply discrimination based on age, disability, gender, racial identity, ethnic identity, sexual orientation, socioeconomic status, and intersectionality. Exceptions may be present in the documentation due to language that is hardcoded in the user interfaces of the product software, language used based on RFP documentation, or language that is used by a referenced third-party product. Learn more about how Cisco is using Inclusive Language.
- US/Canada 800-553-2447
- Worldwide Support Phone Numbers
- All Tools
 Feedback
 Feedback
Software and Hardware Product Versions
Terminology and Architecture Definitions
Pre-Requisites for Cisco Nexus Dashboard Sites Configuration
Prepare Cisco Nexus Dashboard Managed Sites for Streaming Telemetry to Cisco Nexus Dashboard
Prepare Cisco Nexus Dashboard Monitored Sites for Streaming Telemetry
Cisco Nexus Dashboard 4.1 is a unified platform for configuring, automating, monitoring, visualization, troubleshooting and analytics, that not only helps with the configuration and automation of data center fabrics, but also helps reduce the mean time to detect (MTTD) and mean time to resolve (MTTR) network issues by providing comprehensive visibility into the infrastructure. Cisco Nexus Dashboard processes and analyzes telemetry data continuously streamed from all the devices in the infrastructure to provide network operators with real-time monitoring and analytics of the network. It also offers lifecycle management suggestions and foresight into infrastructure change management.
This paper details the best deployment configurations, and settings to implement Cisco Nexus Dashboard (ND) for telemetry and operations for your managed or monitored NX-OS network sites. To enable streaming telemetry data from all the devices on the sites, specific configurations and pre-requisite settings are required on Cisco Nexus Dashboard and devices. You use a typical two-tier (spine and leaf) VXLAN-EVPN network fabric as an example in this white paper to illustrate the necessary configuration on the Cisco Nexus Dashboard side and the switches to prepare the sites for streaming telemetry. As a network site can be fully managed or only monitored by Cisco Nexus Dashboard, the white paper discusses the configuration for both the Cisco Nexus Dashboard managed mode and monitored mode.
This document is focused on providing the best approach with various design options for enabling and streaming telemetry to Cisco Nexus Dashboard for VXLAN-EVPN fabrics.
Software and Hardware Product Versions
The example in this white paper has the following product software versions:
· Cisco Nexus Dashboard version - 4.1.1g
For more information about supported software versions and compatibilities of related products, refer to the Cisco Nexus Dashboard and Services Compatibility Matrix at the following link - https://www.cisco.com/c/dam/en/us/td/docs/dcn/tools/nd-sizing/index.html.
For support of the required features, you are using all cloud-scale and silicon one switches.
Terminology and Architecture Definitions
Out of band (management port)
Management port of a switch, which is under the management VRF. This is typically the physical mgmt0 interface of a switch. This does not refer to the management network of the Cisco Nexus Dashboard nodes, which is explained below.
In-band (front panel port)
Refers to a front panel Ethernet port on a Nexus device that is used for in-band management. Unlike the traditional out-of-band (OOB) management port (mgmt0), which is dedicated for management traffic, in-band management allows the device to be managed through its regular data network interfaces (front panel ports), initially part of the default VRF. This does not refer to the data network of the Cisco Nexus Dashboard nodes, which is explained below.
Loopbacks
Logical interfaces (virtual IPs) configured on network devices, used as stable endpoints for control-plane communication, telemetry, or routing protocols.
Routed ports
Physical interfaces configured to operate as Layer 3 interfaces (not part of a VLAN). Each port has an IP address and participates directly in IP routing.
Cisco Nexus Dashboard Data Ports
Network Interfaces are dedicated to Cisco Nexus Dashboard node clustering connectivity, communicating with, and configuring NX-OS switches, and handling telemetry traffic from onboarded fabrics.
Cisco Nexus Dashboard Management Ports
Network Interfaces are dedicated to accessing the Cisco Nexus Dashboard GUI and CLI via SSH, supporting DNS and NTP communication, handling firmware uploads, enabling Cisco Intersight device connector communication, and carrying AAA (Authentication, Authorization, and Accounting) traffic.
Cisco Nexus Dashboard Persistent IP address (PIPs)
These are IP addresses that are used for various controller and telemetry functions within the Cisco Nexus Dashboard cluster. The use of persistent IP addresses ensures that even with the failure of a specific node within Cisco Nexus Dashboard cluster, the service IP does not change when moved to a different node. PIPs can be configured in the management or data subnets, but the PIPs used for telemetry collectors and receivers are always configured in the data network. The use case for when to configure them will be explained in the coming examples.
VXLAN-EVPN fabric
An overlay network technology combining VXLAN (Virtual Extensible LAN) for encapsulation and EVPN (Ethernet VPN) as the control plane enabling scalable, multi-tenant Layer 2/Layer 3 connectivity across data centers.
Classic LAN fabric
A classic LAN fabric deployment is a traditional three-tier deployment with core, aggregation, and access layer switches, where aggregation layer switches function as the Layer 2/Layer 3 boundary. It is also possible to have a two-tier design with a collapsed core (by combining the aggregation and core layers).
Cisco Nexus Dashboard Co-Located Deployment
A co-located deployment refers to a design where multiple Cisco Nexus Dashboard clusters are deployed to manage the same data center fabrics, but each cluster runs different services.
Cisco Nexus Dashboard Co-Hosted Deployment
A co-hosted deployment refers to running multiple Cisco Nexus Dashboard services on the same Cisco Nexus Dashboard cluster. Cisco Nexus Dashboard 4.1 is the first release where all use cases including ACI Multi-site orchestration, NX-OS controller, and telemetry for all fabric types are supported on a single cluster. Always refer to the capacity planning tool for supported deployments based on hardware and cluster size: https://www.cisco.com/c/dam/en/us/td/docs/dcn/tools/nd-sizing/index.html.
Deploy Cisco Nexus Dashboard at Layer 2
Cisco Nexus Dashboard nodes within the cluster are Layer 2 adjacent. This means that all Cisco Nexus Dashboard nodes share the same management and data subnet, respectively. In this case, persistent IP addresses need to be on the same network as the data network or management network. Since the nodes are operating at Layer 2, the upstream switches that the nodes connect to provide the appropriate VLAN access and gateway routing for the nodes.
Deploy Cisco Nexus Dashboard at Layer 3
Cisco Nexus Dashboard nodes within the cluster are Layer 3 adjacent. In other words, each Cisco Nexus Dashboard node in the cluster has its own unique management and data subnets, and the data interfaces use BGP to peer with the upstream Layer 3 network and advertise local IP and persistent IPs. There needs to be IP reachability between the nodes to form the cluster. In this case persistent IP addresses cannot be from a subnet that belongs to any of the Cisco Nexus Dashboard nodes’ Data or Management interface subnets. In this case, LAN Device Management Connectivity must be set to Data and cannot be changed. Layer 3 deployment mode is used when the ND cluster nodes are distributed in different location which have Layer 3 network connectivity and do not stretch Layer 2.
Note: All nodes must operate in the same mode (Layer 2 or Layer 3).
Pre-Requisites for Cisco Nexus Dashboard Sites Configuration
Types of Interfaces & pre-requisites for Cisco Nexus Dashboard
Cisco Nexus Dashboard nodes provide the following two interfaces for connectivity:
· Management Interface
· Data Interface
Cisco Nexus Dashboard nodes require one IP each for the above two interface types. Management and data interfaces must be placed in different subnets. Configuration of those IP addresses happens during the Cisco Nexus Dashboard bootstrap.
Layer 2 deployment is the most straight forward. However, if Layer 3 deployment is required (see terminology for reference), you must configure BGP during the bootstrap process.
As management network interfaces do not support the BGP protocol, when deployed in Layer 3 mode, the user needs to make sure management subnets are routable from the upstream management network from their respective gateways and subnets.
Below is the summary of pre-requisites to prepare Cisco Nexus Dashboard, and its managed or monitored network sites for onboarding onto Cisco Nexus Dashboard and for enabling telemetry for exporting fabric data to Cisco Nexus Dashboard. For streaming telemetry to Cisco Nexus Dashboard, the user has a choice to use either the out-of-band or in-band interfaces of the Nexus switches as telemetry sources, based on deployment design. Both the options are discussed in this whitepaper. Whether out-of-band or in-band is used, telemetry is always sent to the data interfaces.
1. The Cisco Nexus Dashboard cluster is connected and deployed (bootstrapped). For more information about deploying Cisco Nexus Dashboard in various form factors, refer to the deployment guide: https://www.cisco.com/c/en/us/td/docs/dcn/nd/4x/deployment/cisco-nexus-dashboard-deployment-guide-41x/nd-prerequisites-41x.html#concept_fdf_fxg_4mb.
2. The round-trip time (RTT) between the Cisco Nexus Dashboard cluster and the fabric switches must not exceed 150ms for network site telemetry to run properly.
3. The round-trip time (RTT) between the Cisco Nexus Dashboard cluster nodes must not exceed 50ms.
4. Enable and configure NTP (Network Time Protocol) in the network. NTP is an essential clock service that synchronizes all the elements of the network site. The NTP service is not only required for setting up the ND cluster and managing network site switches, but also for software telemetry to work. It maintains the consistency and coherence of logs between the switches and Cisco Nexus Dashboard. NTP configurations and verifications for monitored and managed modes are discussed in further sections.
5. If Flow Telemetry or Traffic Analytics is enabled to collect flow records from the monitored fabrics, you must configure PTP (Precision Time protocol) in the network. Cisco Nexus Dashboard requires a microsecond-level accurate PTP clock for the network site to perform flow analytics across the site and calculate the end-to-end network latency of the flows. The PTP grandmaster needs to be an external device that can provide at least a microsecond-level clock. The PTP configurations and verifications are discussed in the next sections for both Cisco Nexus Dashboard managed and monitored network sites.
6. Configure persistent IPs as discussed in detail in the following section below. By default, you will configure these when the cluster is deployed (bootstrapped).
7. Prepare the routing of the fabrics for telemetry streaming to Cisco Nexus Dashboard based on the design – either through a Layer 3 network, or by using an out-of-band management network for the connectivity. This is discussed in further detail later in this whitepaper.
8. For streaming telemetry through out-of-band network:
a. IP reachability should be established between the Cisco Nexus Dashboard Data interfaces and the out-of-band management interfaces (mgmt0) of the switches.
9. For streaming telemetry through in-band network:
a. Configure routable loopback interfaces on switches to source the telemetry and send it to the data network interfaces. If the fabric is deployed and managed through Cisco Nexus Dashboard, loopbacks will be auto provisioned using the template and can be used for streaming telemetry as illustrated in the example in the in-band section. You could also configure a dedicated loopback interface on the switches, although it is simply more configuration than using the existing ones. Configuring or usage of a loopback interface for both monitored and managed modes are discussed in further sections.
b. Cisco Nexus Dashboard data network needs IP reachability for the NX-OS fabric and the loopback addresses. A routable loopback interface is used on the network site switches for this connectivity and to source telemetry data. The following sections discuss in detail the configuration and verification of persistent IP requirements.
Configuring persistent IP addresses in Cisco Nexus Dashboard
Depending on the Cisco Nexus Dashboard cluster size and the services enabled, a different number of persistent IPs are required. Follow this link to understand the number of persistent IPs required for your deployment - https://www.cisco.com/c/en/us/td/docs/dcn/nd/4x/deployment/cisco-nexus-dashboard-deployment-guide-41x/nd-prerequisites-41x.html#concept_zkj_3hj_cgc.
For a typical 3-node cluster, Cisco Nexus Dashboard requires 5 mandatory persistent IP addresses for software and hardware telemetry services for a Cisco Nexus Dashboard managed or monitored network site. All 5 persistent IPs can be placed in the data network if the connectivity between Cisco Nexus Dashboard and the fabrics is over the data network itself. Alternatively, out of the 5 persistent IP addresses, 3 can be placed in the data network and 2 can be placed in the management network This depends on the deployment option that will be illustrated below. After bootstrapping, you may need to add additional persistent IP addresses as needed, depending on scenarios highlighted in the user guide (link provided below). Depending on the deployment mode, the configuration of the persistent IPs varies as shown below.
Layer 2: Here the Cisco Nexus Dashboard nodes within the cluster are Layer 2 adjacent. This means that all Cisco Nexus Dashboard nodes share the same management and data subnet, respectively. Persistent IP addresses need to be on the same network as the data network or management network.
Layer 3 BGP: In this mode, the Cisco Nexus Dashboard nodes within the cluster are Layer 3 adjacent. In other words, unique management and data subnets are associated with each Cisco Nexus Dashboard node in the cluster. There needs to be IP reachability between the nodes to form the cluster. Persistent IP addresses cannot be from a subnet that belongs to any of the Cisco Nexus Dashboard nodes’ Data or Management interface subnets. In this case, LAN Device Management Connectivity must be set to Data and cannot be changed.
For more information on persistent IPs, please refer to the Cisco Nexus Dashboard deployment guide following this link - https://www.cisco.com/c/en/us/td/docs/dcn/nd/4x/deployment/cisco-nexus-dashboard-deployment-guide-41x.html.
1. The telemetry collector persistent IP addresses are in the Cisco Nexus Dashboard Data Network subnet by default when the cluster is bootstrapped for the first time. Post cluster deployment, additional Ips can be added or modified in the System Settings. On the Cisco Nexus Dashboard UI, navigate to Admin > System Settings.
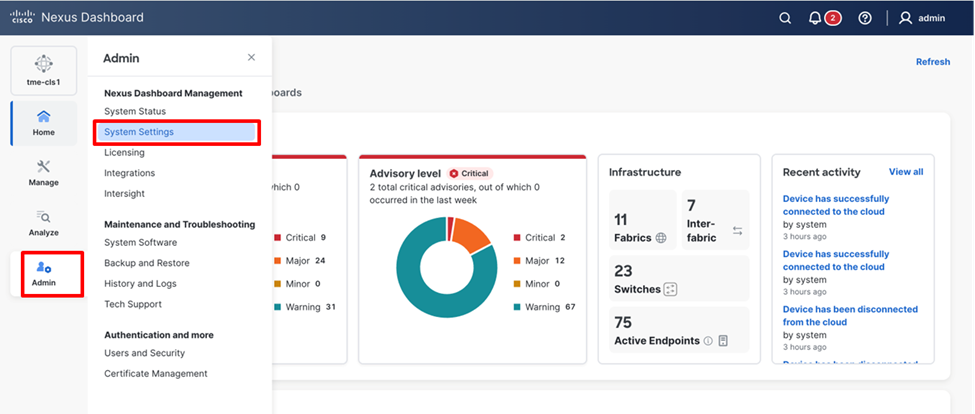
Cisco Nexus Dashboard System Settings Navigation
2. On the System settings page, scroll down External pools.
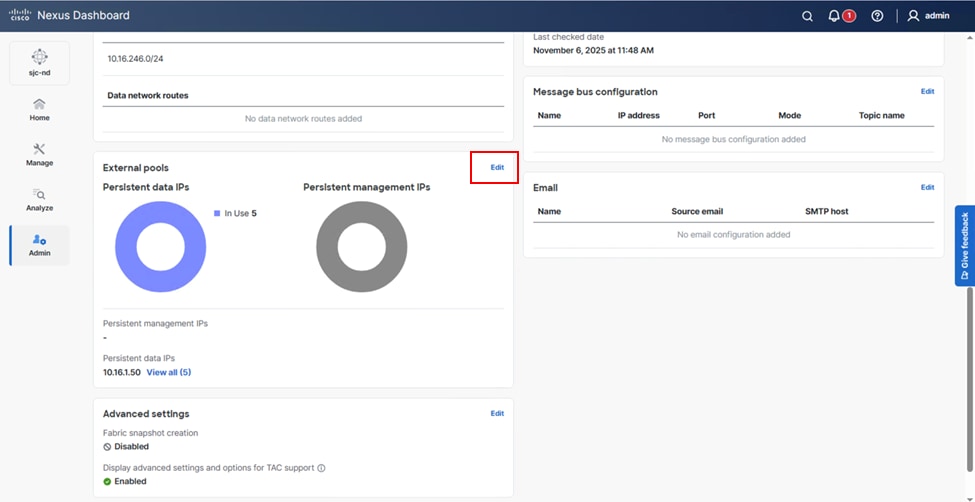
Persistent IP address configuration (post bootstrap)
3. Click Edit in External pools.
4. Click Add IP address to add at least 5 IP addresses.
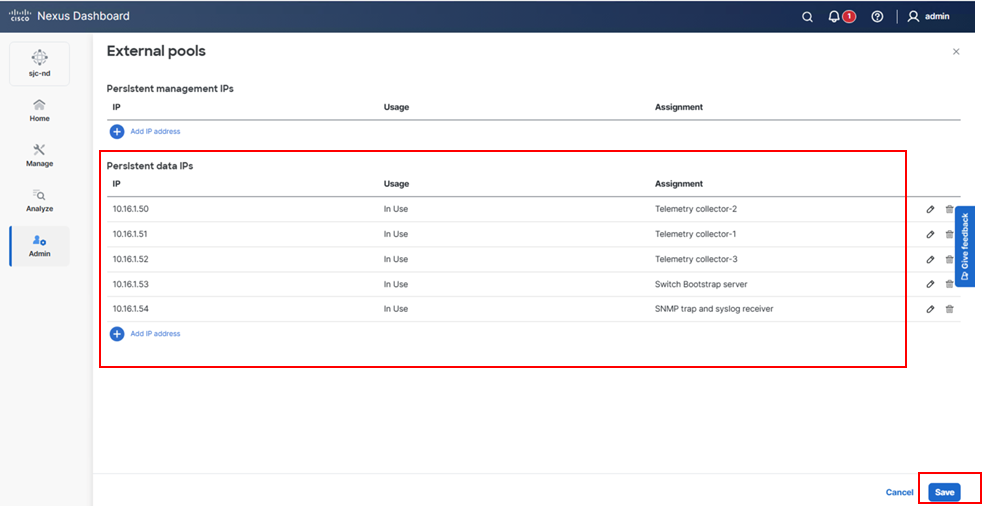
Persistent IP address allocation. Assignment is done automatically after IPs are added.
Note: Additional Persistent IPs can be added based on feature requirements. For example, the Endpoint Locator (EPL) feature requires 1 additional persistent IP address on the data network per fabric where EPL is enabled. For further information, please refer to the deployment guide mentioned above.
5. Click Save.
Prepare Cisco Nexus Dashboard Managed Sites for Streaming Telemetry to Cisco Nexus Dashboard
In the following section, you will go through the options for streaming telemetry from the managed fabrics to Cisco Nexus Dashboard. Each fabric streaming mode can be configured independently. While the below scenarios will cover the end-to-end deployment, consider these rules for cluster networking design and behavior.
1. Cisco Nexus Dashboards ability to communicate to nodes in the fabric is based on routing. You can configure specific routes in the management and data subnets to specify the interface for communication with specific subnets. By default, the default route for switch communication is in the data network, and thus data will be used by default to communicate with the switches.
2. The LAN Device Connectivity Policy defined in Admin > System Settings > Fabric Management > Advanced Settings > Admin > LAN Device Management Connectivity exposes two modes, Data and Management. The default is Data. This knob determines if the 2 Persistent IP addresses for Syslog, SNMP, and POAP bootstrap will be defined in Data or Management networks, respectively. For example, if you changed this policy to Management, you would need to add the two persistent IP addresses to the management network in the System Settings. The use case for changing the defaults will be described in the appropriate deployment section.
3. Telemetry is always sourced from the switches and sent to the data interface. The Telemetry can be sourced from mgmt0 (out-of-band) or a loopback (in-band) but can never be sent to the management ports on the Cisco Nexus Dashboard nodes, only the data network and persistent IP addresses in the data network.
Recommended Option – Configuration and Telemetry via Out-of-Band Network
Considering that most deployments already have an out-of-band network setup for remote management and disaster recovery of the devices, you provide the option to use out-of-band network of fabric switches for streaming telemetry to Cisco Nexus Dashboard. In such a case, using this connection type does not require any additional connection configuration, making it easy to deploy.
The default function of the Cisco Nexus Dashboard interfaces and networks is depicted below in Table 1.
Table 1. External network purpose
| Data network |
Management network |
| • Cisco Nexus Dashboard node clustering • Service to service communication • Cisco Nexus Dashboard nodes to Cisco APIC and NX-OS controller capability communication • Telemetry traffic for switches and on-boarded fabrics |
• Accessing Cisco Nexus Dashboard GUI • Accessing Cisco Nexus Dashboard CLI using SSH • DNS and NTP communication • Cisco Nexus Dashboard firmware upload • Intersight device connector • AAA traffic • Multi-cluster connectivity |
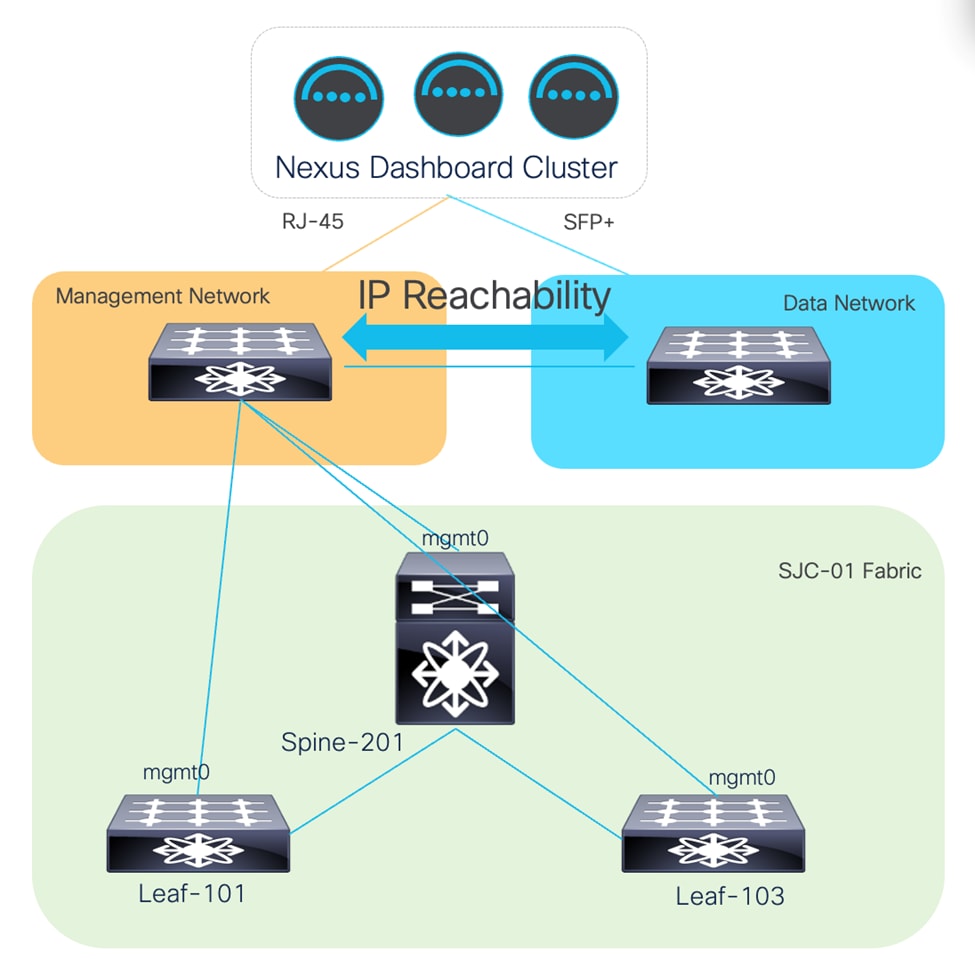
This means that by default, the system will try to use the data network to communicate with the switches to manage configuration and program the switches to send telemetry to the data network interfaces. When the Cisco Nexus Dashboard management network is in a different subnet than the switches mgmt0 network, this will work as intended and everything will be sent through the data network.
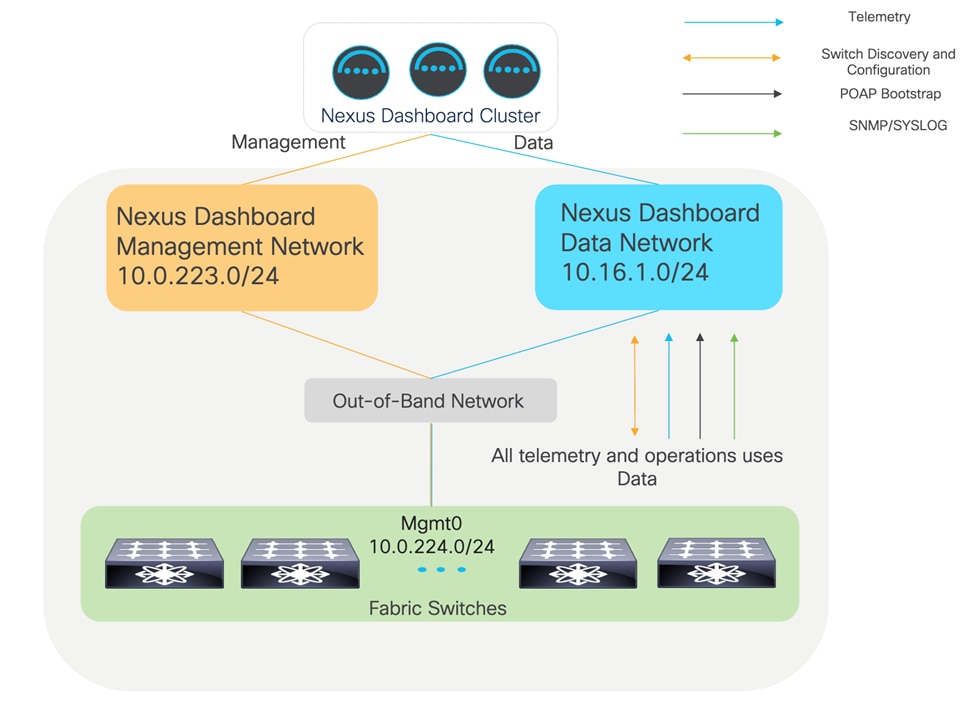
Logical network design for out-of-band management and telemetry. ND management and switch management are in different subnets.
However, when the Cisco Nexus Dashboard management network is in the same subnet as the switches mgmt0 network, it will still work natively, but the network path for the switch configuration will use the management network instead of data. This is because the routing table on the Cisco Nexus Dashboard cluster will always prefer its local subnet to reach the switches based on the IP addresses that were used to seed the switch to the fabric. Everything functionally will work, and as such this is more informative.
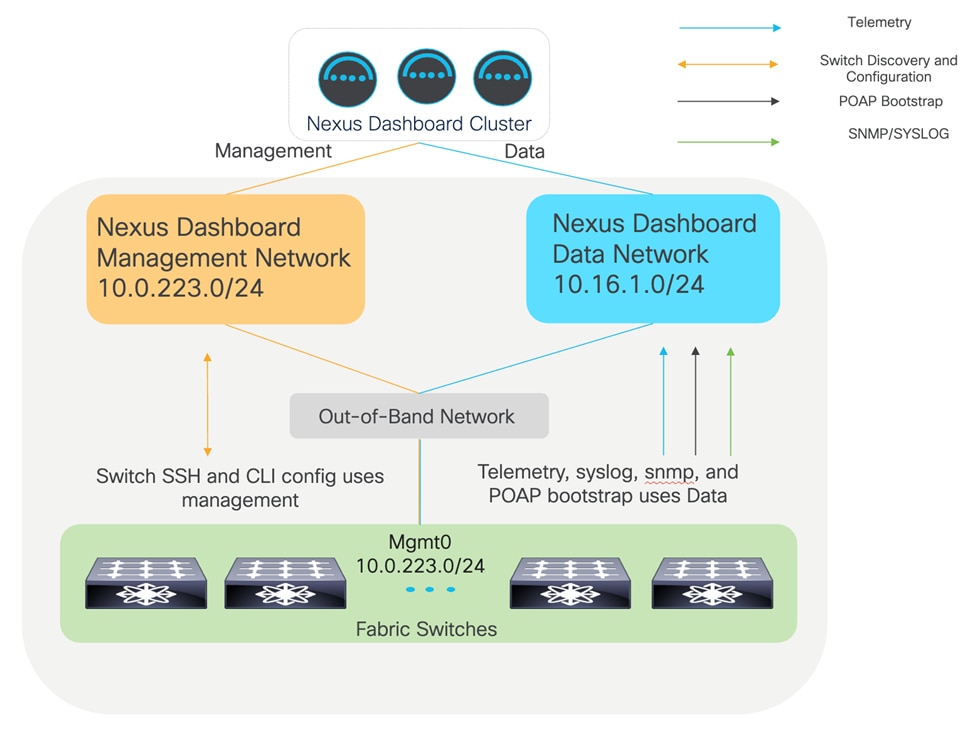
Logical network design for out-of-band management and telemetry. ND management and switch management are in the same subnet.
While Out-of-Band Telemetry streaming might be the simplest and most straight forward approach, there are few guidelines and limitations that must be considered:
• The management and data subnets must be separate subnets, and IP reachability between mgmt0 on the switches and the data subnet must be allowed. The persistent IPs will be placed in the data subnet by default when the cluster is initially bootstrapped. Refer to Figure 1.
• The telemetry will always be sent to the Cisco Nexus Dashboard data network and interfaces.
• Flow telemetry is not supported in this design; however, Traffic Analytics (TA) and Traffic Analytics compatibility mode are supported. Traffic Analytics is the current recommended mode providing you are running NX-OS release 10.4(2) or higher.
• On-demand flow troubleshooting for Traffic Analytics flows is available in NX-OS 10.5(2) and later when using out-of-band telemetry.
• This feature refers to the ability to collect 5-tuple flow information in real time as a user triggered workflow. It can be found under Analyze > Traffic Analytics > Select Service Port > Click “...” > Start flow collection.
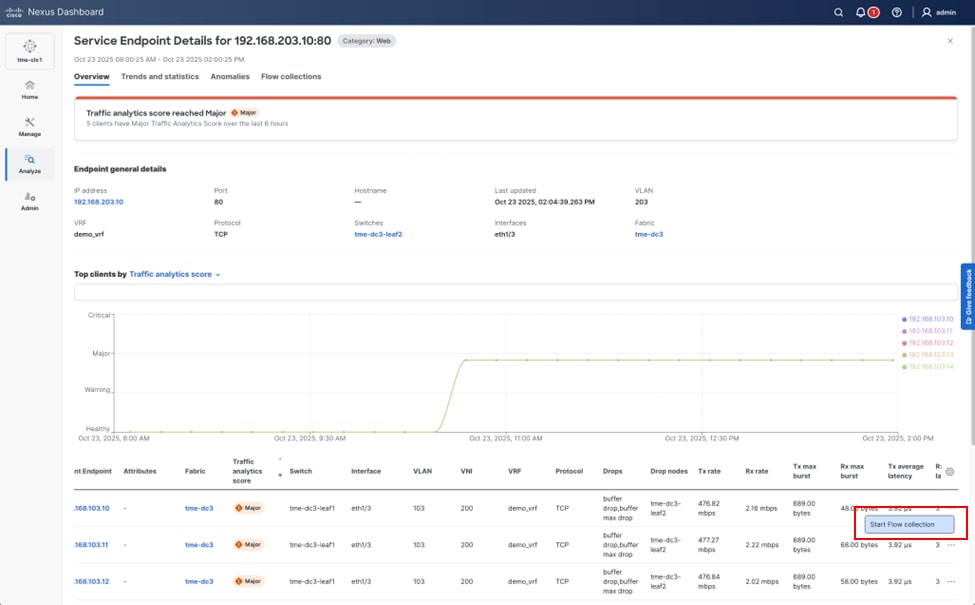
Starting a flow troubleshooting job from Traffic Analytics
Viewing a flow troubleshooting job from Traffic Analytics
Prepare a Cisco Nexus Dashboard managed network site for streaming telemetry. Follow these steps to complete the preparation:
• Create fabric
• Discover switches
• Configure NTP
• Configure PTP
Since the Cisco Nexus Dashboard management interfaces are RJ-45, and the data interfaces are SFP+, the upstream networking must support both. The following figures provide examples of physical topologies based on platform support for the interface form factors.
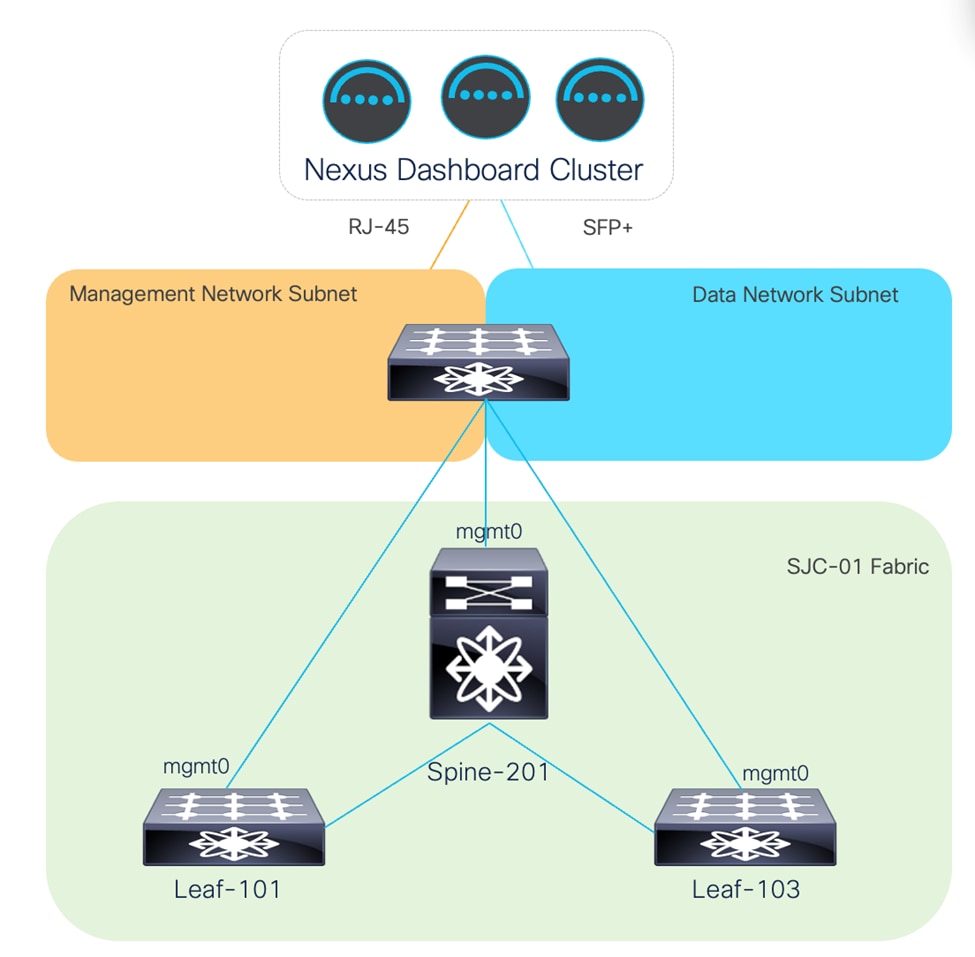
Cisco Nexus Dashboard Management and Data are physically connected to the same switch(es). Management and Data Networks have IP reachability.
Cisco Nexus Dashboard Management and Data are physically connected to different switches due to the form factor. Management and Data Networks have IP reachability.
Create Fabric
This section details how to create a controlled fabric that can be managed and monitored by Cisco Nexus Dashboard.
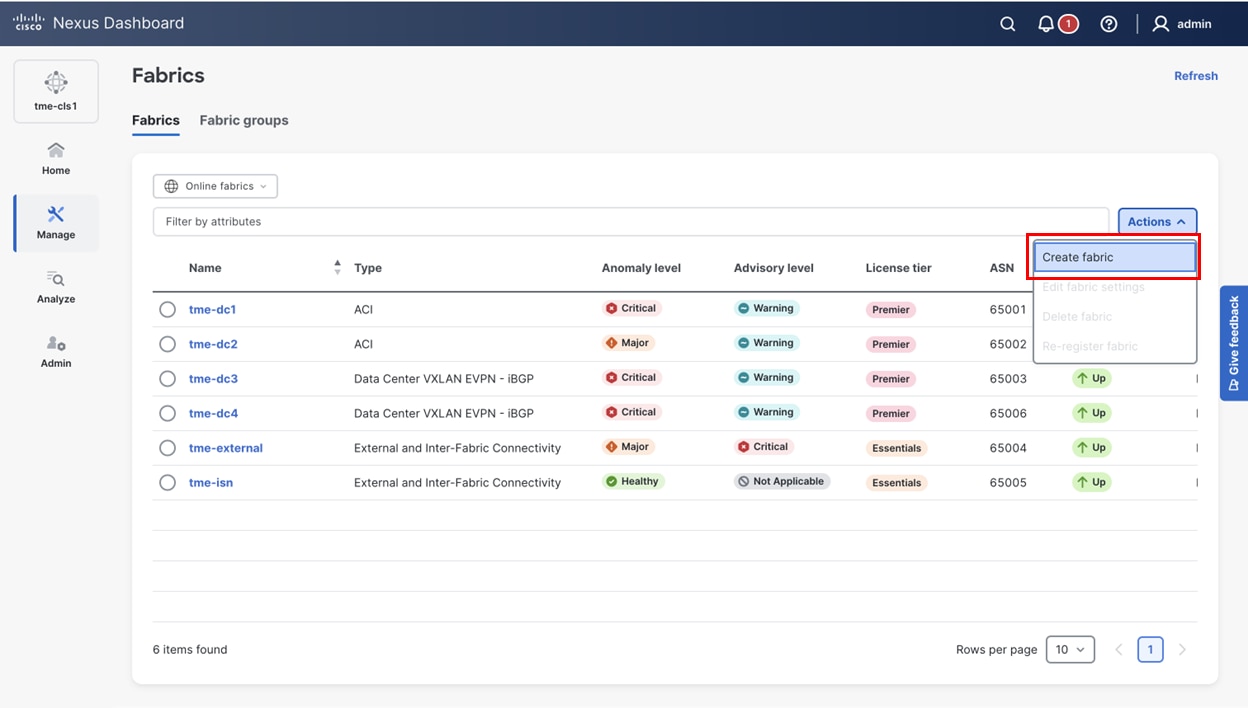
1. Navigate to Manage > Fabrics, click Create fabric.
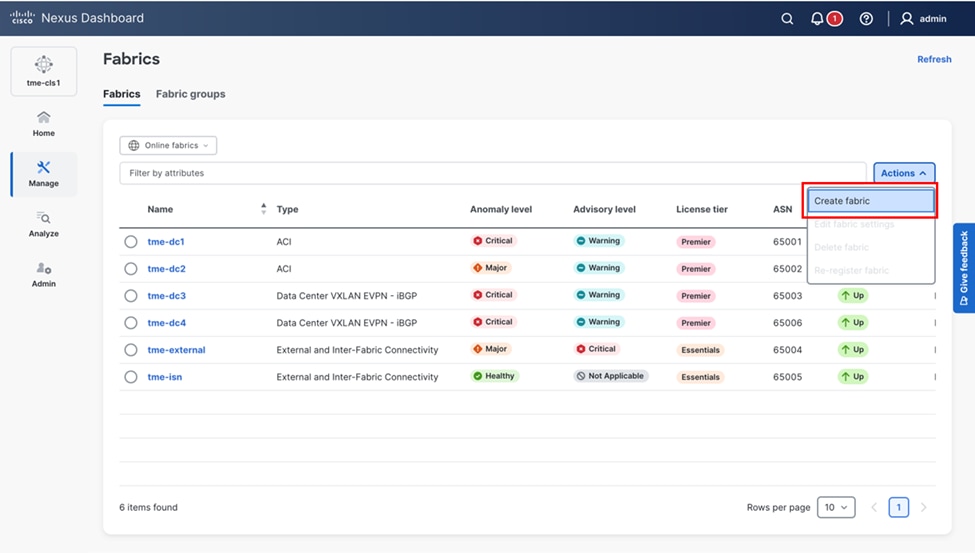
Creating a new fabric in Cisco Nexus Dashboard
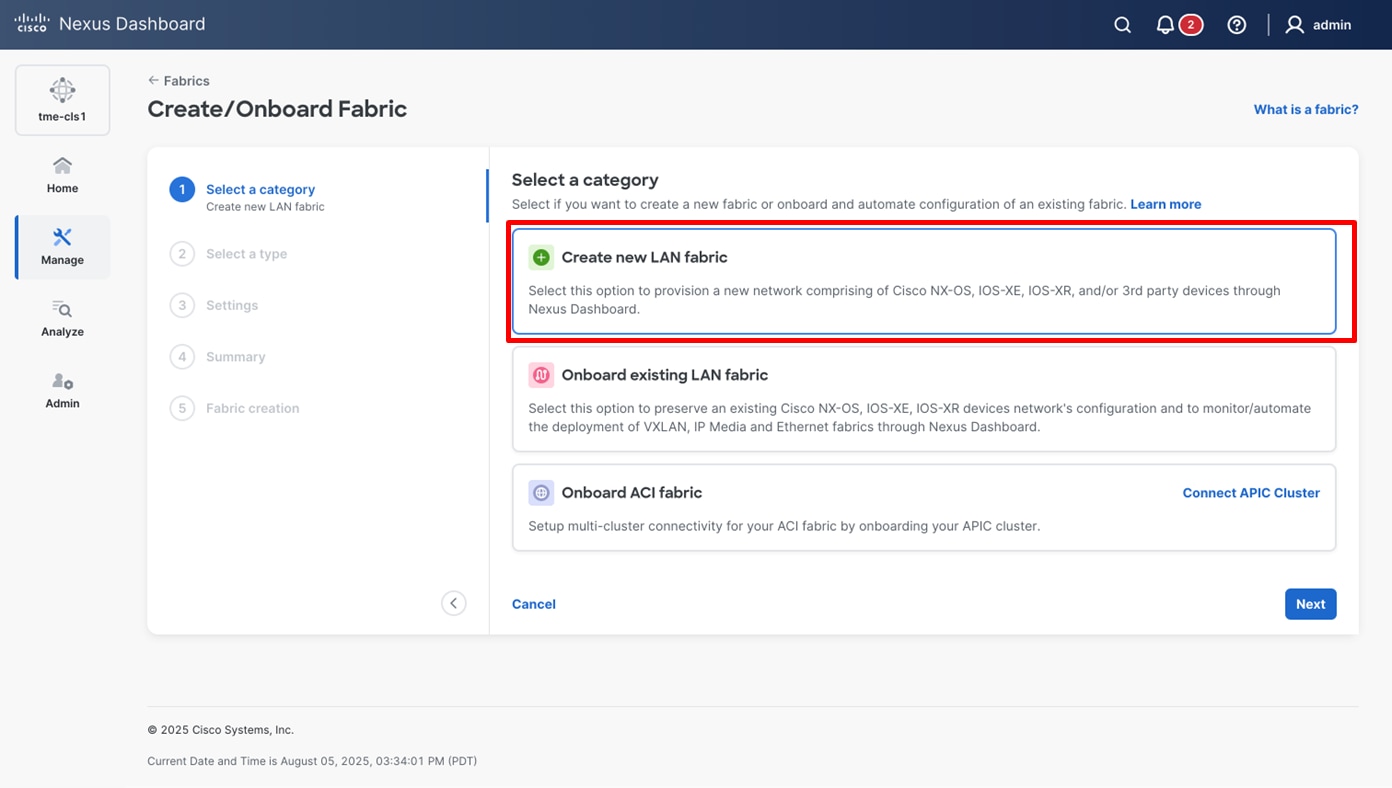
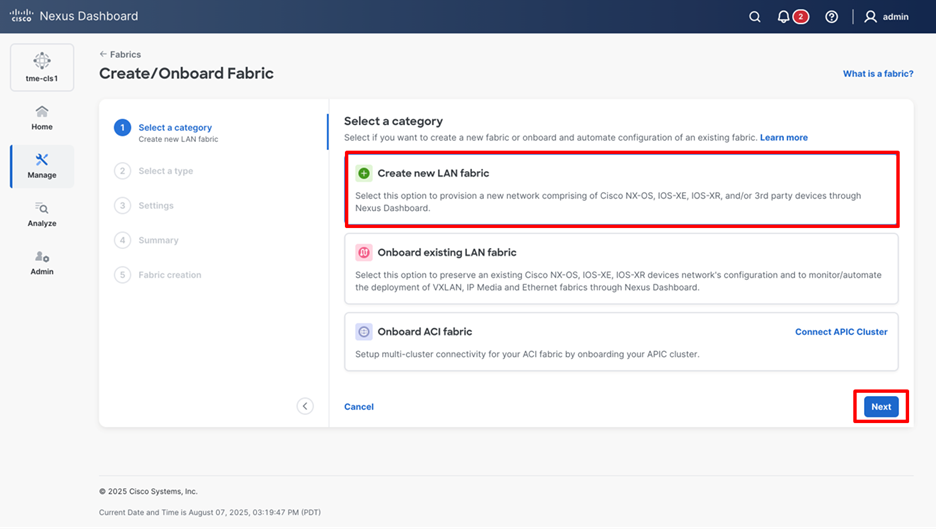
2. From Select a category, select Create new LAN fabric and click Next.
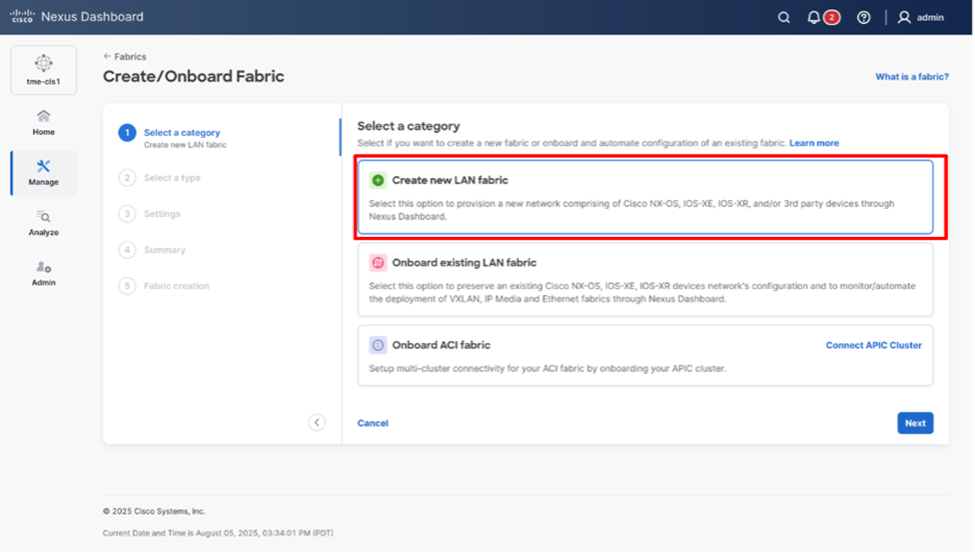
Selecting the desired fabric type
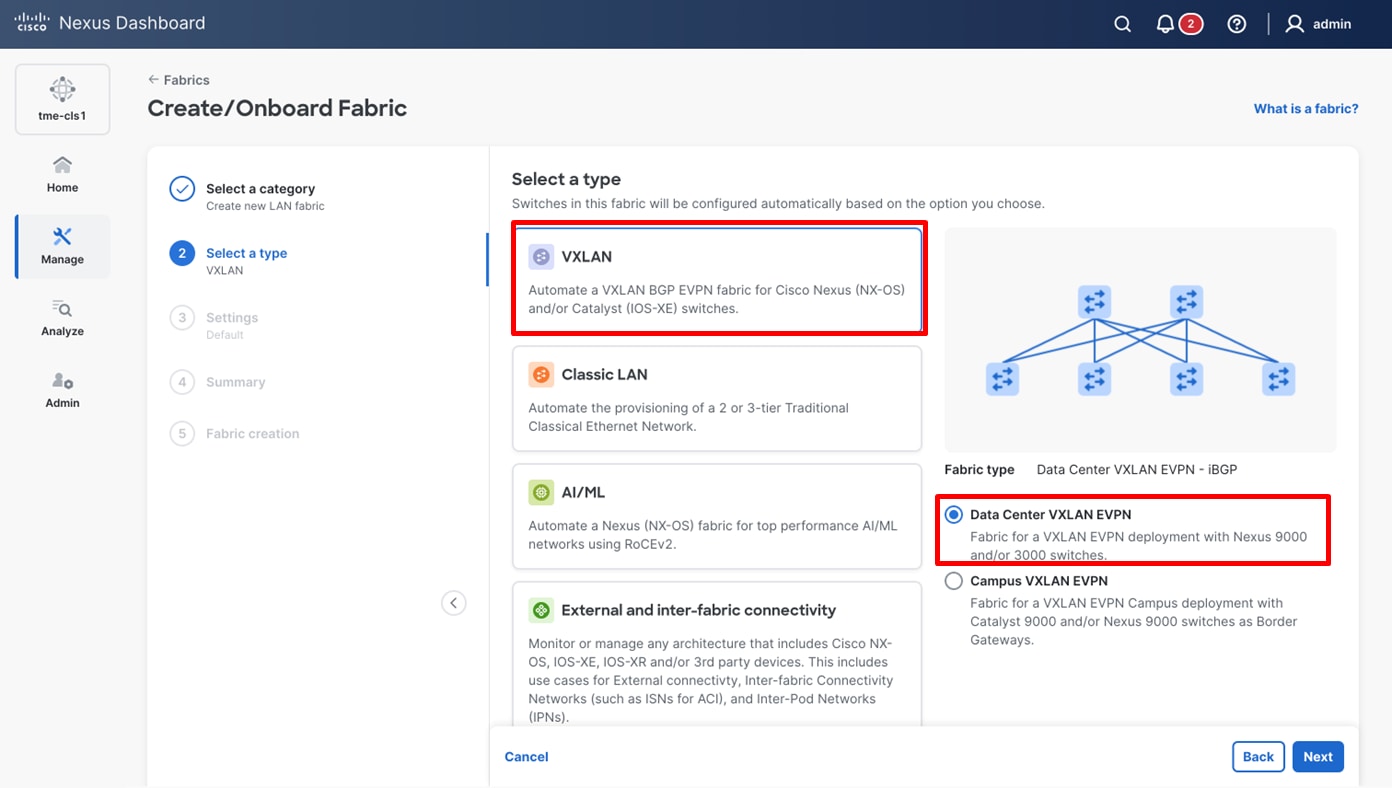
3. Select the template of interest and click Next.
Cisco Nexus Dashboard supports multiple fabric types (for example: Classic LAN, VXLAN fabrics and so on).
For this example, choose VXLAN > Data Center VXLAN EVPN fabric.
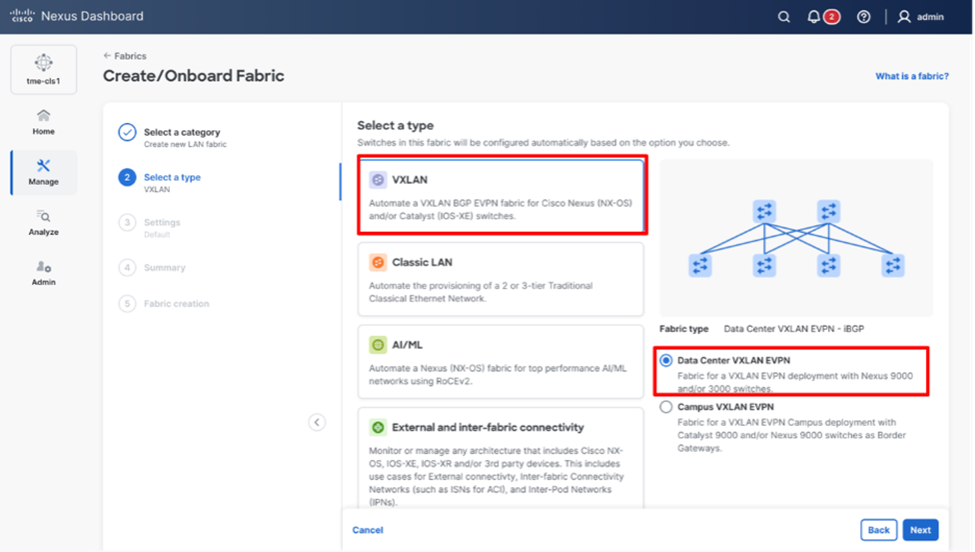
Selecting the desired fabric template
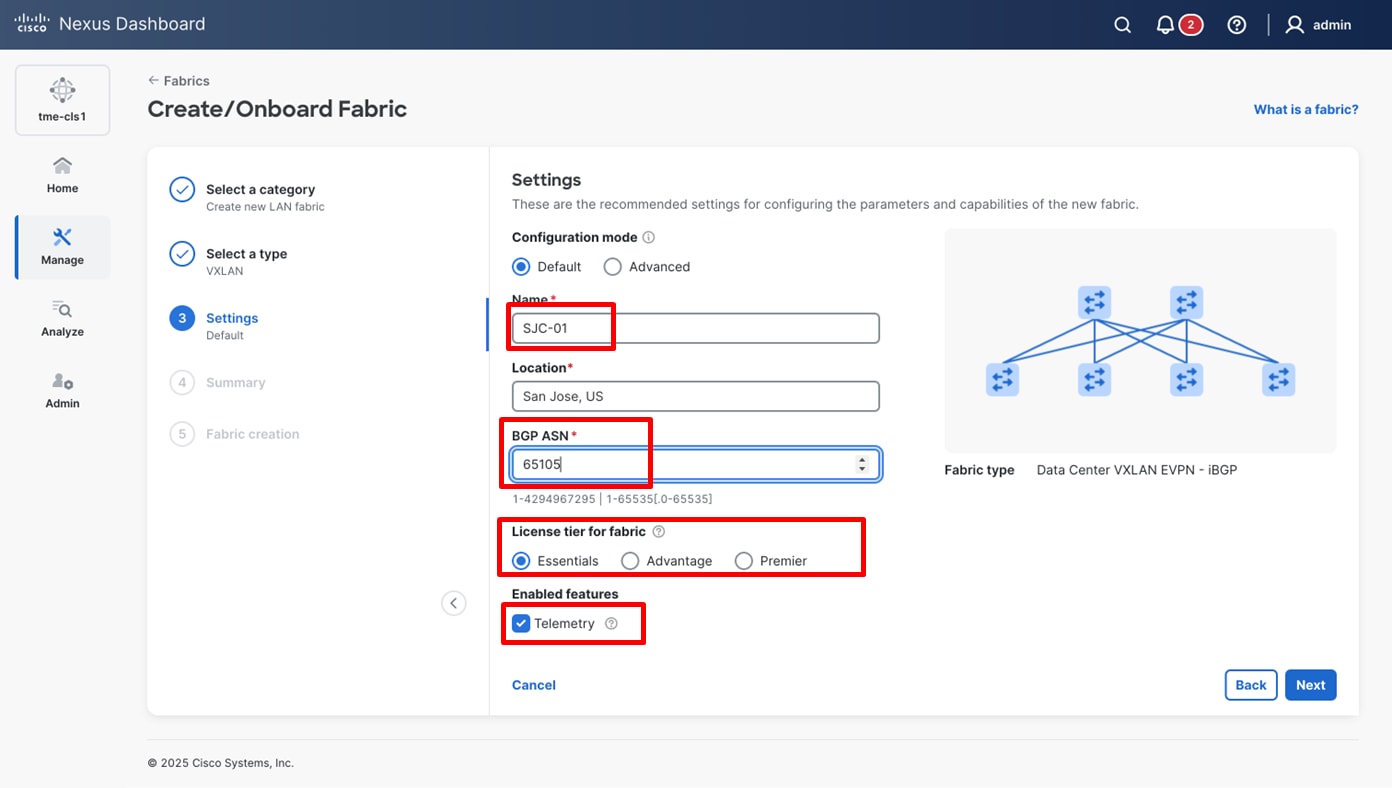
4. Enter basic details of the fabric such as the fabric Name and BGP ASN. Choose the appropriate license tier for your fabric. Cisco Nexus Dashboard 4.1 displays feature only based on the license tier that is selected.
5. From Enabled features, select Telemetry checkbox.
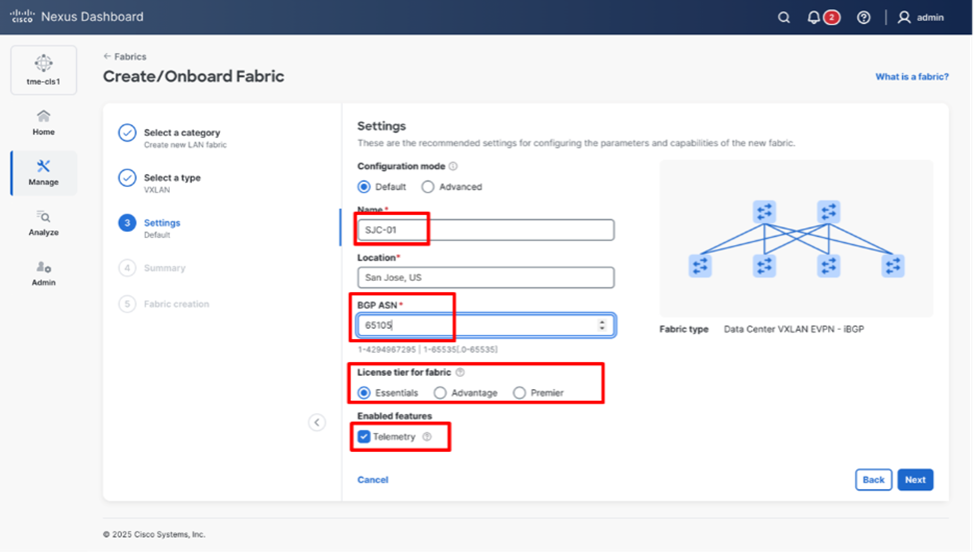
Entering the desired fabric configuration for BGP, licensing, and telemetry
6. With Cisco Nexus Dashboard, you have the option to stream telemetry from a fabric either using the in-band management or out-of-band management network in Advanced Settings. Here you choose out-of-band for configuring using this option. You specify the connection type in the GUI with the Telemetry Collection property. With out-of-band management, Cisco Nexus Dashboard and standalone NX-OS fabrics use the out-of-band management IP addresses of the switches. In this mode, there must be network connectivity from the out-of-band management addresses of the switches to the data subnet and persistent IP addresses in the data subnet of the Cisco Nexus Dashboard nodes.
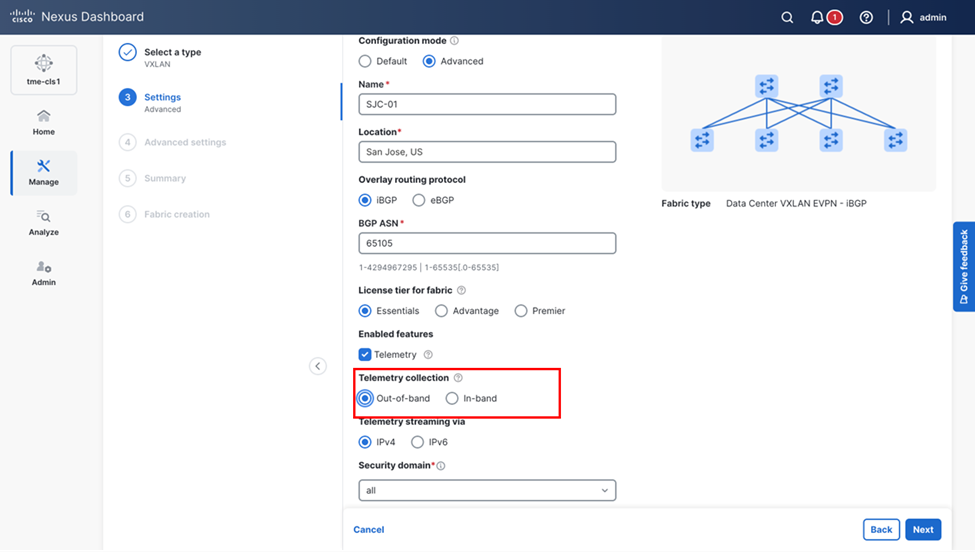
Entering the desired fabric configuration for BGP, licensing, and telemetry
7. Click Next > Submit.
Discover Switches in the Fabric
Cisco Nexus Dashboard uses a single seed or multiple IPs in the fabric and dynamically discovers the switches for a set number of hops defined in ‘Max Hops’ or also a list of all switch IPs in the fabric with a hop count ‘0’. It allows you to select the switches to be added to the fabric.
1. Navigate to Manage > Fabrics. Click the newly created Fabric name and then click Inventory tab. From the Actions drop-down list, select Add Switches
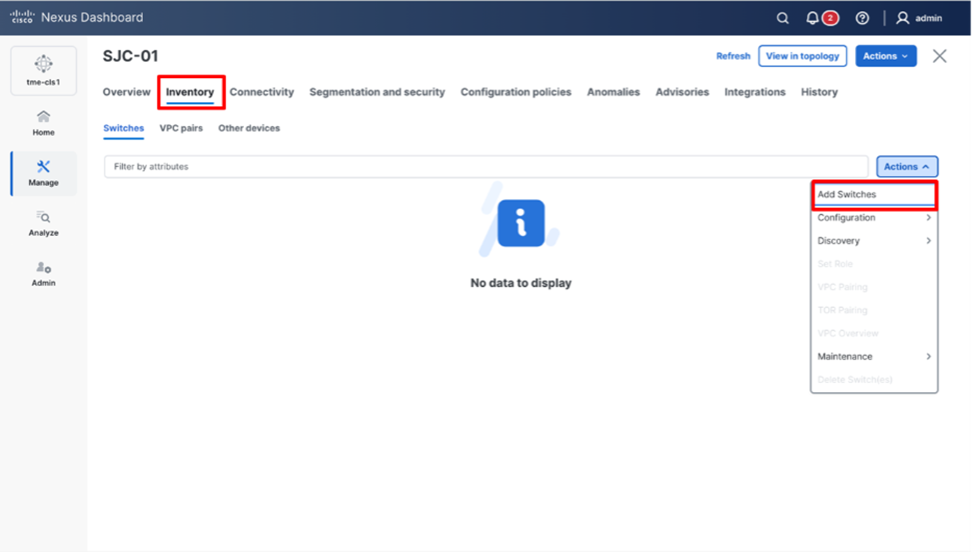
Adding switches to the fabric
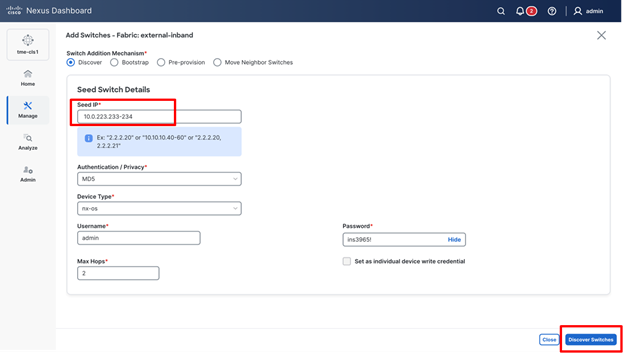
2. On the Add Switches screen, provide a Seed IP (IP address of mgmt0 interface) of any switch in the fabric to be discovered. Additionally, if you are discovering other switches through the seed switch, the other switch IP will be discovered through LLDP. It is also possible to discover each switch one by one.
3. Choose the Authentication protocol used to login to switches and provide Username/Password.
4. Select the number of hops from the seed to determine the detection boundary.
5. Check the Preserve Config check box to keep the existing configs on the switch (brownfield deployment) or uncheck the option to clean up the configuration on the switches (greenfield deployment).
6. Click Discover Switches.
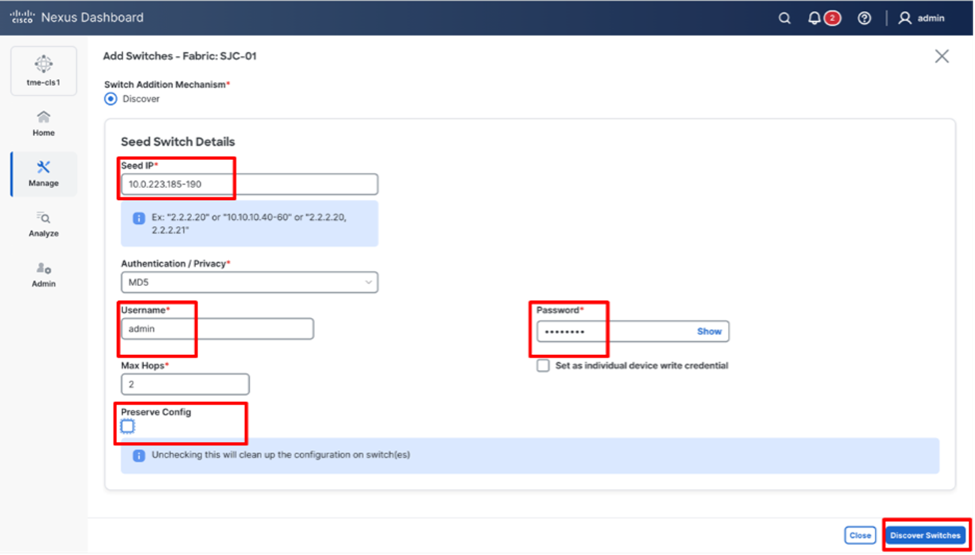
Discovering switches for the fabric
7. Select all the switches intended to be part of the fabric and click on Add Switches. The switches will appear on the Inventory > Switches tab of the fabric.
NOTE: For more information on adding switches, refer to the Cisco Nexus Dashboard User Content: https://www.cisco.com/c/en/us/td/docs/dcn/nd/4x/articles-411/editing-fabric-settings-data-center-vxlan.html#_adding_switches_2
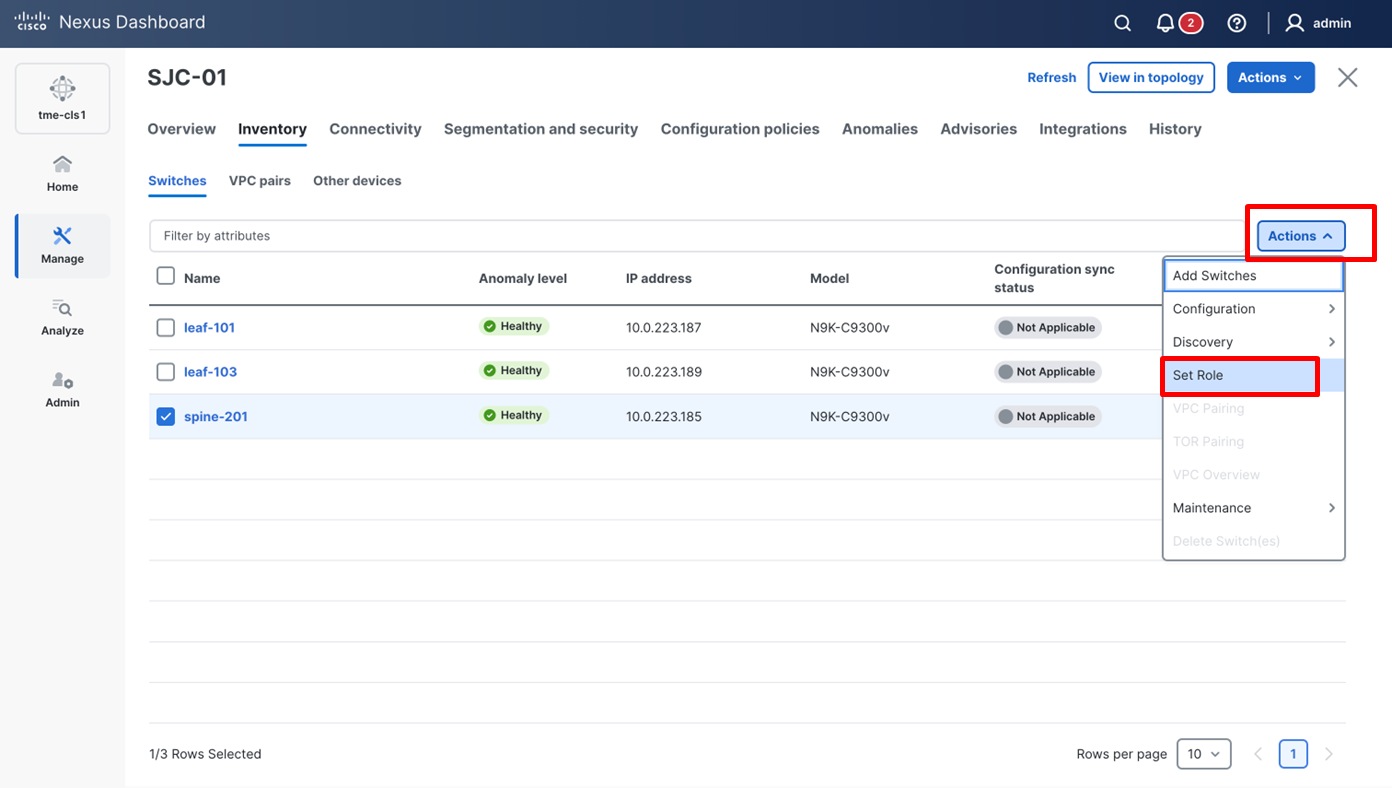
8. On the Switches page, click Actions > Set Role to assign roles to the switches. Alternatively, on the Topology page, right-click on the appropriate switch and assign roles.
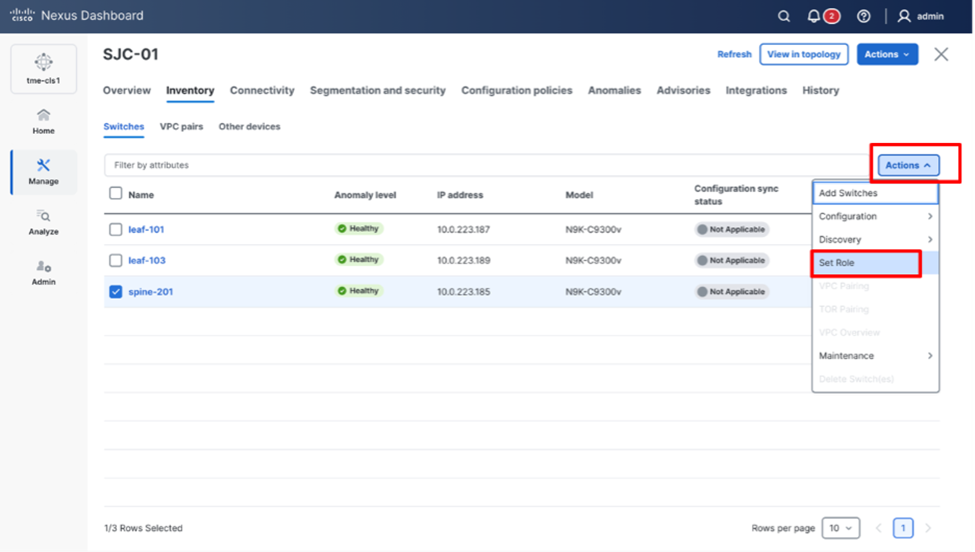
Assigning switch roles
9. From the pop-up page, choose the intended role and click Select.
Choosing switch roles
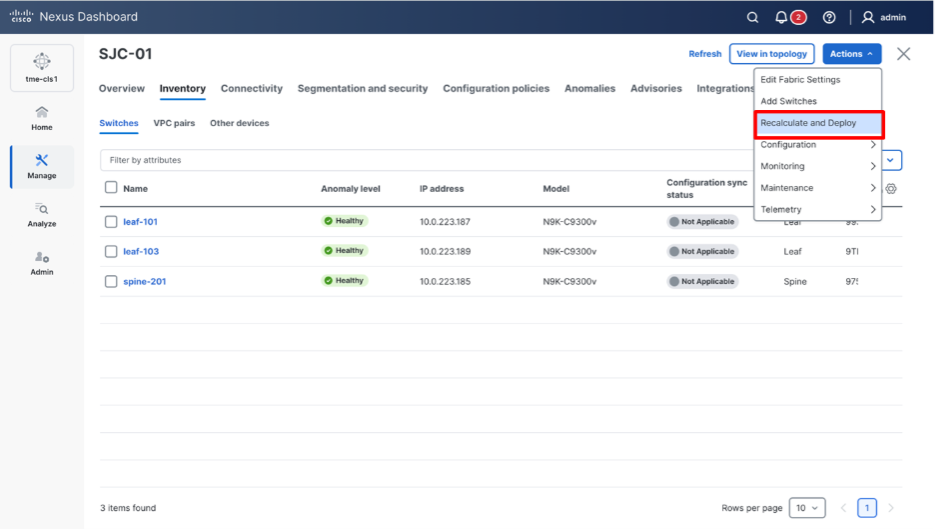
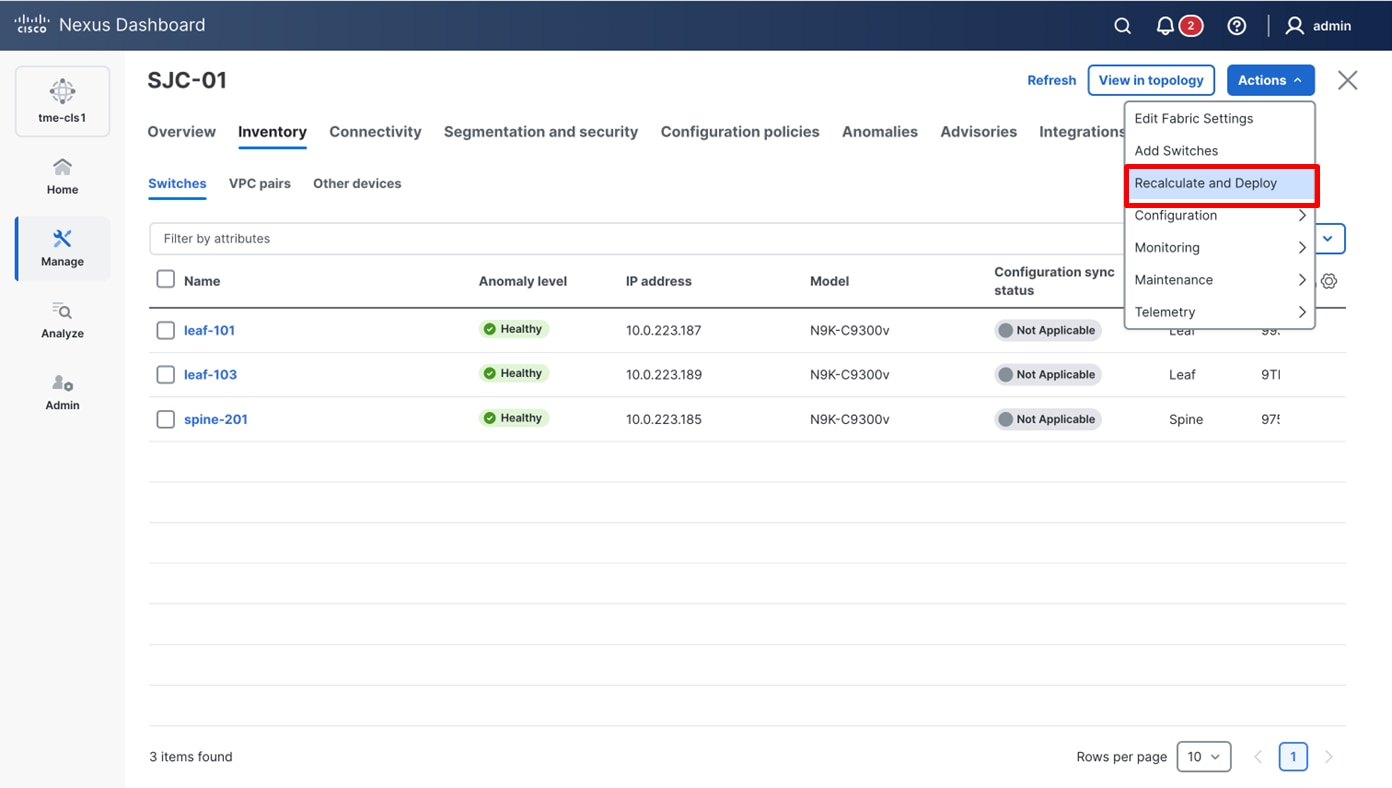
10. After setting the role on the Switches page, select the switches, and from Actions drop-down list, select Recalculate and Deploy.
Performing a “Recalculate and Deploy” on the fabric
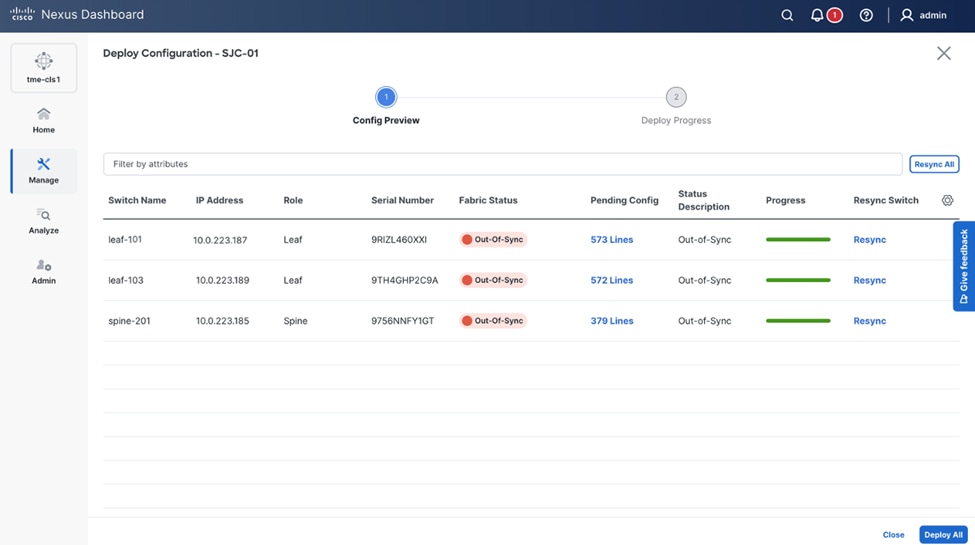
11. From the Deploy Configuration screen, preview the configurations by clicking on Pending Config and click Deploy All to be guided to the deployment progress screen.
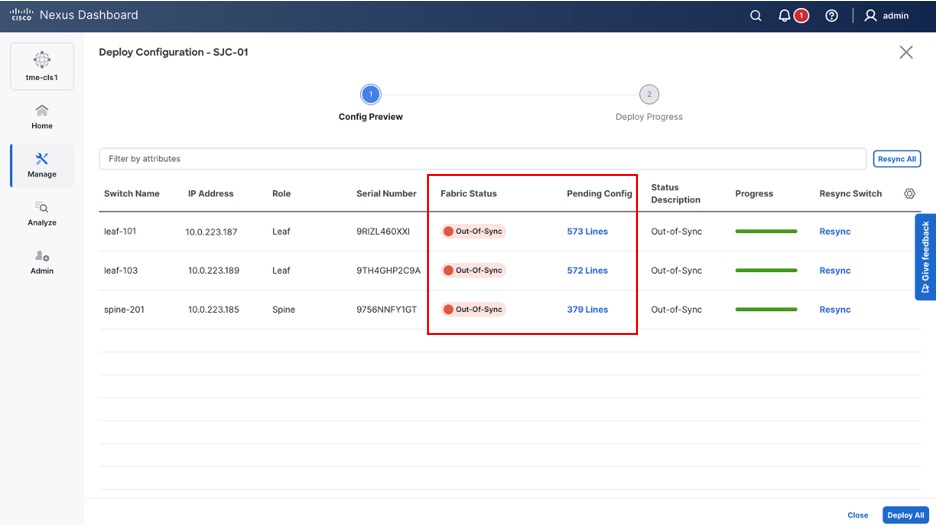
Verifying configuration and deploying to the fabric
12. Verify the Progress column to ensure the configuration is successfully deployed.
Verifying successful deployment of the configuration
Network Time Protocol (NTP) Configuration
For a network site managed by Cisco Nexus Dashboard, enable and configure NTP on Cisco Nexus Dashboard. This will push the NTP configs to all the switches.
1. Navigate to Manage > Fabrics and select the Fabric <fabric-name>.
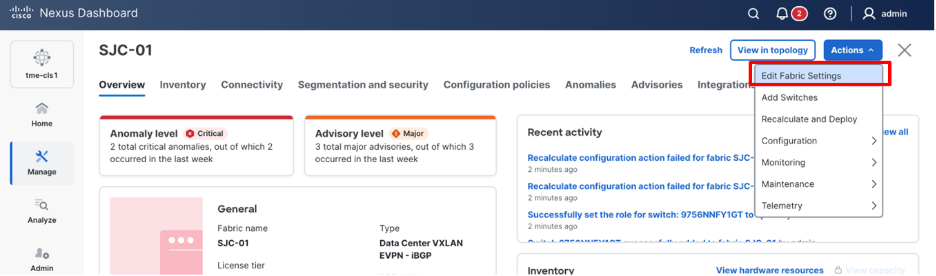
2. From Actions drop-down list, select Edit fabric settings.

Editing fabric settings
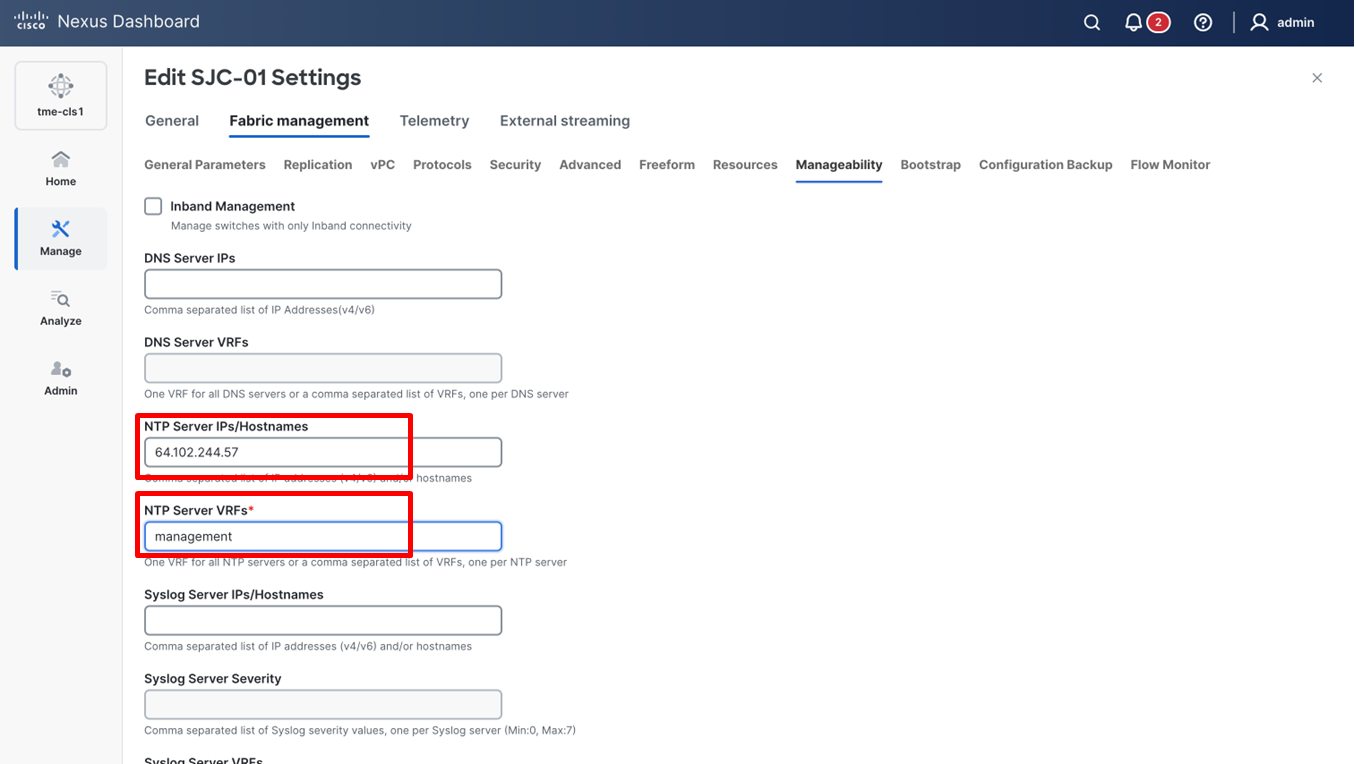
3. Go to Fabric management > Manageability tab to fill in the NTP server IP and VRF details and click Save.
Adding NTP server configuration
4. From the Actions drop-down list, select Recalculate and Deploy.
Precision Time Protocol (PTP) Configuration
Note: PTP is only required for Traffic Analytics and Flow Telemetry
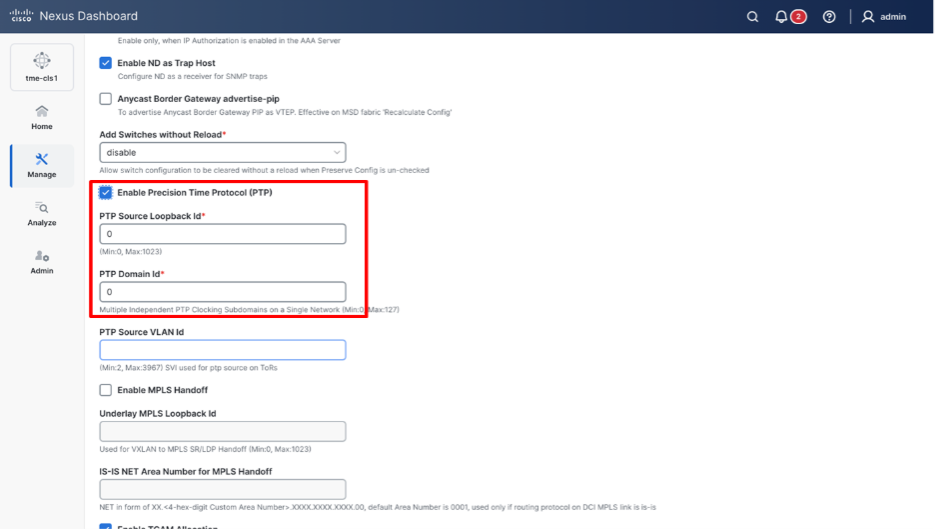
When PTP is enabled, it becomes the default clock even if NTP is enabled on the switches. PTP requires a source loopback used for exchanging PTP packets and a PTP domain ID that defines boundaries of the PTP messages. Once PTP is enabled on Cisco Nexus Dashboard, by default it uses loopback0 and the PTP domain ID as 0. This can be modified if the intent is to use a specific loopback or domain ID (different from loopback0 and domain ID 0) as well. If there is a specific SVI used for PTP source on top of rack switches (ToRs), the PTP source VLAN ID field can be updated in the PTP configuration on Cisco Nexus dashboard. These configuration parameters are shown in the configuration screenshot below. PTP grandmaster can be within the fabric for independent fabrics, but it is mandatory to have an external PTP grandmaster for multi-fabric deployments. To learn more about the role of PTP in Cisco Nexus Dashboard, follow this whitepaper - https://www.cisco.com/c/en/us/td/docs/dcn/whitepapers/precision-time-protocol-for-cisco-nd-insights.html.
Cisco Nexus Dashboard offers easy site setup for enabling PTP.
1. Navigate to Manage > Fabrics and select the Fabric <fabric-name>. From the drop-down list, select Edit fabric settings.
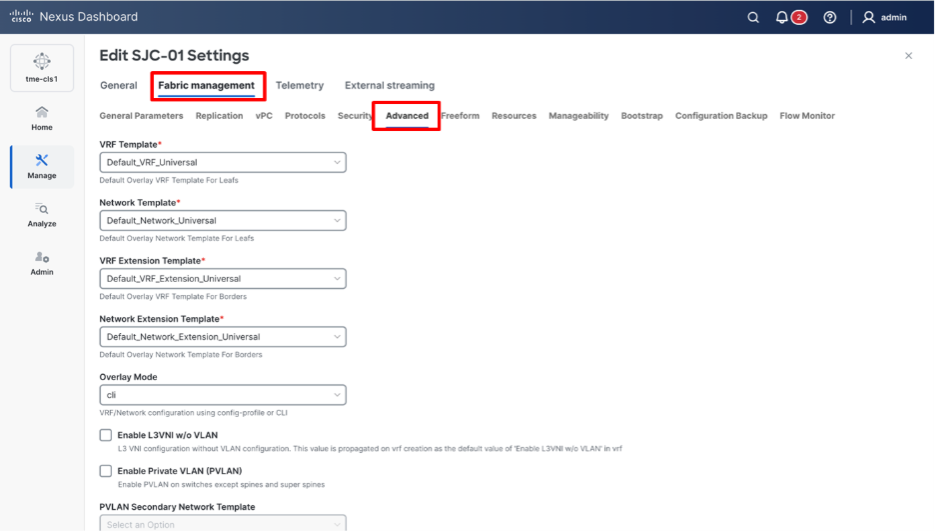
2. Click Fabric management > Advanced tab and check Enable Precision Time Protocol (PTP) check box.
Advanced tab
3. Provide the PTP Source Loopback Id and PTP Domain Id and click Save. This enables PTP globally and on the core-facing interfaces.
Adding PTP server configuration
4. From the Actions drop-down list, select Recalculate and Deploy to ensure switches are configured with the required PTP settings as configured in Cisco Nexus Dashboard.
NTP and PTP verifications
To verify PTP status on Cisco Nexus Dashboard
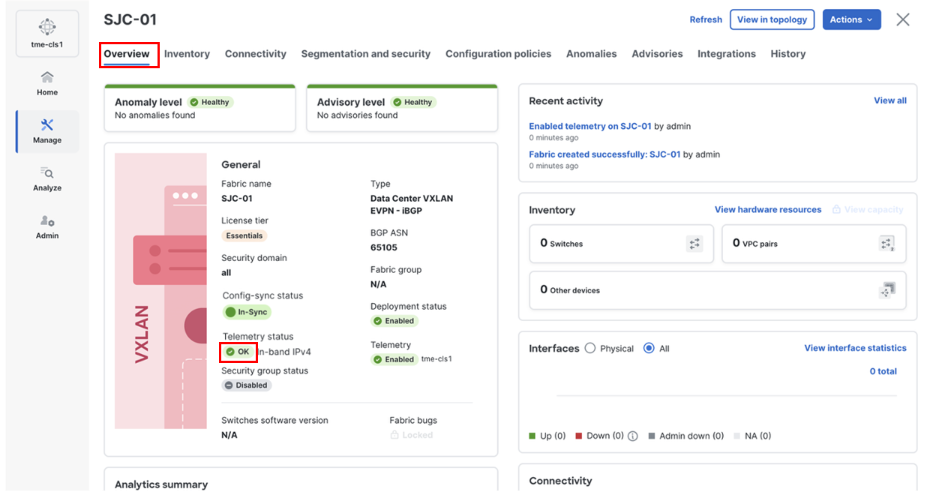
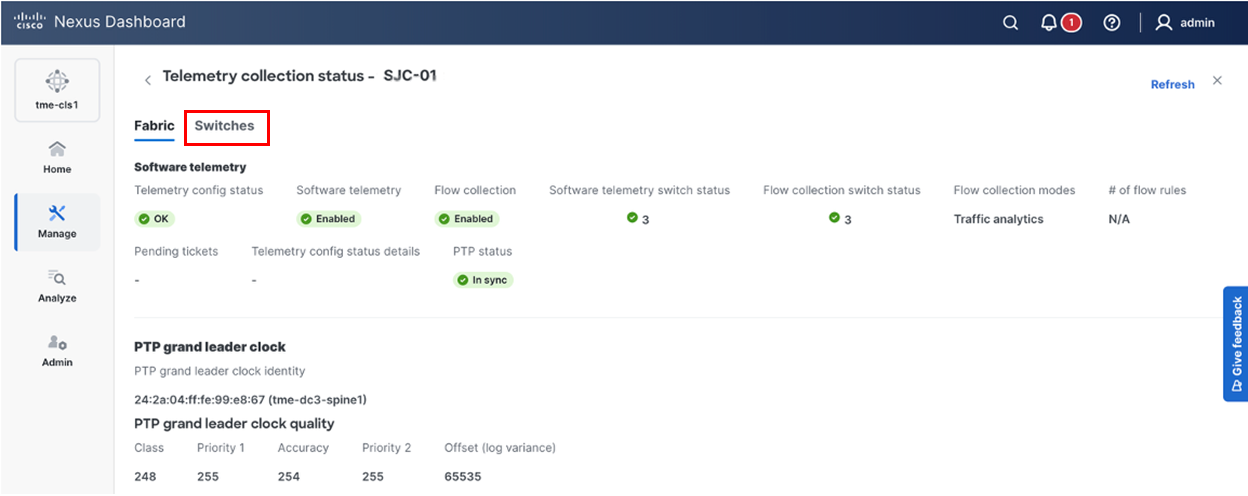
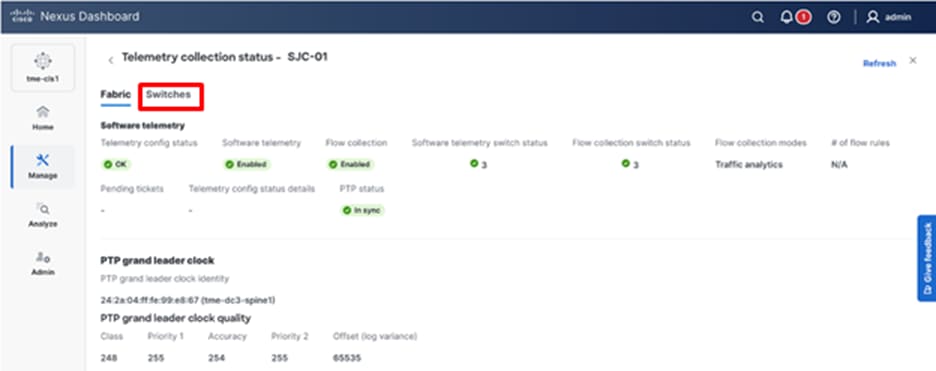
1. To verify PTP, navigate to Manage > Fabrics > <fabric-name> (SJC-01 in this example) > Overview > Telemetry Status > OK/Not OK.
Verifying Telemetry status “OK”
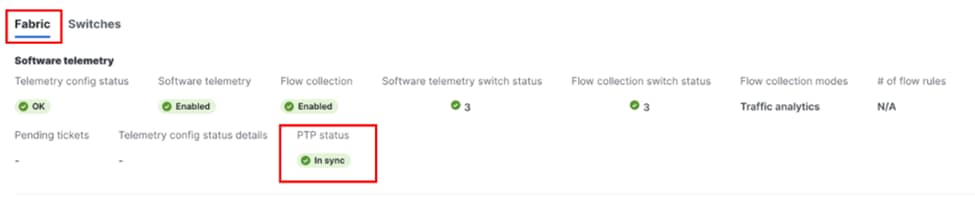
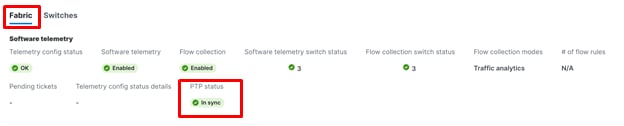
2. Click Fabric, check the PTP status. It should show In sync.
Verifying PTP status “OK”
To verify the NTP and PTP status on the switches
With both managed and monitored mode fabrics, verifications on the switch remain the same.
· NTP verifications: SSH to the switches to confirm the configuration and clock settings. Verify using the commands below for NTP setup on the switch as the clock time source.
leaf-101(config)# show run ntp
!Command: show running-config ntp
!No configuration change since last restart
!Time: Sun Feb 6 21:54:40 2022
version 9.3(7) Bios:version 05.40
ntp server 64.102.244.57 use-vrf management -> Verify the configuration
leaf-101(config)# show clock
21:53:34.997 UTC Sun Nov 2 2025
Time source is NTP -> Verify NTP is the time source
leaf-101(config)# show ntp peers
----------------------------------------------------
Peer IP Address Serv/Peer
----------------------------------------------------
64.102.244.57 Server (configured) -> Verify the server is configured
• PTP Verifications: After enabling PTP either through Nexus Dashboard or CLI configurations, verify the status of PTP using the commands below for PTP.
leaf-101# show run ptp
feature ptp. -> Verify that PTP is enabled and configured on the interfaces
ptp source 10.0.0.1
ptp domain 0
interface Ethernet1/1
ptp
interface Ethernet1/33
ttag
ttag-strip
leaf-101# show clock
01:56:04.353 UTC Sun Nov 2 2025
Time source is PTP -> Verify PTP is the time source
leaf-101# show ptp clock foreign-masters record
P1=Priority1, P2=Priority2, C=Class, A=Accuracy,
OSLV=Offset-Scaled-Log-Variance, SR=Steps-Removed
GM=Is grandmaster
---------- ------------------- --- ---- ---- --- ----- ----------
Interface Clock-ID P1 P2 C A OSLV SR
---------- ------------------- --- ---- ---- --- ----- ----------
Eth1/1 2c:4f:52:ff:fe:56:61:1f 255 255 248 254 65535 1
-> Verify if it can reach the grand master on its ptp configured interfaces
leaf-101# show ptp clock
PTP Device Type : boundary-clock
PTP Device Encapsulation : NA
PTP Source IP Address : 10.2.0.1 -> Verify if source loopback IP is as configured
Clock Identity : d4:78:9b:ff:fe:19:87:c3
Clock Domain: 0
Slave Clock Operation : Two-step
Master Clock Operation : Two-step
Clave-Only Clock Mode : Disabled
Number of PTP ports: 3
Priority1 : 255
Priority2 : 255
Clock Quality:
Class : 248
Accuracy : 254
Offset (log variance) :
Offset From Master : 12
Mean Path Delay : 168
Steps removed : 2
Correction range : 100000
MPD range : 1000000000
Local clock time: Fri Aug 29 01:56:08 2025
PTP clock state : Locked
leaf-101# show ptp parent
PTP PARENT PROPERTIES
Parent Clock:
Parent Clock Identity: 2c:4f:52:ff:fe:56:61:1f
Parent Port Number: 4
Observed Parent Offset (log variance): NA
Observed Parent Clock Phase Change Rate: N/A
Parent IP: 10.2.0.4
Grandmaster Clock:
Grandmaster Clock Identity: 00:ee:ab:ff:fe:3a:16:e7 -> Get the Grandmaster clock ID
Grandmaster Clock Quality
Class : 248
Accuracy : 254
Offset (log variance) : 65535
Priority1: 255
Priority2: 255
spine-201# show ptp clock foreign-masters record
P1=Priority1, P2=Priority2, C=Class, A=Accuracy,
OSLV=Offset-Scaled-Log-Variance, SR=Steps-Removed
GM=Is grandmaster
---------- --------------------- --- ---- ---- --- ----- ----------
Interface Clock-ID P1 P2 C A OSLV SR
---------- --------------------- --- ---- ---- --- ----- ----------
Eth1/4 00:ee:ab:ff:fe:3a:16:e7 255 255 248 254 65535 1 GM
-> Check the Grandmaster clock ID and confirm the right Grandmaster registration on the clients
Verification of Successful Telemetry Deployment
1. After you deploy the configurations, the Telemetry displays “Enabled” and the Telemetry status displays “OK” on the fabric Overview page. This indicates that you successfully configured telemetry for the fabric.
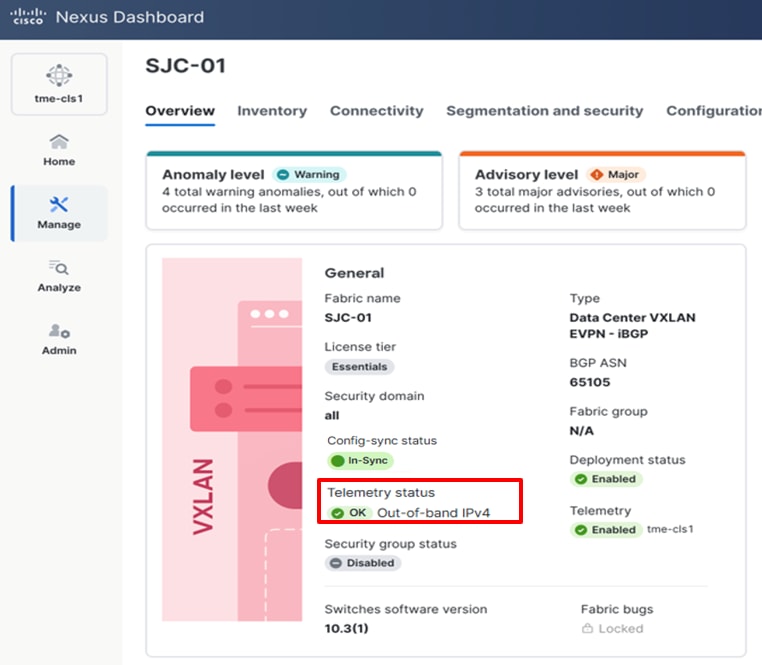
Verification of Telemetry Status for a fabric on Cisco Nexus Dashboard
2. To know the deployed configuration, view Telemetry Status “OK,” then click Switches tab.
Navigating to Switches tab
3. Scroll to the right to the individual switches and click on the Expected configuration to view the configuration deployed on the switches.
Viewing Expected configuration
4. Verify the Software Telemetry tab for the configuration deployed on the switches.
Reviewing the telemetry configuration
Option 2 – Configuration via Out-of-Band Network, Telemetry via In-band Network
Cisco Nexus Dashboard also supports streaming telemetry using an in-band network, and the primary drivers for choosing this method over out-of-band are the following:
1. The data and management subnets do not have IP reachability to each other. Some examples might be:
a. This is a lab deployment, and the out-of-band network is a corporate network whereas the in-band network is an isolated Layer 3 network.
b. The out-of-band network does not support 10/25G SFP+ interfaces that are provided on the Cisco Nexus Dashboard Data nodes, and IP connectivity cannot be established between the out-of-band network, and infrastructure that provides the SFP+ connectivity. In this case, you might plug these interfaces into a separate network that supports that form factor and leave it isolated from the out-of-band network.
2. Flow telemetry is a required feature for your environment, or the switches are not running 10.4(2) or later that supports Traffic Analytics (TA), or 10.5(2) that supports TA plus on-demand flow collection.
3. The environment already has Cisco Nexus Dashboard 3.2 or previous versions deployed, and telemetry is already being streamed using in-band network.
4. The intent is to use Cisco Nexus Dashboard management interface for controller functionalities, and Cisco Nexus Dashboard data interface for telemetry streaming.
Logical network topology shows Nexus Dashboard management and data networks connected to different switches and isolated from each other.
Note: If you have Cisco Nexus Dashboard 3.2 with telemetry enabled using the in-band network, upgrading to Cisco Nexus Dashboard 4.1 maintains the in-band telemetry functionality. You do not need to perform additional configuration unless you want to change the telemetry streaming network from in-band to out-of-band.
Using the in-band network requires additional fabric configuration to build Layer 3 (L3) connections on the front-panel interfaces and advertise Internet Protocol (IP) Loopback addresses from the fabric switches.
Prepare a Cisco Nexus Dashboard managed network site for streaming telemetry. Follow these steps:
· Configure Routes and LAN Device Connectivity Policy
· Create fabric
· Discover switches
· Create Layer 3 routing for In-band Network and Loopbacks
· Configure NTP
· Configure PTP
Configure Routes and LAN Device Connectivity Policy
By default, Cisco Nexus Dashboard cluster will use the data network to provide syslog, SNMP, POAP bootstrap and telemetry access to and from the switches. In this example, since the networks are isolated, the desired outcome is to use the management network for communicating to the switches for controller functionality, while leveraging the data network for telemetry only. This is different from the out-of-band scenario, where both management and data are IP reachable.
To do this, you will need to change the LAN Device Connectivity Policy from the default value “Data” to “Management.” You can modify the settings from Admin > System Settings > Fabric Management > Advanced Settings > Admin > LAN Device Management Connectivity.
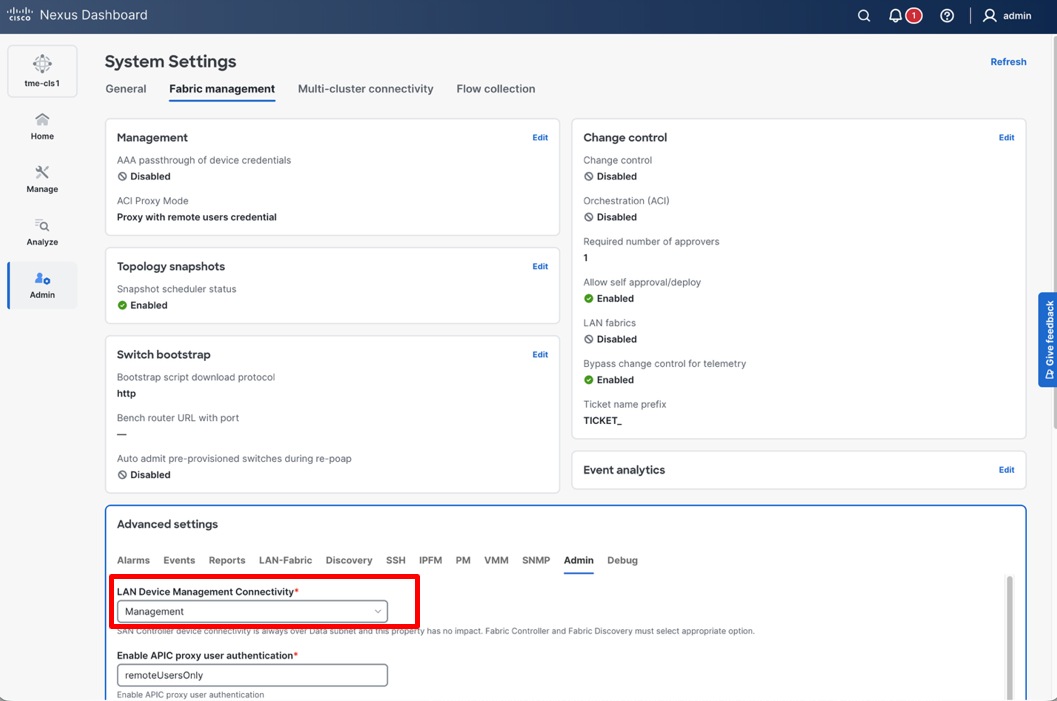
LAN Device Management Connectivity policy is set to Management
This policy requires that the persistent IP addresses used for SNMP trap and syslog, and switch bootstrap, are in the management IP address pool for the persistent IPs. After changing this setting, ensure there are two available PIPs in the management subnet.
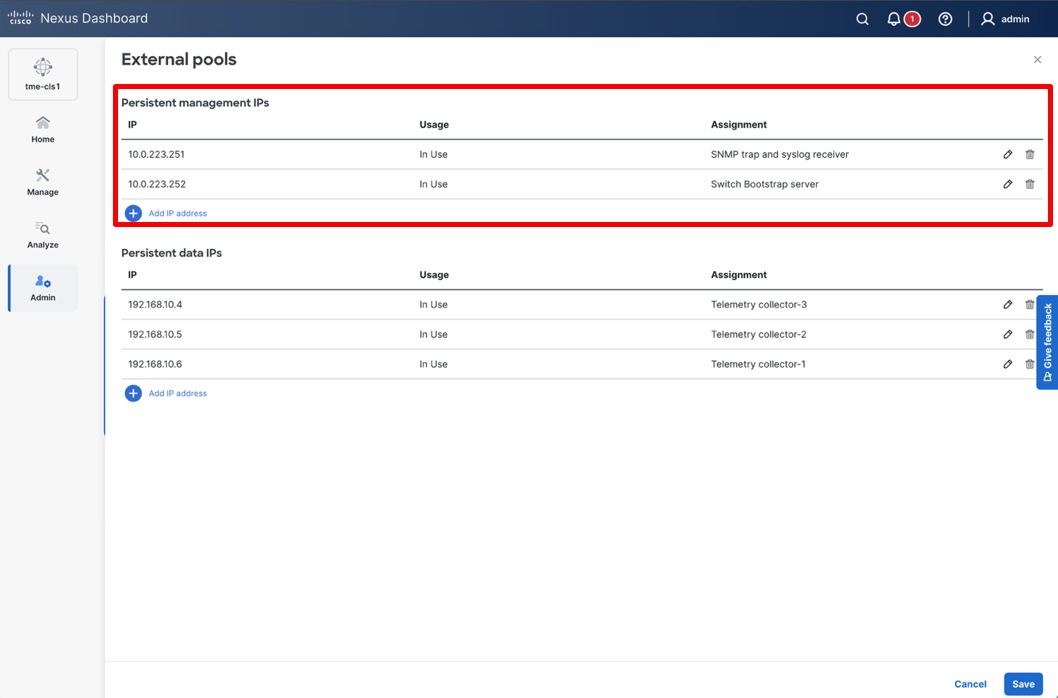
Verifying Persistent Ips in the management subnet
If switches are on a different subnet than the Cisco Nexus Dashboard management interface, you must configure a static route. Configure this route in the Cisco Nexus Dashboard management network to point to the switch mgmt0 subnet. This route allows Cisco Nexus Dashboard to discover and onboard the NX-OS switches. Without this route, the nodes attempt to communicate with the 192.0.2.0/24 subnet using the default route on the data interfaces. This fails because no Internet Protocol (IP) connectivity exists between the out-of-band and data network infrastructures. To add the route, navigate to Admin > System Settings > Management Routes > Edit > Add Management Network Routes > Save.
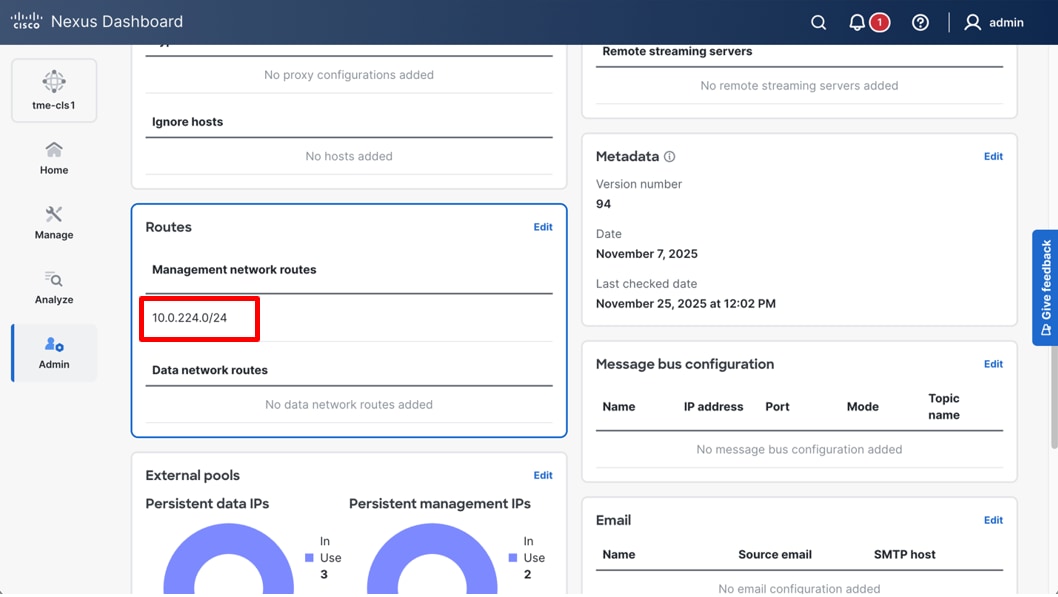
Editing Management subnet routes
Create Fabric
1. Navigate to Manage > Fabrics, from Actions drop-down list, select Create fabric.
Creating a new fabric
2. From Select a category select Create new LAN fabric and click Next
Creating a new LAN fabric
3. Select the template and click Next. Cisco Nexus Dashboard supports multiple fabric types (for example: Classic LAN, VXLAN fabrics and so on). For this whitepaper, you select Data Center VXLAN EVPN fabric.
Choosing the type of fabric
4. Enter basic details of the fabric, like the fabric Name and BGP ASN and choose the appropriate license tier for your fabric.
5. From Enabled features, select Telemetry check box.

Entering the desired fabric configuration for BGP, licensing, and telemetry
6. In Advanced Settings, select the in-band management network to stream telemetry from the fabric.
Cisco Nexus Dashboard can stream telemetry from a fabric using either the in-band or out-of-band management network. Telemetry Virtual Routing and Forwarding (VRF) instance sources and manage telemetry data from Cisco Nexus devices. By default, telemetry is sourced through the Loopback0 interface in the “default” VRF. You can also define a dedicated telemetry VRF and telemetry loopbacks for more granular control.
Use the default “default” VRF and “Loopback0” settings, and then click Next.
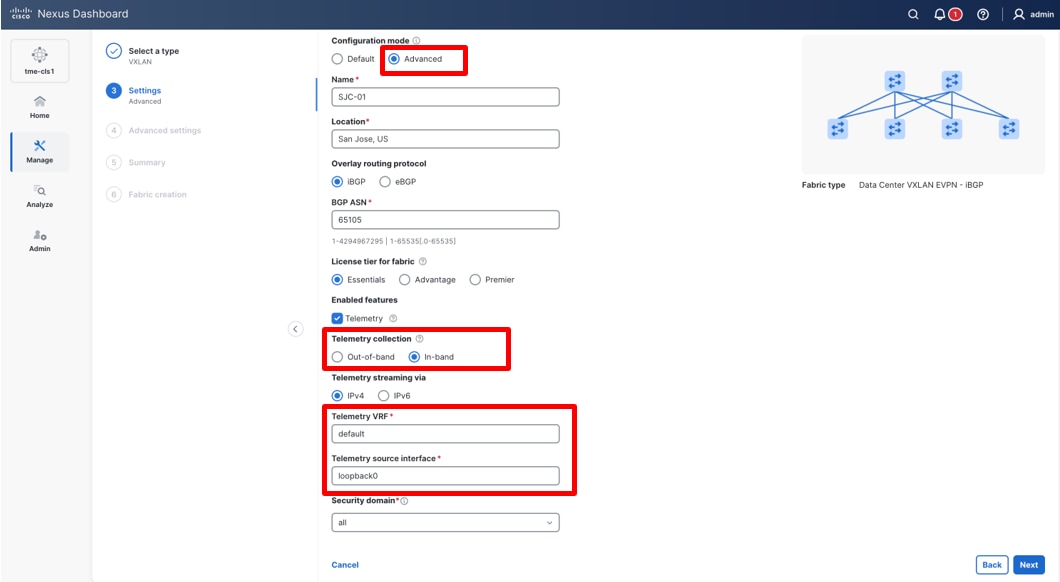
Choosing the telemetry collection method, in this example: in-band
7. Click Submit.
Discover Switches in the Fabric
Cisco Nexus Dashboard uses a single seed or multiple IPs in the fabric and dynamically discovers the switches for a set number of hops defined in ‘Max Hops.’ It allows you to select the switches to be added to the fabric. By default, the switch discovery process will show switches that are 2 hops away from the seed switch. You can change the default setting using the Number of Hops drop-down list.
1. Navigate to Manage > Fabrics. Click on the newly created Fabric name and click Inventory > Switches. From the Actions drop-down list, select Add switches.
Adding switches to the fabric
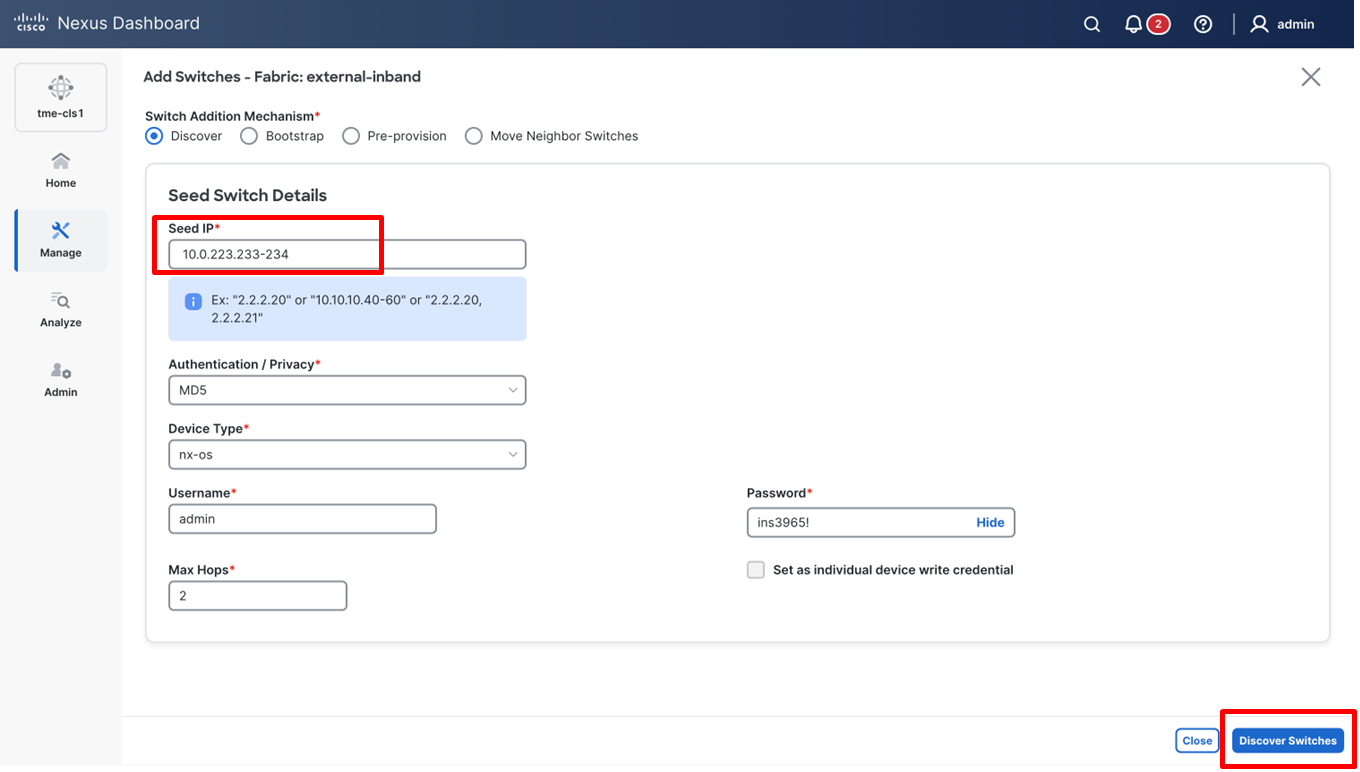
2. On the Add switches screen, provide a Seed IP (IP address of mgmt0 interface) of any switch in the fabric to be discovered. Additionally, if you are discovering other switches through the seed switch, the other switch IP will be discovered through LLDP. It is also possible to discover each switch one by one.
Discovering switches for the fabric
3. Choose the Authentication / Privacy used to login to switches and provide Username and Password.
4. Select the Max hops from the seed to determine the detection boundary.
5. Check the Preserve config check box to keep the existing configs on the switch (brownfield deployment) or uncheck the option to clean up the configuration on the switches (greenfield deployment).
6. Click Discover switches.
7. Select all the switches intended to be part of the fabric and click Add switches. The switches will now show up on the Inventory > Switches tab of the fabric.
8. On the Switches page, click Actions > Set Role to assign roles to the switches. Alternatively, on the Topology page, right-click on the appropriate switch and assign roles.
Set role for the switches
9. From the pop-up page, choose the intended role and click Select.

Choosing switch roles
10. After setting the role, on the Switches page, select the switches, from Actions drop-down list, select Edit fabric settings.
Performing a Recalculate and Deploy
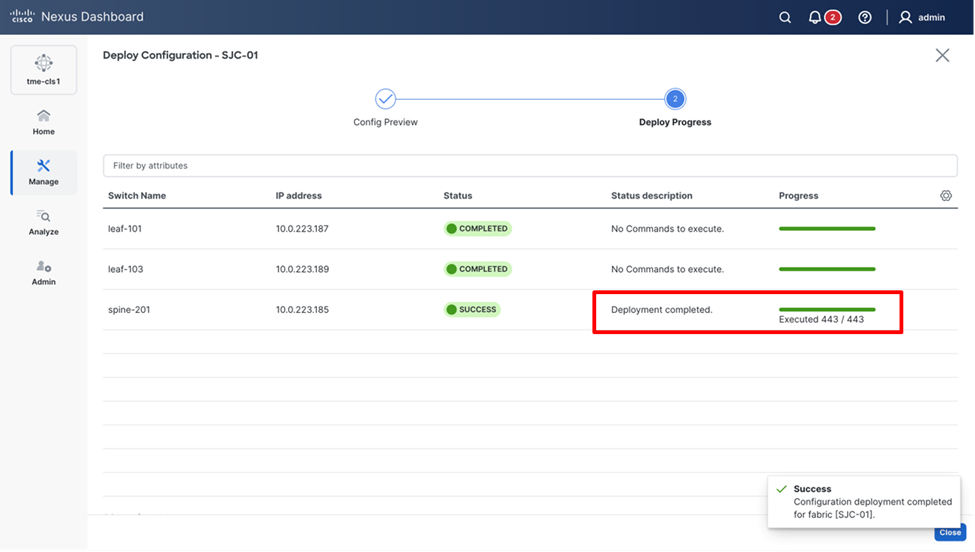
11. From the Deploy Configuration screen, preview the configurations by clicking on Pending Config and click Deploy All to be guided to the deployment progress screen.

Deploying the configuration
12. Verify the Status description for successful deployment.
Deployment completed successfully
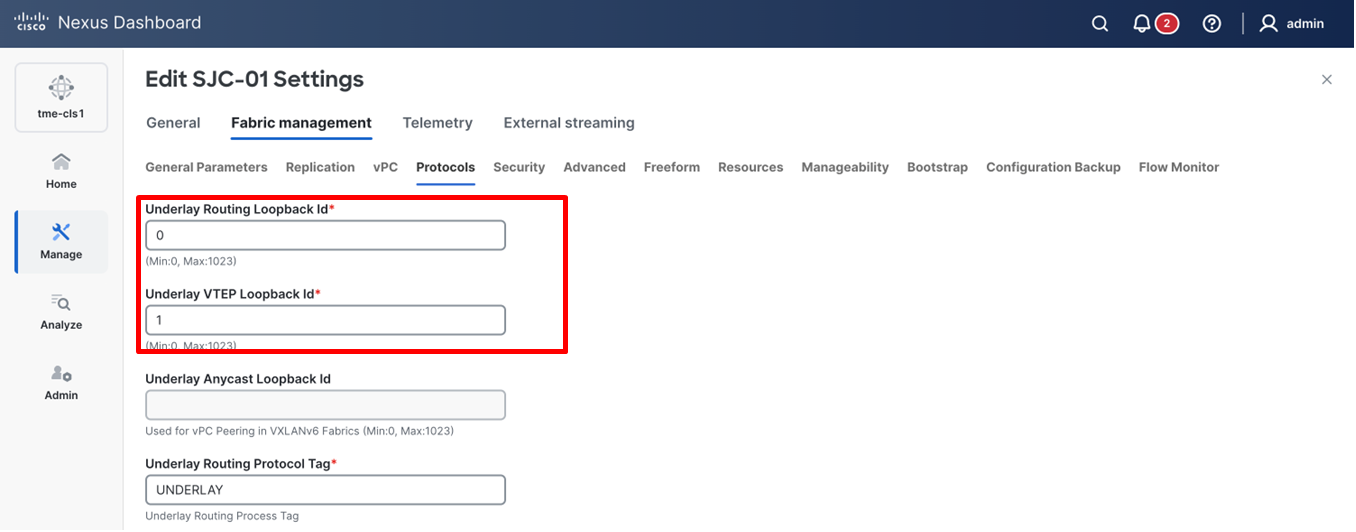
Identify Loopback Interfaces
For managed fabrics, Cisco Nexus Dashboard deploys an underlay routing loopback and a Virtual Tunnel Endpoint (VTEP) loopback on the switches. To deploy in-band telemetry for the site, you can use either loopback. By default, Cisco Nexus Dashboard uses Loopback0 (Border Gateway Protocol (BGP) loopback) when Internet Protocol (IP) reachability to the Cisco Nexus Dashboard cluster data network exists.
1. Navigate to Manage > Fabrics, click a fabric, from Actions drop-down list, choose Edit fabric settings.
Edit Fabric Settings
2. Go to Fabric management > Protocols, update the value for Underlay Routing Loopback Id and click Save.
Viewing loopbacks for the fabric switches
Create Layer 3 Routing for In-Band Network and Loopbacks
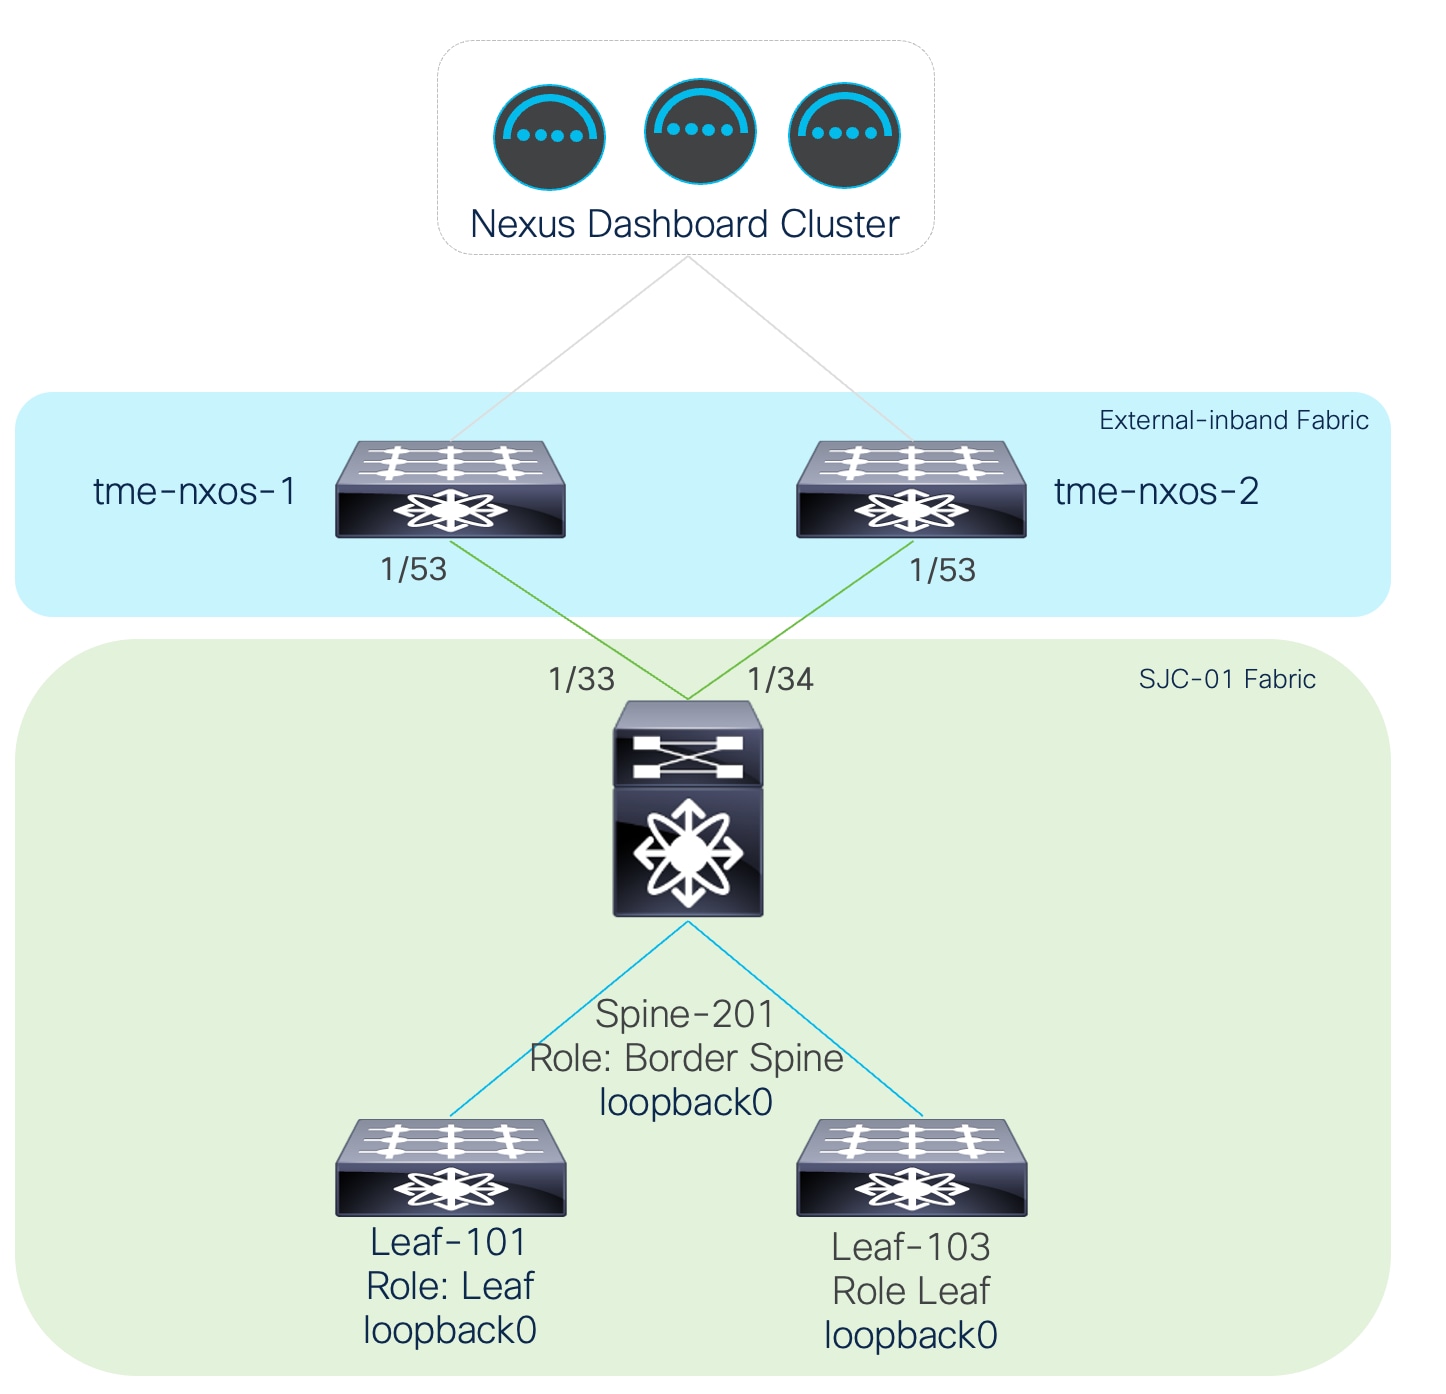
Since you are using a dedicated in-band network to stream telemetry from the switches (front-panel) interface using a loopback, the switches and Cisco Nexus Dashboard data network should have routed network connectivity via the infrastructure. You have added an example of physical topology based on the example being used in this whitepaper.

Example of physical topology for in-band telemetry to Cisco Nexus Dashboard
Note: In this example, you are using an external network that has been onboarded onto Cisco Nexus Dashboard in managed mode. (Verification of whether the external fabric being used is in managed or monitored mode can be found under Manage > Fabrics > Fabric Name > Actions > Edit Fabric Management > Fabric Monitor mode.) The external fabric as shown in the topology diagram is the fabric that acts as an external Layer 3 network between the VXLAN-EVPN fabric (SJC-01 in this example) and Cisco Nexus Dashboard.
Note: Cisco Nexus Dashboard uses the “border” role to represent switches that will have external Layer 3 connections to an edge or core external fabric. In this example, a border spine is used, however it is equally common to use border leaf nodes and have the external fabric connected to those leaf switches instead.
First verify the details on this external (external-in-band fabric in this example) fabric.
1. Navigate to Manage > Fabrics > <fabric name>(external-in-band in this example) > Inventory.
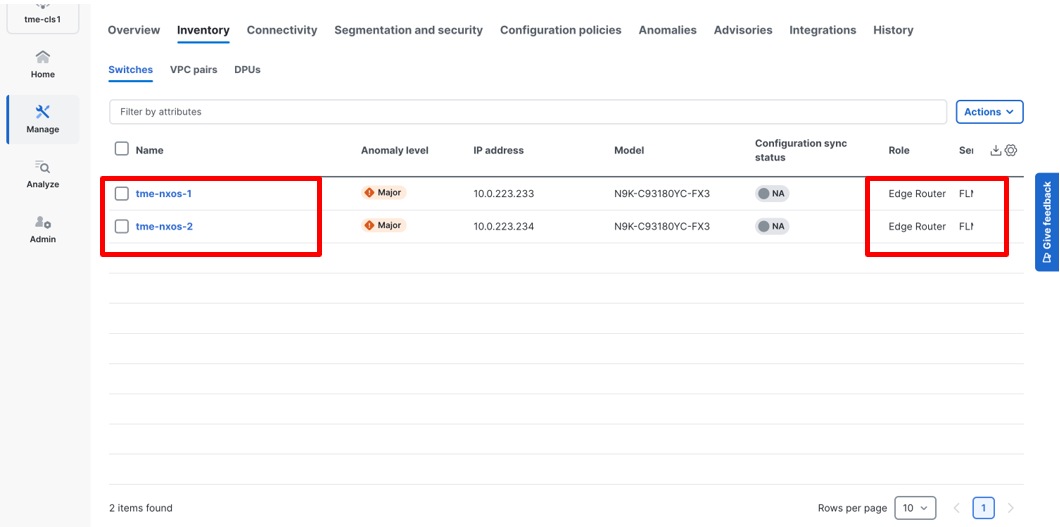
Viewing inventory for external fabric
2. Verify the displayed fabric switches that are onboard in the fabric. The Role column displays it as the “Edge Router.”
Establish connectivity between the Loopback0 interface on the VXLAN-EVPN (SJC-01) fabric switches and the Cisco Nexus Dashboard data network using the external Layer 3 network. Follow these steps to configure the connectivity.
1. After creating the fabrics and performing all the above steps, navigate to Manage > Fabrics > <fabric name> > Edit fabric settings.
Editing fabric settings
2. Navigate to Fabric management > Resources.
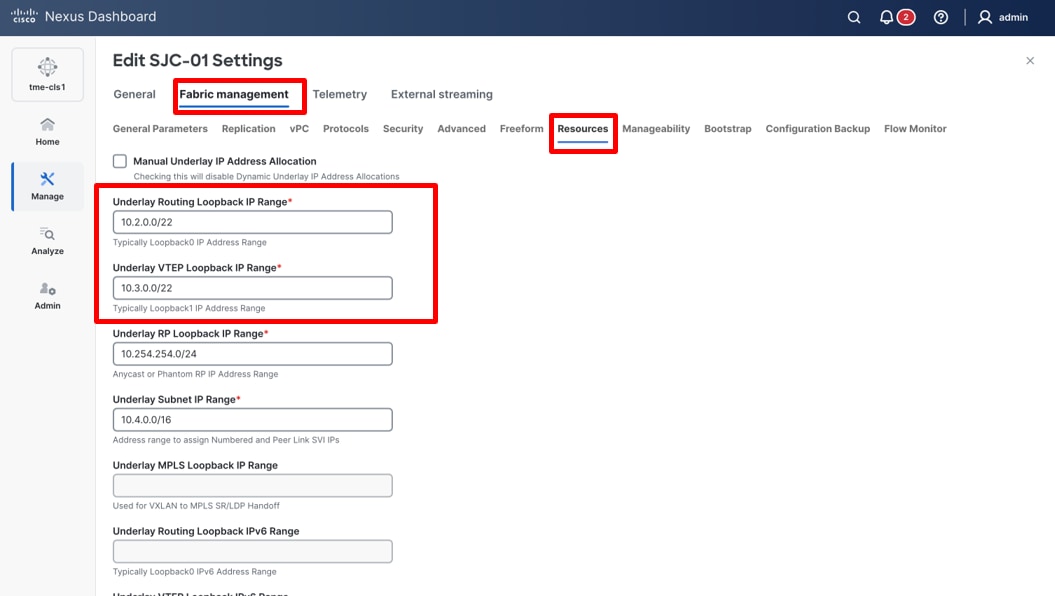
Viewing loopback IP ranges for the fabric switches
3. Use the default underlay IP address allocation automatically provided by Cisco Nexus Dashboard.
4. Scroll down to the VRF Lite Deployment drop-down list and select back2BackAndToExternal. When back2BackAndToExternal is selected, VRF-Lite inter fabric connections are automatically created between border devices of the VXLAN-EVPN (SJC-01 fabric in this example) fabric and the edge routers in the external fabric (external in-band fabric in this example).
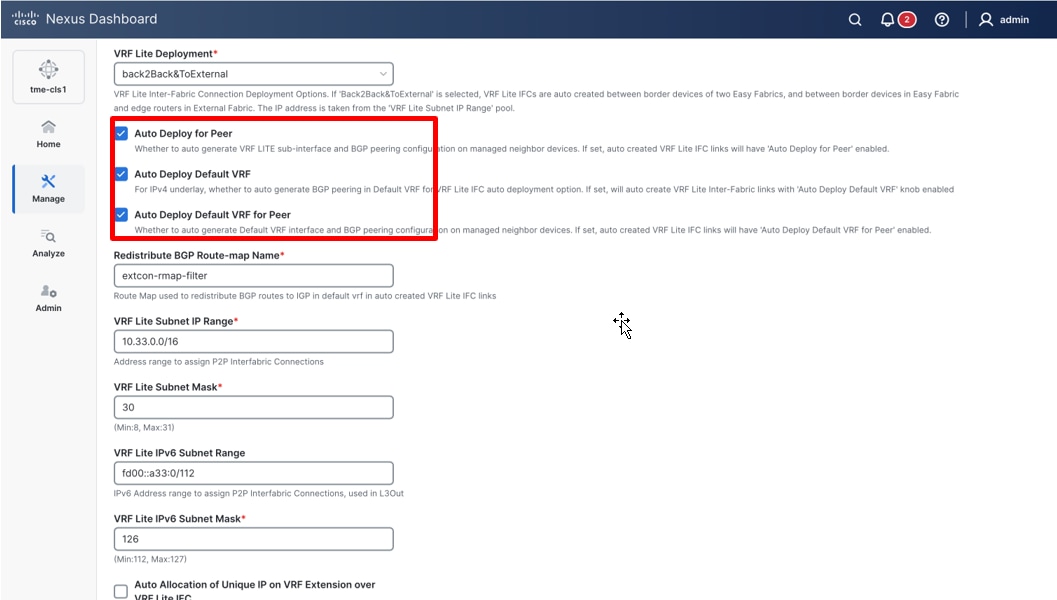
Fabric configuration options
5. Check Auto Deploy for Peer check box to auto-generate the VRF-LITE sub-interface and BGP peering for the external fabric in managed mode.
6. Check Auto Deploy Default VRF check box to auto deploy the default VRF and BGP peering in the default VRF.
7. Check Auto Deploy Default VRF for Peer check box for Peer to auto deploy the default VRF and BGP peering in the default VRF for the external fabric in managed mode.
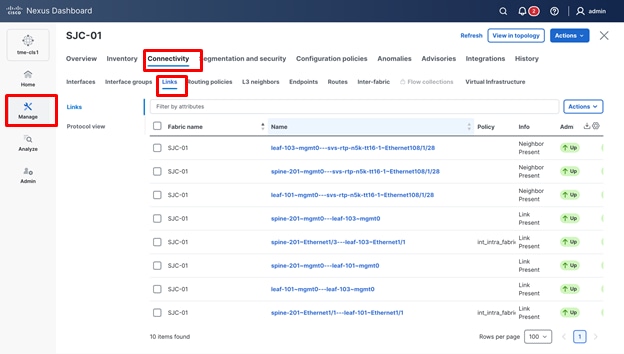
8. To create new links between the fabric and the external Layer 3 network, navigate to Manage > Fabrics > <fabric name> > Connectivity > Links.
Note: If you onboard the external fabric to Cisco Nexus Dashboard in “Monitor” mode, enable the Auto Deploy Default VRF.
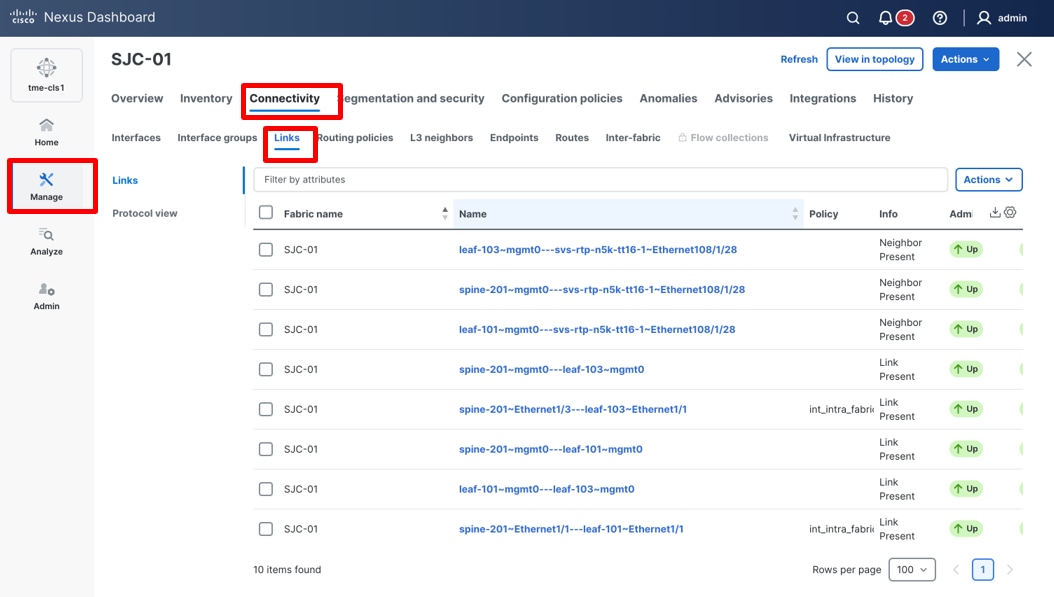
Viewing links in the fabric
Note: By default, Cisco Nexus Dashboard automatically detects links that are physically connected and up between fabric devices using Cisco Discovery Protocol (CDP) or Link Layer Discovery Protocol (LLDP). You can edit these physical links with the required configuration. In this example, you create a new link to demonstrate the process
9. Click Actions > Create Link. The Link management - create link page appears.
Creating a new link
10. Select the Link type as Inter-Fabric and select the Link subtype as VRF_LITE. Select ext_fabric_setup as the link template.
11. In this example, you are creating a link between the newly created VXLAN-EVPN fabric SJC-01 and your external in-band fabric as your Layer 3 network for establishing connectivity to Cisco Nexus Dashboard and for streaming telemetry. Provide the physical connectivity details by selecting the source device, destination device, source interface, and destination interface. Provide the Source BGP ASN, as well as the Source IP Address/Mask, along with the destination IP address.
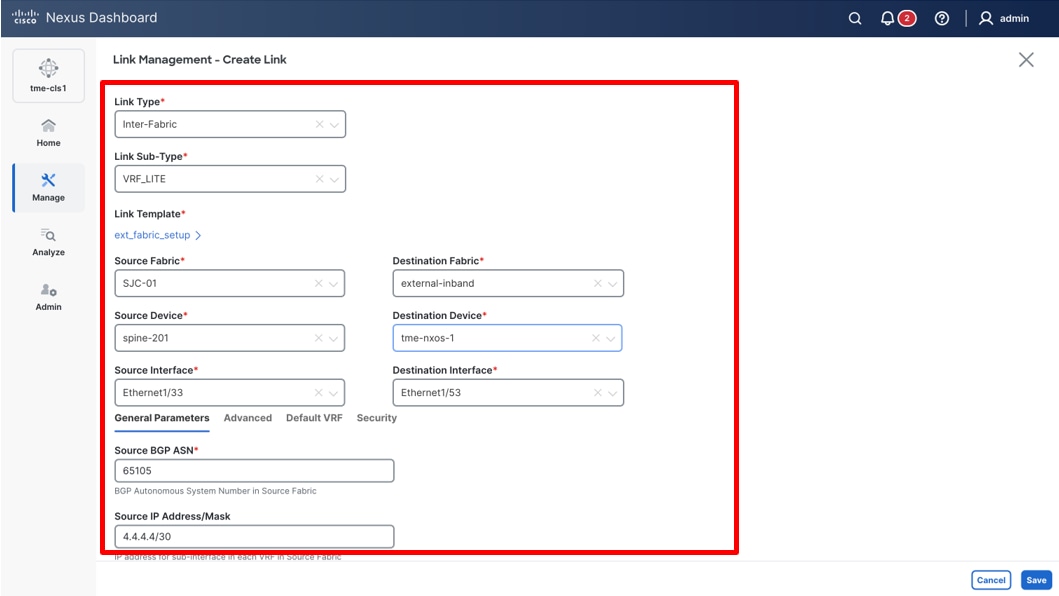
Providing the configuration parameters for the new link
12. Check Auto Generate Configuration for Peer check box and click Save. (By clicking this, Cisco Nexus Dashboard automates the configuration and deployment for the neighbor device provided the external fabric being managed by Cisco Nexus Dashboard as well.)
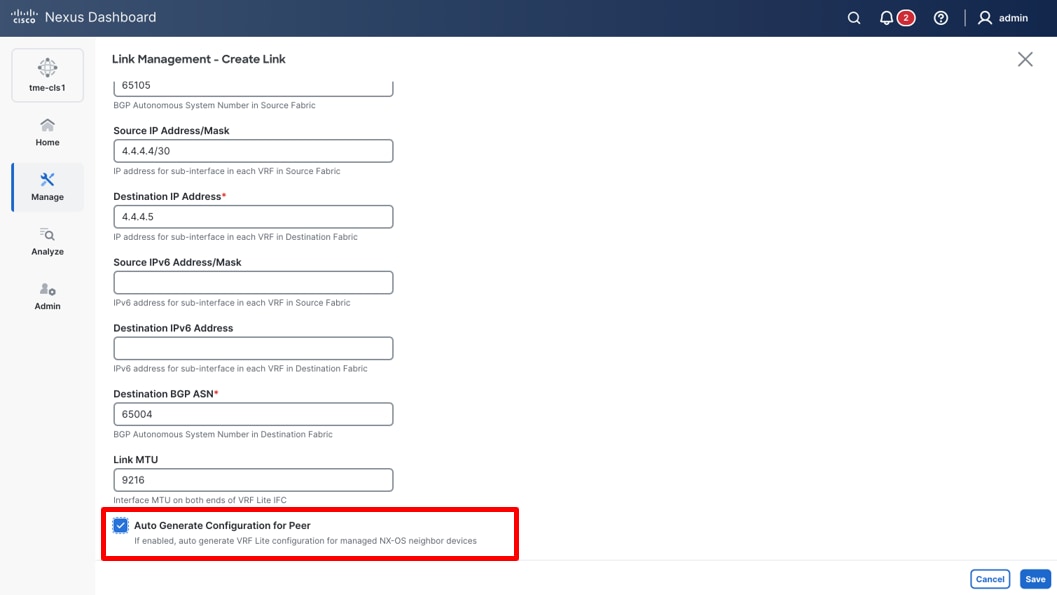
Providing the configuration parameters for the new link
13. Click Default VRF tab.
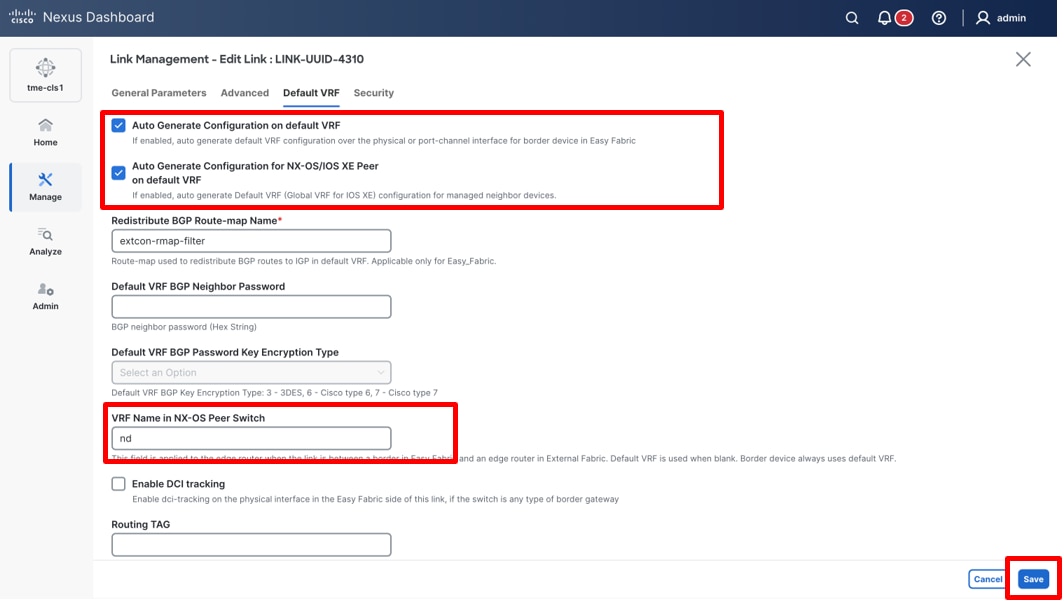
Modifying default-VRF options for the link
14. Check the Auto Generate Configuration on default VRF check box. This enables the creation of default VRF configuration over the physical interface of the border devices in the fabric.
15. Check the Auto Generate Configuration for NX-OS/IOS-XE Peer on default VRF check box, provided the peer (external fabric) is being managed by Cisco Nexus Dashboard.
16. In the VRF Name in NX-OS Peer Switch, enter the custom VRF name if the neighboring device in the external fabric is an edge and you would like to use a custom VRF on that edge, provided the external fabric is being managed by Cisco Nexus Dashboard.
17. Add or modify BGP max paths policy template. Navigate to Manage > Fabrics > <fabric Name> > Configuration policies > Policy, search for Template == bgp_max_paths. If this policy does not exist, create a new one. In our example, you have already created one, so you will modify the template.
Editing bgp_max_paths policy
18. Edit this policy to add the BGP maximum paths as 2. This is essential in our case since you use 2 edge routers in our external fabric for redundancy. This means that there are 2 paths to reach our Cisco Nexus Dashboard data interface from the 2 respective external devices. This is useful for enabling ECMP such that both switches and respective paths can be used.
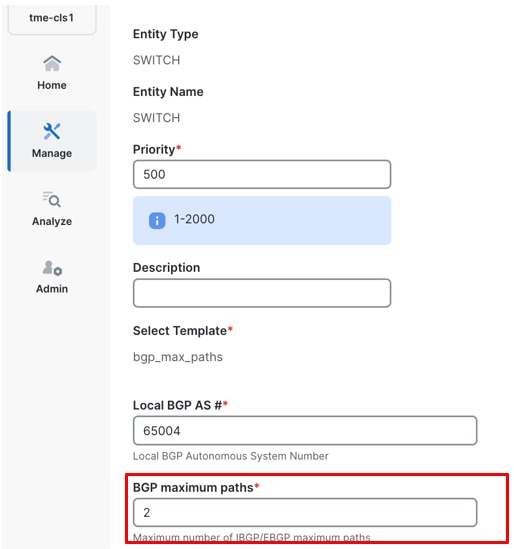
Editing BGP maximum paths configuration for local BGP AS 65004

Editing BGP maximum paths configuration for local BGP AS 65003
19. Click Save.
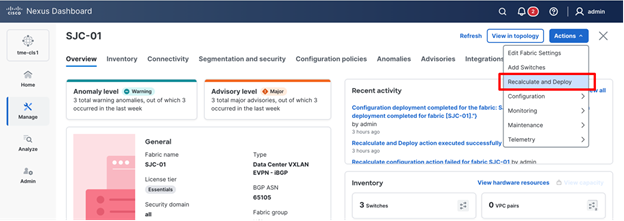
20. Click Actions and select Recalculate and Deploy to deploy all the telemetry configuration on the fabric.
21. Verify that the data network subnet (192.0.2.0/24) is advertised to the fabric through external Border Gateway Protocol (eBGP) sessions.
If the external switches are Cisco NX-OS and the default gateway for the Cisco Nexus Dashboard data subnet is a Switch Virtual Interface (SVI) running Hot Standby Router Protocol (HSRP), add a redistribution statement under the BGP configuration to advertise that subnet.
tme-nxos-1# show running-config interface vlan 10
interface Vlan10
no shutdown
vrf member nd
ip address 192.168.10.252/24
hsrp 10
ip 192.168.10.254
router bgp 65004
vrf nd
address-family ipv4 unicast
redistribute direct route-map direct-connect-svi
maximum-paths 64
maximum-paths ibgp 2
tme-nxos-2# show running-config interface vlan 10
interface Vlan10
no shutdown
vrf member nd
ip address 192.168.10.253/24
hsrp 10
ip 192.168.10.254
router bgp 65004
vrf nd
address-family ipv4 unicast
redistribute direct route-map direct-connect-svi
maximum-paths 64
maximum-paths ibgp 2
Note: If Cisco Nexus Dashboard manages the external fabric, perform a Recalculate and Deploy on that fabric.
Performing Recalculate and Deploy on the fabric
Network Time Protocol (NTP) Configuration
For a network site managed by Cisco Nexus Dashboard, enable and configure NTP on Cisco Nexus Dashboard. This will push the NTP configs to all the switches.
1. Navigate to Manage > Fabrics, select the fabric <fabric name>.
2. From Actions drop-down list, select Edit fabric settings.
Editing fabric details for the fabric
3. Go to Fabric Management > Manageability tab to fill in the NTP server IP and VRF details and click Save.

Configuring NTP server on the fabric
4. From Actions drop-down list, select Recalculate and Deploy.

Performing Recalculate and Deploy on the fabric
Precision Time Protocol (PTP) Configuration
Note: PTP is only required for Traffic Analytics and Flow Telemetry features.
When PTP is enabled, it becomes the default clock even if NTP is enabled on the switches. PTP requires a source loopback used for exchanging PTP packets and a PTP domain ID that defines boundaries of the PTP messages. Cisco Nexus Dashboard offers easy site setup for enabling PTP.
1. Navigate to Manage > Fabrics, select the fabric <fabric name>, from the drop-down list, select Edit fabric settings.

Editing fabric settings
2. Click Fabric management > Advanced tab and select Enable Precision Time Protocol (PTP). Enter your values in PTP Source Loopback Id, and PTP Domain Id. Click Save. This enables PTP globally and on core-facing interfaces.
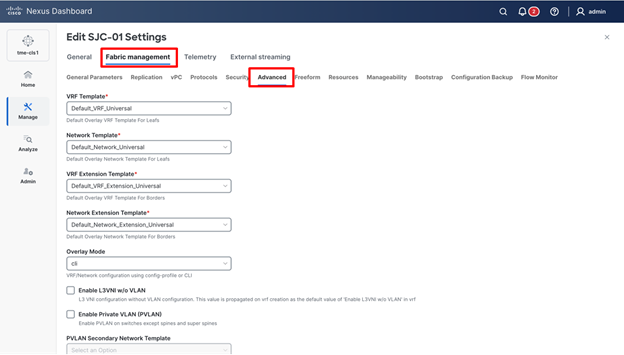
Editing Advanced tab
Configuring PTP
3. From the Actions drop-down list, select Recalculate and Deploy to ensure switches are configured with the required PTP settings as configured in Cisco Nexus Dashboard.
NTP and PTP verifications
To verify PTP status on Cisco Nexus Dashboard
1. To verify PTP on Cisco Nexus Dashboard, go to Manage > Fabrics > <fabric Name> (SJC-01 in this example) > Overview > Telemetry status as OK/Not OK.
Reviewing telemetry status of the fabric
2. On the Fabric tab, verify the PTP status if it displays In sync.

Verifying PTP status on the fabric via Cisco Nexus Dashboard
To verify the PTP status on the switches
With either managed or monitored mode fabrics, verifications on the switch remain the same.
3. NTP verifications: Login to the switches to confirm the configuration and clock settings. Verify below commands for NTP setup on the switch as the clock time source.
leaf-101(config)# show run ntp
!Command: show running-config ntp
!No configuration change since last restart
!Time: Sun Feb 9 21:54:40 2025
version 10.5(3) Bios:version 05.40
ntp server 64.102.244.57
use-vrf management -> Verify the configuration
leaf-101(config)# show clock
21:53:34.997 UTC Sun Feb 9 2025
Time source is NTP -> Verify NTP is the time source
leaf-101(config)# show ntp peers
----------------------------------------------------
Peer IP Address Serv/Peer
----------------------------------------------------
64.102.244.57
Server (configured) -> Verify the server is configured
• PTP Verifications: After enabling PTP either through Nexus Dashboard or CLI configurations, verify below commands for PTP on the switch as the clock time source.
leaf-101# show run ptp
feature ptp. -> Verify that PTP is enabled and configured on the interfaces
ptp source 10.0.0.1
ptp domain 0
interface Ethernet1/1
ptp
interface Ethernet1/33
ttag
ttag-strip
leaf-101# show clock
01:56:04.353 UTC sun Feb 9 2025
Time source is PTP -> Verify PTP is the time source
leaf-101# show ptp clock foreign-masters record
P1=Priority1, P2=Priority2, C=Class, A=Accuracy,
OSLV=Offset-Scaled-Log-Variance, SR=Steps-Removed
GM=Is grandmaster
---------- ------------------- --- ---- ---- --- ----- ----------
Interface Clock-ID P1 P2 C A OSLV SR
---------- ------------------- --- ---- ---- --- ----- ----------
Eth1/1 2c:4f:52:ff:fe:56:61:1f 255 255 248 254 65535 1
-> Verify if it can reach the grand master on its ptp configured interfaces
leaf-101# show ptp clock
PTP Device Type : boundary-clock
PTP Device Encapsulation : NA
PTP Source IP Address : 10.2.0.1 -> Verify if source loopback IP is as configured
Clock Identity : d4:78:9b:ff:fe:19:87:c3
Clock Domain: 0
Slave Clock Operation : Two-step
Master Clock Operation : Two-step
Clave-Only Clock Mode : Disabled
Number of PTP ports: 3
Priority1 : 255
Priority2 : 255
Clock Quality:
Class : 248
Accuracy : 254
Offset (log variance) :
Offset From Master : 12
Mean Path Delay : 168
Steps removed : 2
Correction range : 100000
MPD range : 1000000000
Local clock time: Fri Aug 22 01:56:08 2025
PTP clock state : Locked
leaf-101# show ptp parent
PTP PARENT PROPERTIES
Parent Clock:
Parent Clock Identity: 2c:4f:52:ff:fe:56:61:1f
Parent Port Number: 4
Observed Parent Offset (log variance): NA
Observed Parent Clock Phase Change Rate: N/A
Parent IP: 10.2.0.4
Grandmaster Clock:
Grandmaster Clock Identity: 00:ee:ab:ff:fe:3a:16:e7 -> Get the Grandmaster clock ID
Grandmaster Clock Quality
Class : 248
Accuracy : 254
Offset (log variance) : 65535
Priority1: 255
Priority2: 255
spine-201# show ptp clock foreign-masters record
P1=Priority1, P2=Priority2, C=Class, A=Accuracy,
OSLV=Offset-Scaled-Log-Variance, SR=Steps-Removed
GM=Is grandmaster
---------- --------------------- --- ---- ---- --- ----- ----------
Interface Clock-ID P1 P2 C A OSLV SR
---------- --------------------- --- ---- ---- --- ----- ----------
Eth1/4 00:ee:ab:ff:fe:3a:16:e7 255 255 248 254 65535 1 GM
-> Check the Grandmaster clock ID and confirm the right Grandmaster registration on the clients
Verification of Successful Telemetry Deployment
1. If BGP sessions establish correctly between the border device and the edge routers after deployment, the Telemetry tab displays Enabled and the Telemetry Status displays OK on the fabric overview page.
Verifying telemetry status of the fabric
2. To view the deployed configuration, select Telemetry Status OK, then select the Switches tab.
Reviewing the telemetry configuration that is being pushed to the fabric switches
3. Select the configuration for a switch in the PTP status and select Expected configuration to view the details deployed in it.
Reviewing the telemetry configuration that is being pushed to the fabric switches
4. Verify the configurations deployed on the switches in the Software telemetry tab.
Reviewing the telemetry configuration that is being pushed to the fabric switches
Enable Telemetry on a pre-onboarded site
If a fabric exists with switches onboarded for NX-OS controller and management, you can enable telemetry to gain operational insights.
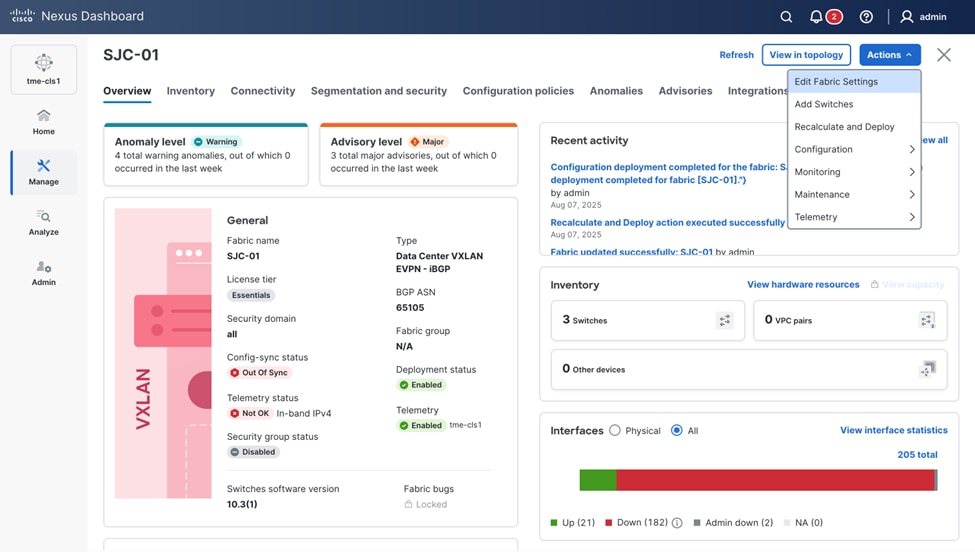
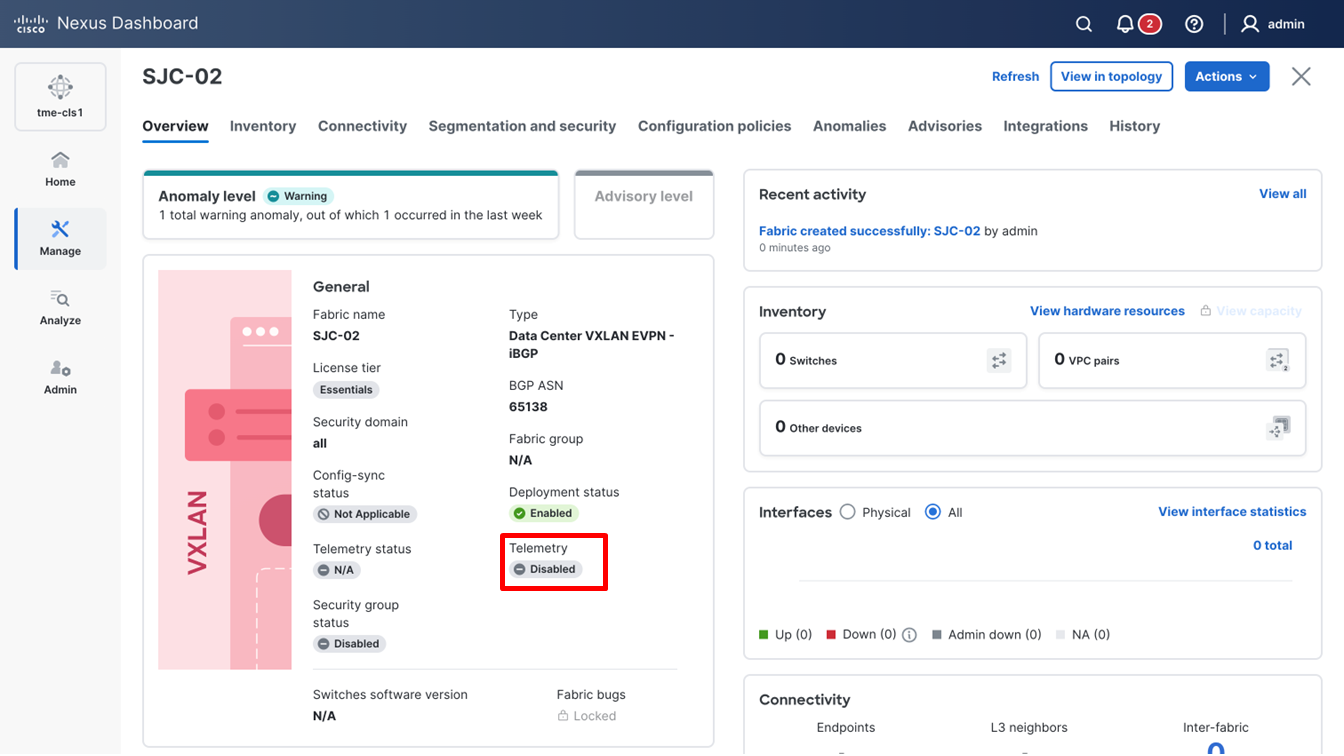
1. Verify the status of Telemetry on the fabric.
Telemetry currently disabled on the fabric
2. To enable telemetry on this fabric, navigate to Manage > Fabrics > <fabric name> > Actions > Edit fabric settings.

Editing fabric settings
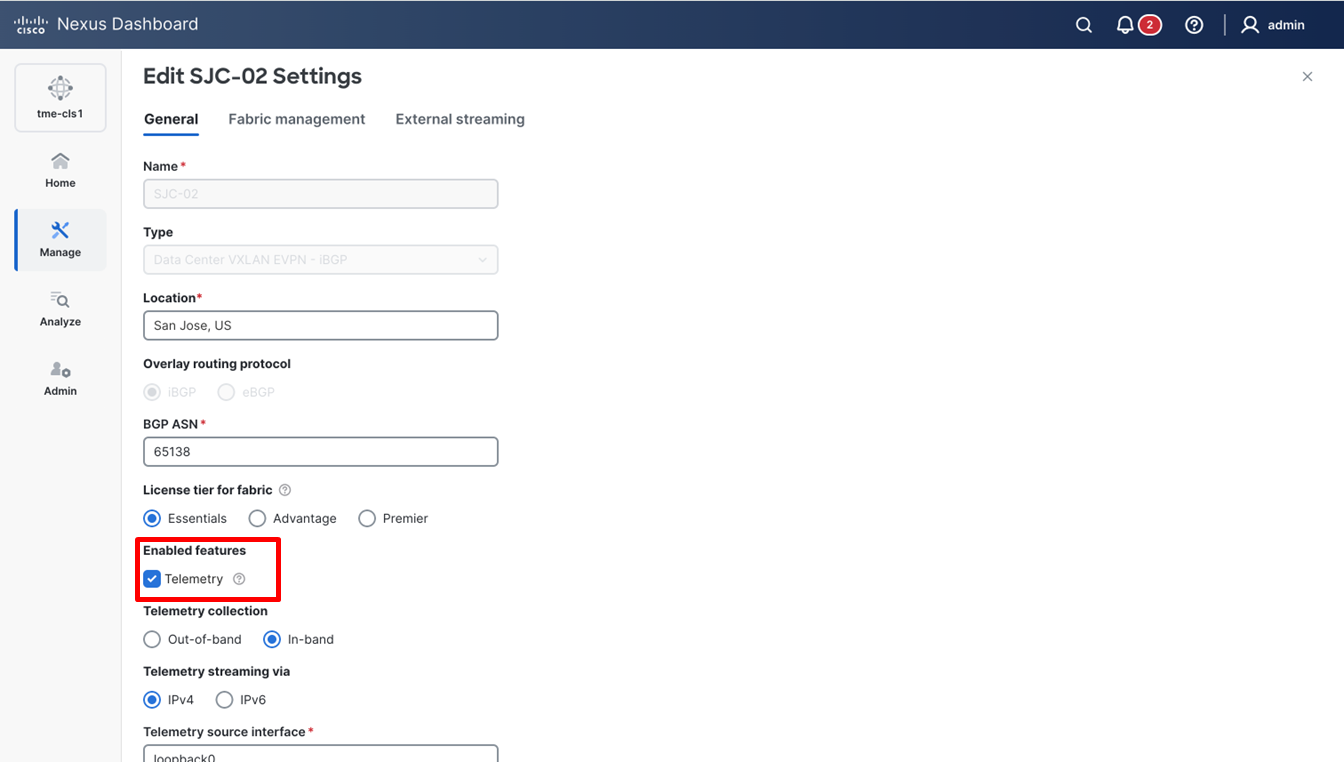
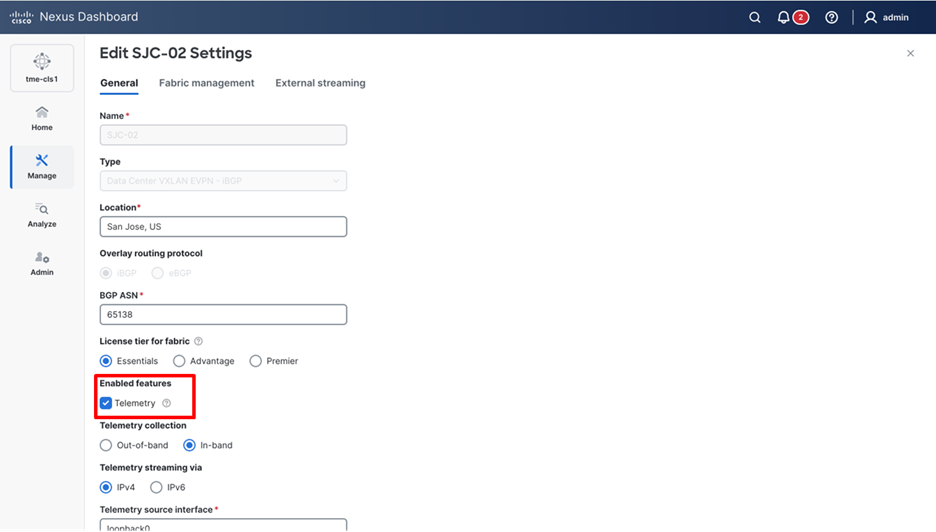
3. Under General – from Enabled features, select Telemetry checkbox.
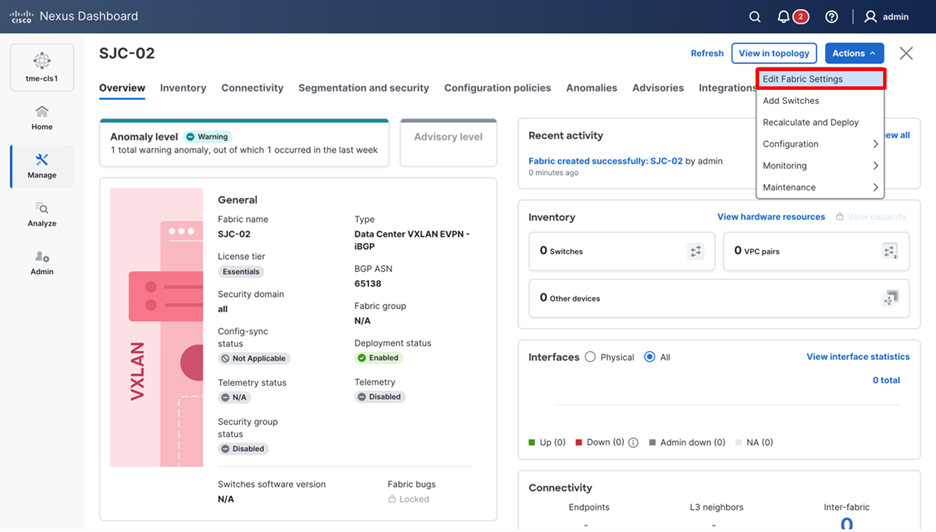
Enabling telemetry for a fabric
Check the Telemetry check box to enable telemetry streaming for the fabric. Refer to the steps above for any additional configuration requirements.
Pausing/Resuming/Reconfiguring Telemetry on a Pre-Onboarded Site
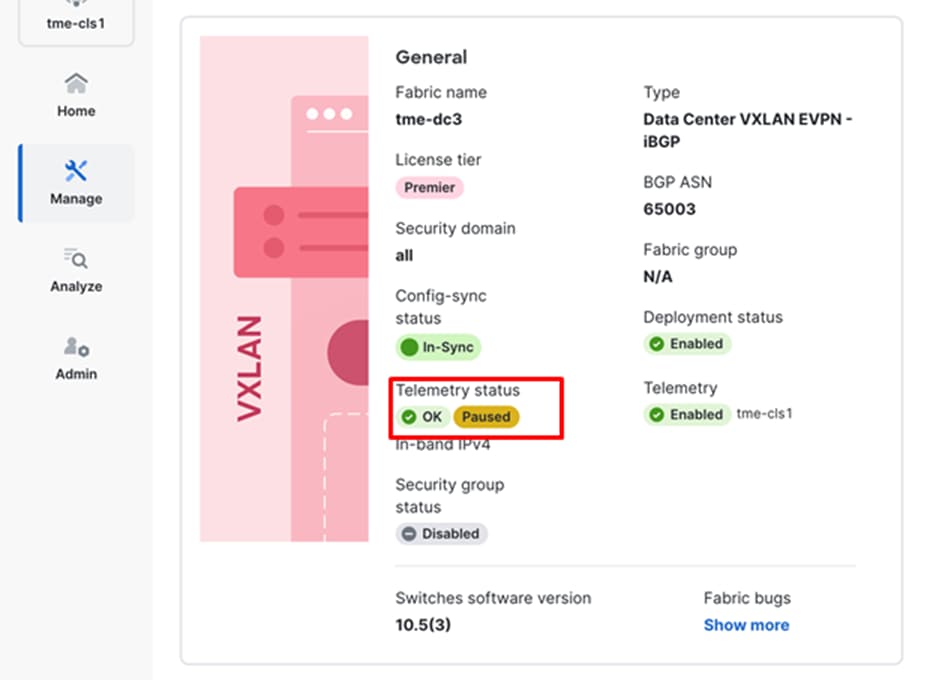
You can pause, resume, or reconfigure telemetry in Cisco Nexus Dashboard. When you pause telemetry, data is available only up to the time of the pause. Real-time data becomes available again after you resume telemetry.
1. To pause telemetry: Click Actions > Telemetry > Pause telemetry. The Telemetry status displays as Paused.
Pausing telemetry on a fabric
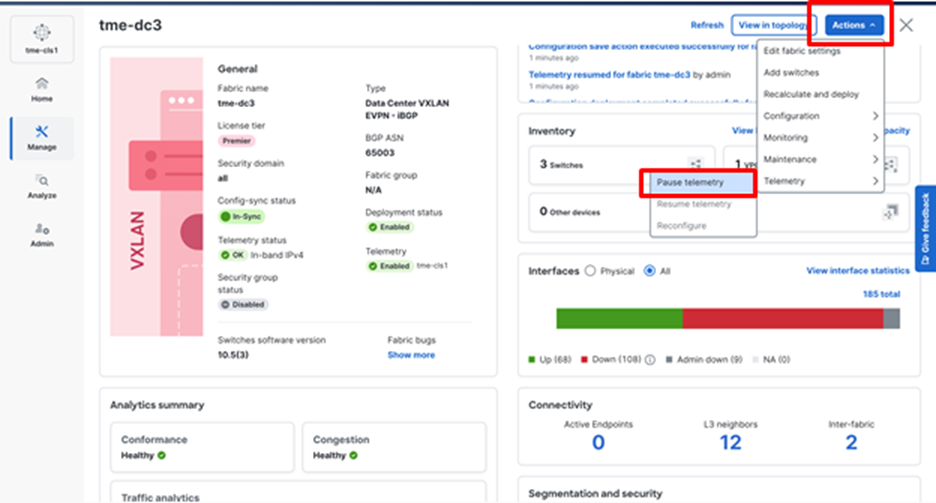
Telemetry status showing paused for a fabric
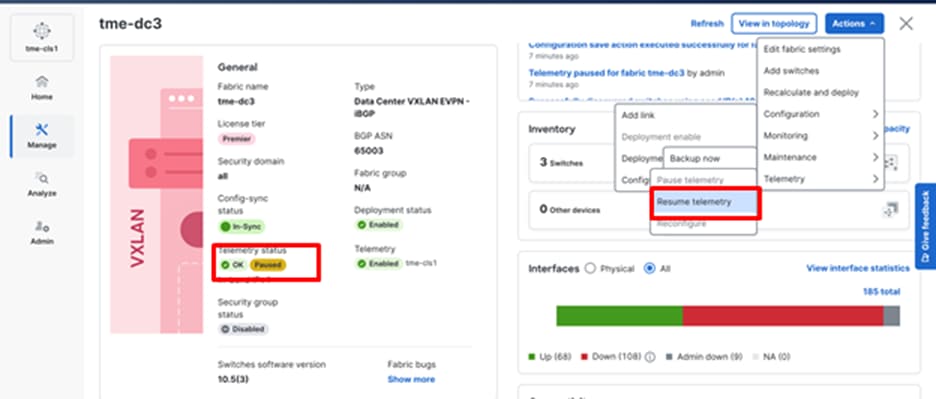
2. To resume telemetry: Click Actions > Telemetry > Resume telemetry.
Resuming telemetry on a fabric
Prepare Cisco Nexus Dashboard Monitored Sites for Streaming Telemetry
Cisco Nexus Dashboard supports monitored mode which requires discovering switches and adding them to a fabric. In monitored mode, Cisco Nexus Dashboard does not manage the switch configuration and typically only helps monitor the fabric. This mode can work complementary to any configuration tools and methods used as it is agnostic of the switch configurations. For a Cisco Nexus Dashboard monitored network site, users need to deploy and verify the needed switch configuration for Cisco Nexus Dashboard by themselves.
This section helps to prepare a Cisco Nexus Dashboard monitored fabric for streaming telemetry to Cisco Nexus Dashboard. It details each of the steps below in order:
· Create fabric
· Discover switches
· Configure Routable Loopback Interfaces on the switches
· Configure NTP
· Configure PTP
Create Fabric
This section shows you how to create a Cisco Nexus Dashboard monitored fabric.
1. Navigate to Manage > Fabrics > Actions > Create fabric > Create new LAN fabric and click Next.
Creating a new LAN fabric
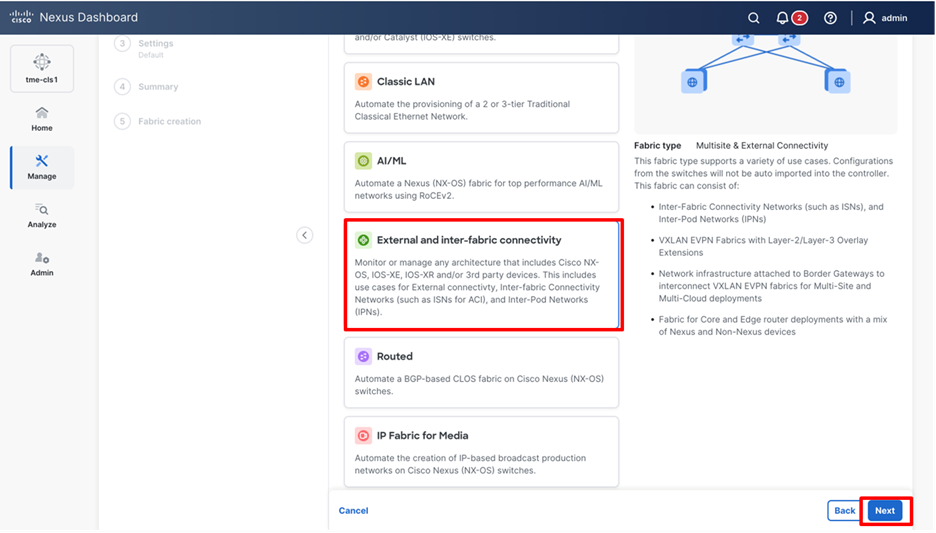
2. Cisco Nexus Dashboard supports multiple fabric types (for example: Classic LAN , VXLAN fabrics and so on). Select External and inter-fabric connectivity and click Next.
Selecting fabric type as external and Inter-fabric connectivity
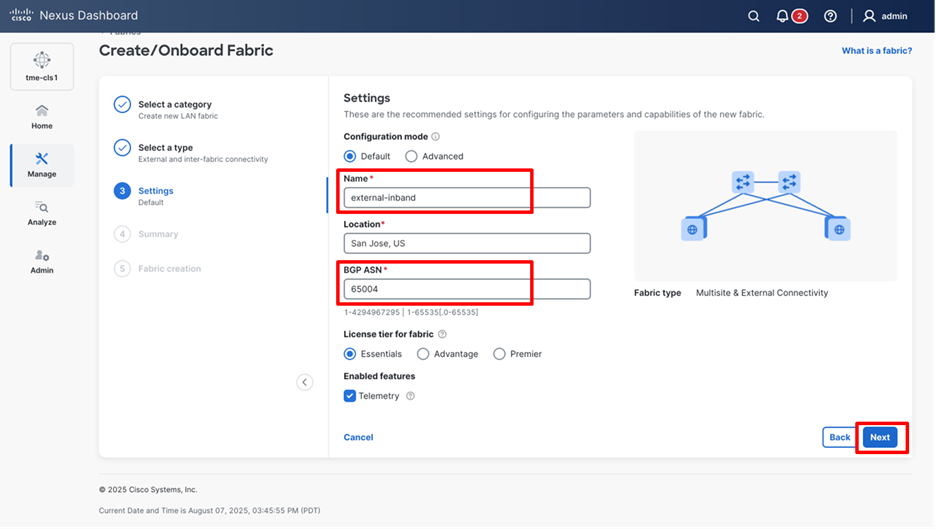
3. In Settings enter the Name, Location, and BGP ASN, and select the License tier for fabric used in the site, then click Next.
Providing fabric details such as Name, BGP ASN, and so on
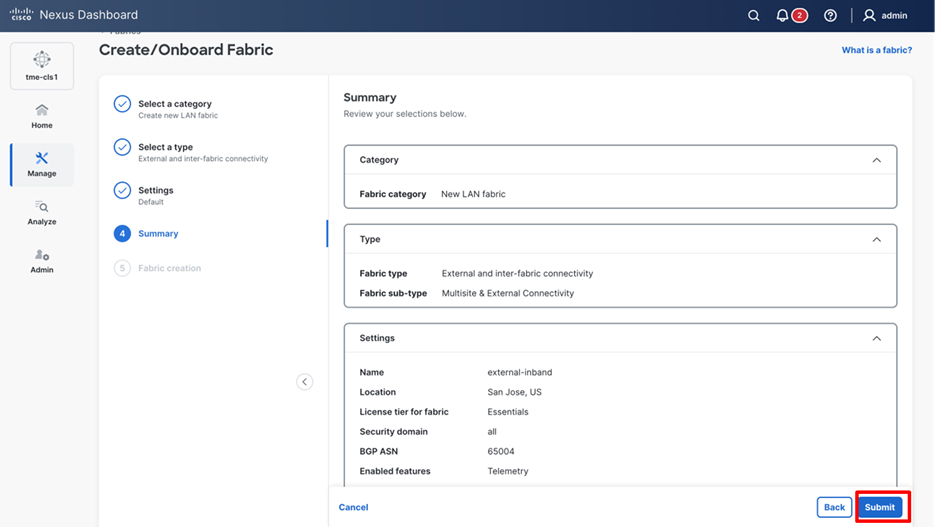
4. Review the fabric details and click Submit.
Confirming fabric details and submitting the new fabric
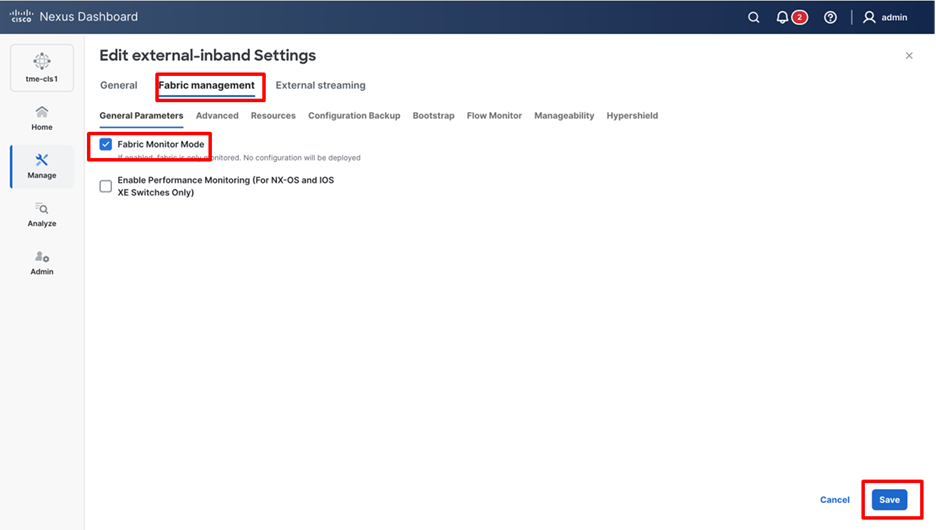
5. Navigate to Manage > Fabrics > <fabric name> > Edit fabric settings > Fabric management, check the Fabric Monitor Mode check box. Onboard the fabric to Cisco Nexus Dashboard in “Monitor” mode. In this mode, Cisco Nexus Dashboard does not deploy configuration to the switches.
Editing fabric settings
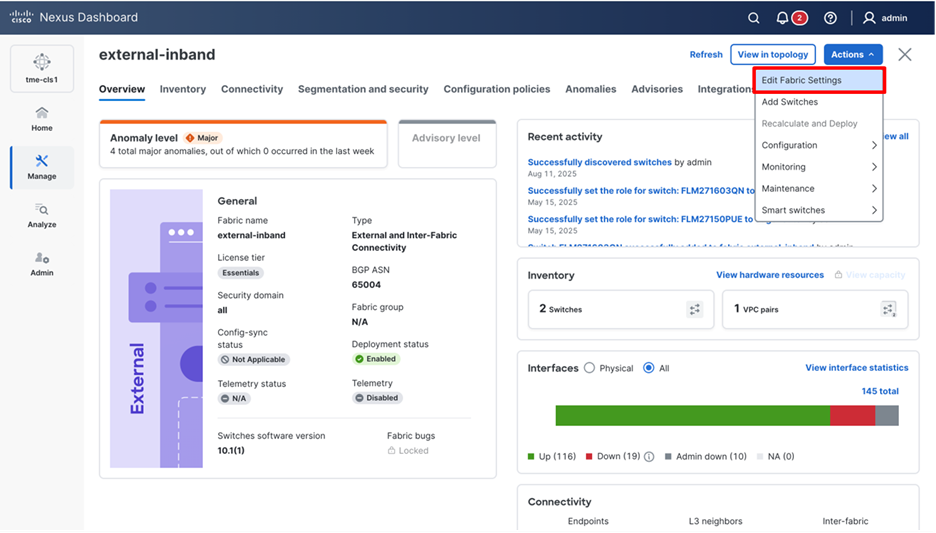
Onboard the fabric in monitor mode on Cisco Nexus dashboard
6. Click Save.
Note: Because Cisco Nexus Dashboard only monitors the fabric, you must configure the switches. In this mode, Cisco Nexus Dashboard does not deploy configurations to the switches.
Discover Switches in the Fabric
Cisco Nexus Dashboard can use a single seed or multiple IPs in the fabric and dynamically discover the switches for a set number of hops defined in Max Hops or also a list of all switch IPs in the fabric with a hop count ‘0’ can also serve the purpose. It allows selection of switches to be added to the fabric.
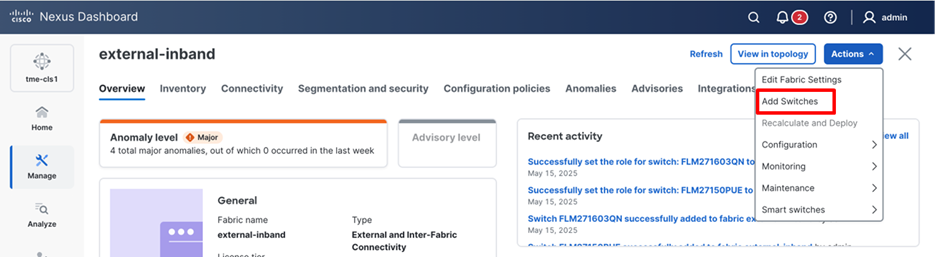
1. Navigate to Manage > Fabrics > Fabric name (external-in-band). From the Actions drop-down list, select Add Switches.
A pop-up page appears, to allow the user to choose a fabric that the discovered switches will belong to.
Adding switches to the monitored fabric
2. Click Choose Fabric.
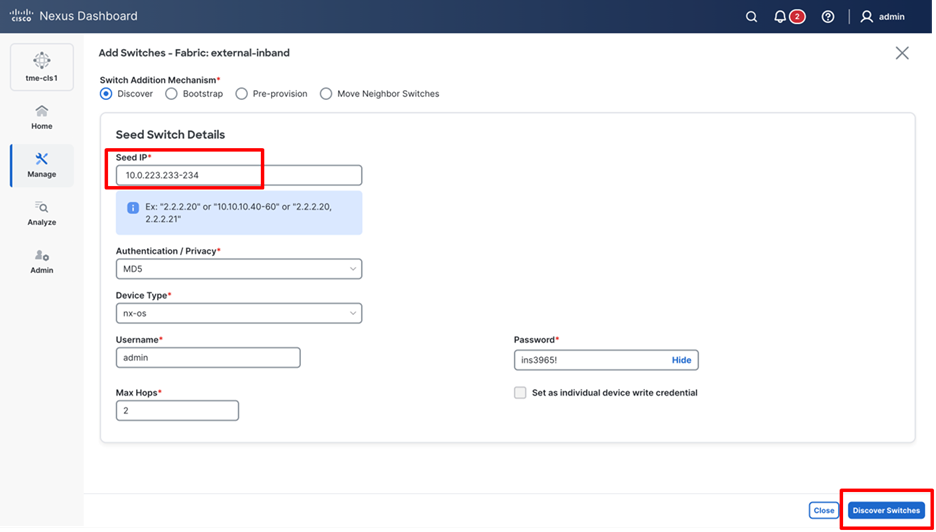
3. Enter a Seed IP (mgmt0 interface IP of the switch) of any switch in the fabric to be discovered. Choose the Authentication Protocol used to login to switches and provide Username and Password. Enter the number of hops in Max Hops from the seed to determine the detection boundary.
Discovering switches in the fabric
4. Click Discover Switches.
5. Select all the switches intended to be part of the fabric and click Add Switches.
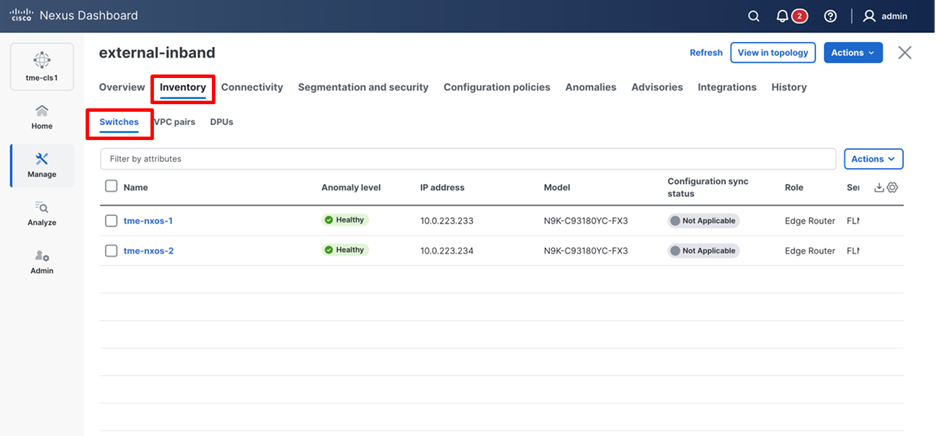
6. Click Manage > Fabrics > <fabric name> > Inventory > Switches. The Switches that are discovered and part of the fabric intended are displayed. You can view the switches associated with the fabric from Manage > Fabrics > Fabrics Overview > Inventory > Switches tab also.
Reviewing the switches in the fabric through the inventory tab
7. After the switches are added to the fabric, assign roles to the switches by selecting the switch/switches and choosing the intended role, such as Spine, Leaf, Border Gateway, Edge Router, and so on.
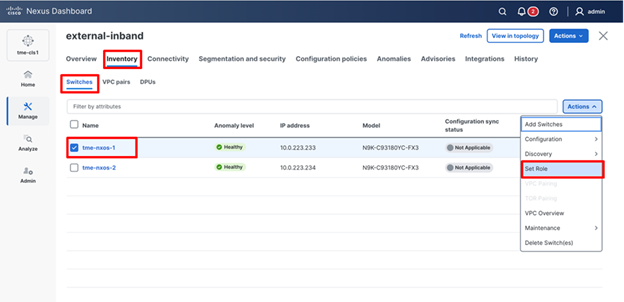
8. To set the switch role, navigate to Manage > Fabrics-> <Fabric name> (external-in-band) > Inventory > Switches. Check the switch check box next to the switch name.
9. From Actions drop-down list, select Set Role.
Setting the role for the fabric switches
10. After setting the role, you can find the expected configuration for configuring telemetry for the fabrics on Cisco Nexus Dashboard. However, in fabric monitor mode, you will not be able to push the configuration to the switches through ND and will be responsible for configuring the fabric switches manually. Cisco Nexus Dashboard makes it easy to configure telemetry for monitored fabrics by providing the expected configuration on the switches for enabling telemetry on the fabrics.
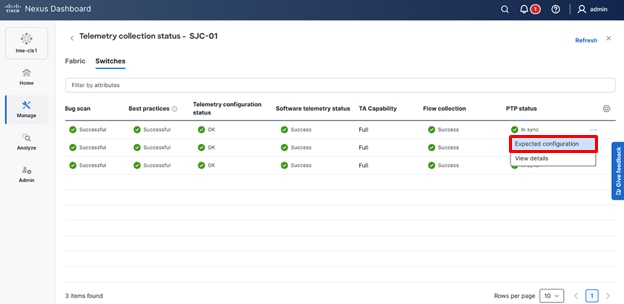
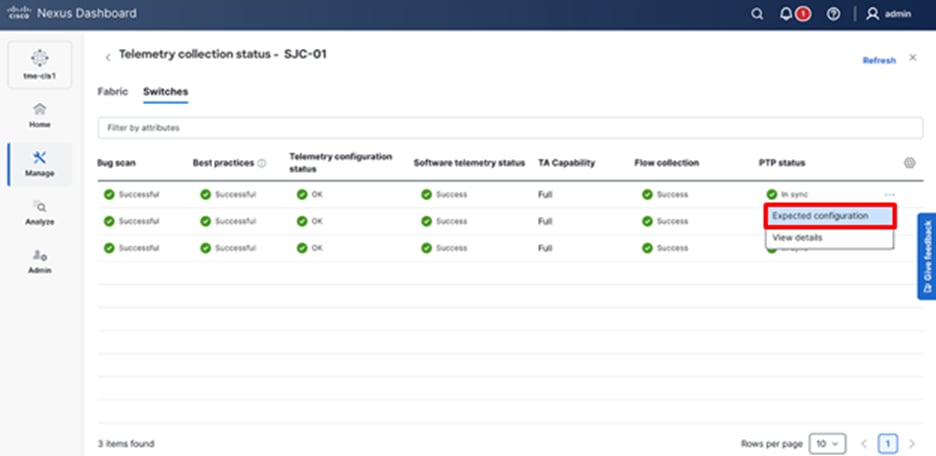
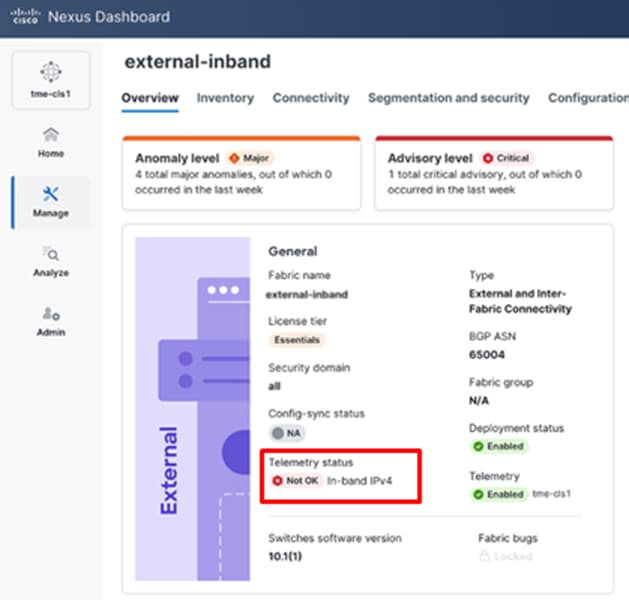
11. To find this configuration, from the fabric Overview page, check the Telemetry status, for Not OK.

Telemetry status of fabric showing Not OK
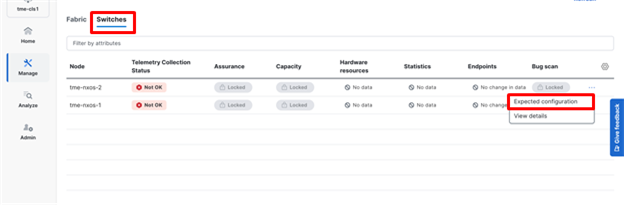
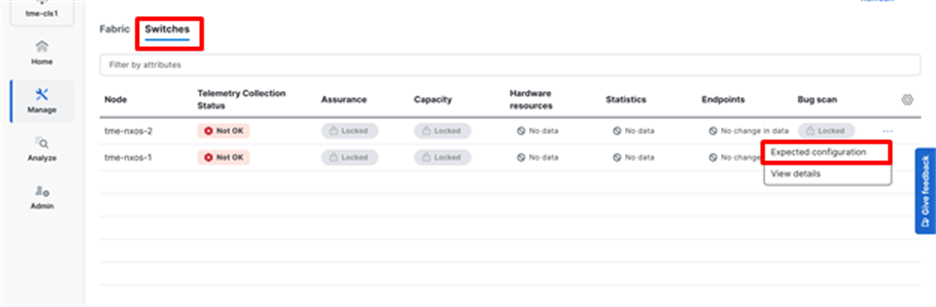
12. Navigate to Switches.
13. Click on ellipsis (...) > Expected configuration.
Reviewing the expected telemetry configuration for the fabric switches
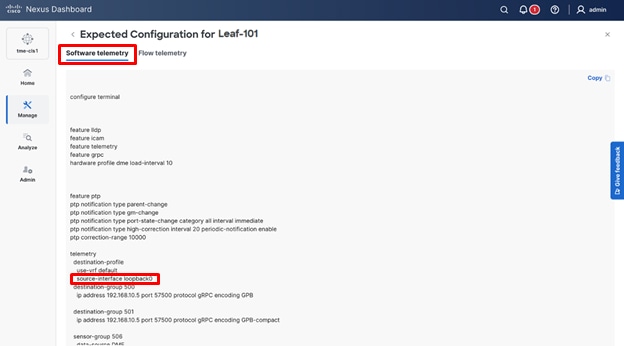
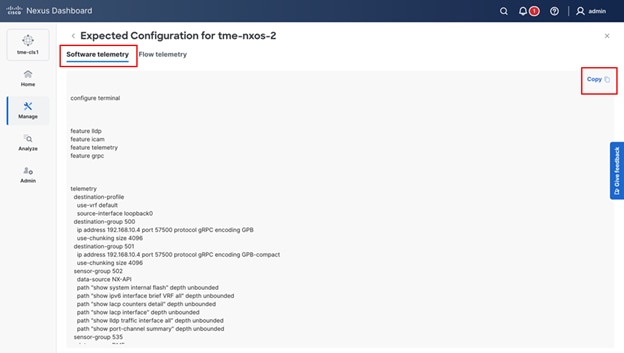
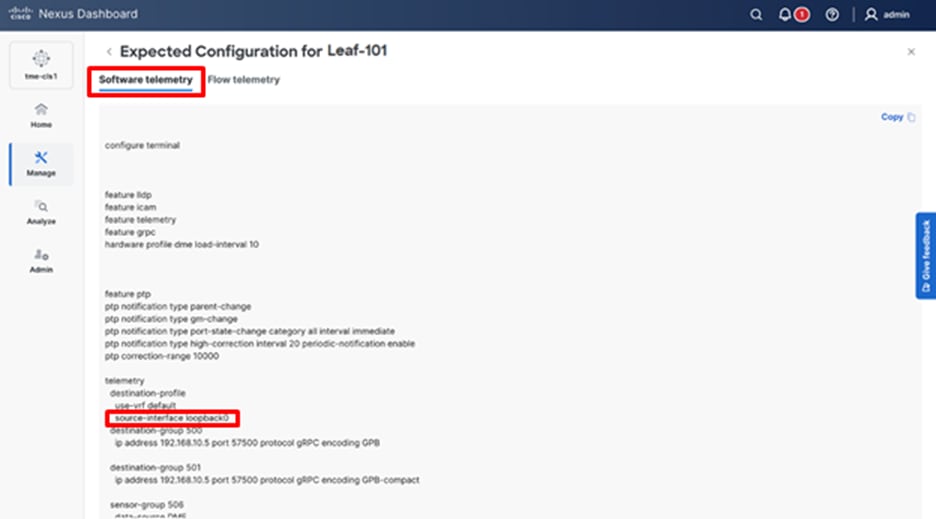
14. Verify the configuration for software telemetry. This is the configuration that needs to be applied to the switches to enable and stream telemetry to Cisco Nexus Dashboard from the fabric switches. To copy the configuration and then paste it to the switches directly, simply click Copy.
Reviewing and copying the expected telemetry configuration from Cisco Nexus Dashboard for the fabric switches
Configure a Routable Loopback Interface on Switches
Each switch in the network site needs a routable loopback interface to source the telemetry data to Cisco Nexus Dashboard. Any existing loopback on the switches with the required IP connectivity to Cisco Nexus Dashboard Data Network could be used or users can create a new loopback for the purpose.
For a Cisco Nexus Dashboard monitored fabric, users need to configure and manage such a loopback interface on the switches by themselves. Below shows the procedure.
1. Configure a loopback interface on the switches.
leaf-201(config)# interface loopback 0
leaf-201(config-if)# description Routing loopback interface
leaf-201(config-if)# ip address 20.2.0.1/32
leaf-201(config-if)# ip router ospf underlay area 0.0.0.0
leaf-201# show run interface loopback 0 >> check for
interface loopback0
description Routing loopback interface
ip address 20.2.0.1/32
ip router ospf underlay area 0.0.0.0
leaf-201# show interface loopback 0
loopback0 is up
admin state is up,
Hardware: Loopback
Description: Routing loopback interface
Internet Address is 20.2.0.1/32
MTU 1500 bytes, BW 8000000 Kbit , DLY 5000 usec
reliability 255/255, txload 1/255, rxload 1/255
Encapsulation LOOPBACK, medium is broadcast
Auto-mdix is turned off
1031148 packets input 96462171 bytes
0 multicast frames 0 compressed
0 input errors 0 frame 0 overrun 0 fifo
0 packets output 0 bytes 0 underruns
0 output errors 0 collisions 0 fifo
0 out_carrier_errors
2. Check if the loopback created can reach the Cisco Nexus Dashboard Data Network by pinging the Cisco Nexus Dashboard Data Network IP address from the loopback interface. In the example below, the IP address 192.168.10.10 is one of the Cisco Nexus Dashboard Data Network IP addresses. If there are no firewalls or other network devices blocking the ICMP traffic, the ping should succeed.
leaf-201# ping 192.168.10.10 source-interface loopback 0
PING 192.168.1.201 (192.168.1.201): 56 data bytes
64 bytes from 192.168.10.10: icmp_seq=0 ttl=62 time=0.56 ms
64 bytes from 192.168.10.10: icmp_seq=1 ttl=62 time=0.431 ms
64 bytes from 192.168.10.10: icmp_seq=2 ttl=62 time=0.38 ms
64 bytes from 192.168.10.10: icmp_seq=3 ttl=62 time=0.449 ms
64 bytes from 192.168.10.10: icmp_seq=4 ttl=62 time=0.379 ms
--- 192.168.10.10 ping statistics ---
5 packets transmitted, 5 packets received, 0.00% packet loss
round-trip min/avg/max = 0.379/0.439/0.56 ms
3. For an effective verification, make sure the ping is sourced from the Loopback interface.
Network Time Protocol (NTP) Configuration
You must enable NTP and configure the NTP server on each switch in the network site that is monitored by Cisco Nexus Dashboard. Additionally, it is also important to ensure that all the switches have consistent NTP configuration and are synchronized to the same NTP server.
The following commands can be used to configure NTP on the individual switches (use the IP address of the NTP server in your deployment).
spine-201# config terminal
Enter configuration commands, one per line. End with CNTL/Z.
spine-201(config)# ntp server 64.102.244.57 use-vrf management
Precision Time Protocol (PTP) Configuration
Note: PTP is required only for Traffic Analytics and Flow Telemetry features.
For Cisco Nexus Dashboard managed or monitored network site, an external PTP grandmaster that provides a clock source with at least microsecond accuracy is required. When PTP is enabled, it is the default clock even if NTP is enabled on the switches. PTP requires a source loopback used for exchanging PTP packets and a PTP domain ID that defines the boundaries of the PTP messages.
For Cisco Nexus Dashboard monitored network site, you must configure PTP on each network switch as Cisco Nexus Dashboard does not manage the switch configuration. This section describes how to configure PTP on an NX-OS switch.
1. Enable feature PTP.
leaf-101# configure terminal
Enter configuration commands, one per line. End with CNTL/Z.
leaf-101(config)# feature ptp -> Enabling feature ptp
2. Configure PTP domain ID and PTP source interface (a routable loopback).
leaf-101(config)# ptp domain 1 -> PTP domain ID
leaf-101(config)# ptp source 10.2.0.1-> PTP source IP
3. Configure PTP under core facing interfaces and ttag under Host facing interfaces.
interface Ethernet1/1 -> Core facing interface
ptp
interface Ethernet1/33 -> host facing interface
ttag
ttag-strip
NTP and PTP verifications
With either managed or monitored mode fabrics, verifications on the switch remain the same.
· NTP verifications: Login to the switches to confirm the configuration and clock settings. Verify below commands for NTP setup on the switch as the clock time source.
leaf-101(config)# show run ntp
!Command: show running-config ntp
!No configuration change since last restart
!Time: Sun Feb 9 21:54:40 2025
version 10.5(3) Bios:version 05.40
ntp server 64.102.244.57 use-vrf management -> Verify the configuration
leaf-101(config)# show clock
21:53:34.997 UTC Sun Feb 9 2025
Time source is NTP -> Verify NTP is the time source
leaf-101(config)# show ntp peers
----------------------------------------------------
Peer IP Address Serv/Peer
----------------------------------------------------
64.102.244.57 Server (configured) -> Verify the server is configured
· PTP Verifications: After enabling PTP either through Cisco Nexus Dashboard or CLI configurations, verify below commands for PTP on the switch as the clock time source.
leaf-101# show run ptp
feature ptp. -> Verify that PTP is enabled and configured on the interfaces
ptp source 10.0.0.1
ptp domand 0
interface Ethernet1/1
ptp
interface Ethernet1/33
ttag
ttag-strip
leaf-101# show clock
01:56:04.353 UTC sun Feb 9 2025
Time source is PTP -> Verify PTP is the time source
leaf-101# show ptp clock foreign-masters record
P1=Priority1, P2=Priority2, C=Class, A=Accuracy,
OSLV=Offset-Scaled-Log-Variance, SR=Steps-Removed
GM=Is grandmaster
---------- ------------------- --- ---- ---- --- ----- ----------
Interface Clock-ID P1 P2 C A OSLV SR
---------- ------------------- --- ---- ---- --- ----- ----------
Eth1/1 2c:4f:52:ff:fe:56:61:1f 255 255 248 254 65535 1
-> Verify if it can reach the grand master on its ptp configured interfaces
leaf-101# show ptp clock
PTP Device Type : boundary-clock
PTP Device Encapsulation : NA
PTP Source IP Address : 10.2.0.1 -> Verify if source loopback IP is as configured
Clock Identity : d4:78:9b:ff:fe:19:87:c3
Clock Domain: 0
Slave Clock Operation : Two-step
Master Clock Operation : Two-step
Clave-Only Clock Mode : Disabled
Number of PTP ports: 3
Priority1 : 255
Priority2 : 255
Clock Quality:
Class : 248
Accuracy : 254
Offset (log variance) :
Offset From Master : 12
Mean Path Delay : 168
Steps removed : 2
Correction range : 100000
MPD range : 1000000000
Local clock time: Fri Aug 22 01:56:08 2025
PTP clock state : Locked
leaf-101# show ptp parent
PTP PARENT PROPERTIES
Parent Clock:
Parent Clock Identity: 2c:4f:52:ff:fe:56:61:1f
Parent Port Number: 4
Observed Parent Offset (log variance): NA
Observed Parent Clock Phase Change Rate: N/A
Parent IP: 10.2.0.4
Grandmaster Clock:
Grandmaster Clock Identity: 00:ee:ab:ff:fe:3a:16:e7 -> Get the Grandmaster clock ID
Grandmaster Clock Quality
Class : 248
Accuracy : 254
Offset (log variance) : 65535
Priority1: 255
Priority2: 255
spine-201# show ptp clock foreign-masters record
P1=Priority1, P2=Priority2, C=Class, A=Accuracy,
OSLV=Offset-Scaled-Log-Variance, SR=Steps-Removed
GM=Is grandmaster
---------- --------------------- --- ---- ---- --- ----- ----------
Interface Clock-ID P1 P2 C A OSLV SR
---------- --------------------- --- ---- ---- --- ----- ----------
Eth1/4 00:ee:ab:ff:fe:3a:16:e7 255 255 248 254 65535 1 GM
-> Check the Grandmaster clock ID and confirm the right Grandmaster registration on clients
Cisco Nexus Dashboard provides key insights into your fabrics, providing real-time detailed information about all the flows that go in and out of your fabrics – making a network engineer’s life easier. To visualize the telemetry information on Cisco Nexus Dashboard, it is imperative to configure telemetry streaming from the fabric devices to Cisco Nexus Dashboard. With Cisco Nexus Dashboard, there are various telemetry streaming design options available as highlighted and discussed in this whitepaper.