Monitor Wi-Fi Readiness

Wi-Fi Readiness assessments

A Wi-Fi Readiness assessment feature determines:

  • The percentage of clients that are Wi-Fi 6E, 6 and 7 capable.

  • The percentage of AP infrastructure that is Wi-Fi 6E, 6 and 7 ready.

  • Based on the preceding information, recommendations are provided about the actions that you can take to experience the full benefits of the Wi-Fi 6E, 6 and 7 network.

To provide these recommendations, Catalyst Center, the assessment:

  • Assesses the Wi-Fi capabilities of wireless clients.

  • Collects AP inventory to determine which of the APs are managed by Catalyst Center, and then assesses the Wi-Fi capabilities of those APs.

  • Determines the types of wireless controllers that are in the network and whether the software that is installed on the wireless controllers is Wi-Fi 6E, 6 and 7 ready.

  • Determines the wireless LAN configuration and whether are not Wi-Fi 6E, 6 and 7 features are enabled.
Assure the Wi-Fi readiness of your network

Use this procedure to assure the readiness of your Wi-Fi 7, Wi-Fi 6E, and Wi-Fi 6 network.

Procedure


Step 1

From the main menu, choose Assurance > Wi-Fi Readiness.

The Wi-Fi Readiness dashboard appears.

Step 2

Click the location option () in the top menu bar to select the site, building, or floor from the Site hierarchy.

Step 3

Click next to the location icon and to switch between:

  • Site Map: Provides a geographical view of your network hierarchy.

  • Site Table: Provides a list-based view of all sites, including their health scores and device counts.

The location pane has this functionality:

Item Description

toggle button

List View

Click this toggle button to display the sites and buildings from your network in a table format.

Click the drop-down list for these options:

  • Hierarchical Site View: Sorts the list at a site level. From the Go to sites column, click for a site or building to display data only for that location on the Network dashboard.

  • Building/Outdoor Area view : Sorts the list at a building level. From the Go to sites column, click for a site or building to display data only for that location on the Network dashboard.

Click Export to export the device information to a CSV file.

toggle button

Map View

Click this toggle button to display the health of all the network sites on a geographic location-oriented network health map. By default, the network sites are color coded according to the severity of the problem.

Click this close icon to hide the map or table view.

Time Range setting

Enables you to display data within a specified time range on the dashboard. Do these steps:

  1. From the drop-down menu, select the length of the range: 3 Hours, 24 Hours, or 7 Days.

  2. Specify the Start Date and time; and the End Date and time.

  3. Click Apply.

Filter icon

Contains the SSID and Band options. Select the SSIDs and band frequency from the drop-down list by selecting the check boxes adjacent to them, and then click Apply. Depending on your selection, the information in the dashboard is refreshed.

Actions drop-down list

Enables you to export the dashboard to PDF format. Click Export Dashboard to view the preview page and click Save.

Enables you to customize the dashboard display when you select Edit Dashboards from the drop-down list. See Change the position of a dashlet and Create a custom dashboard.

Step 4

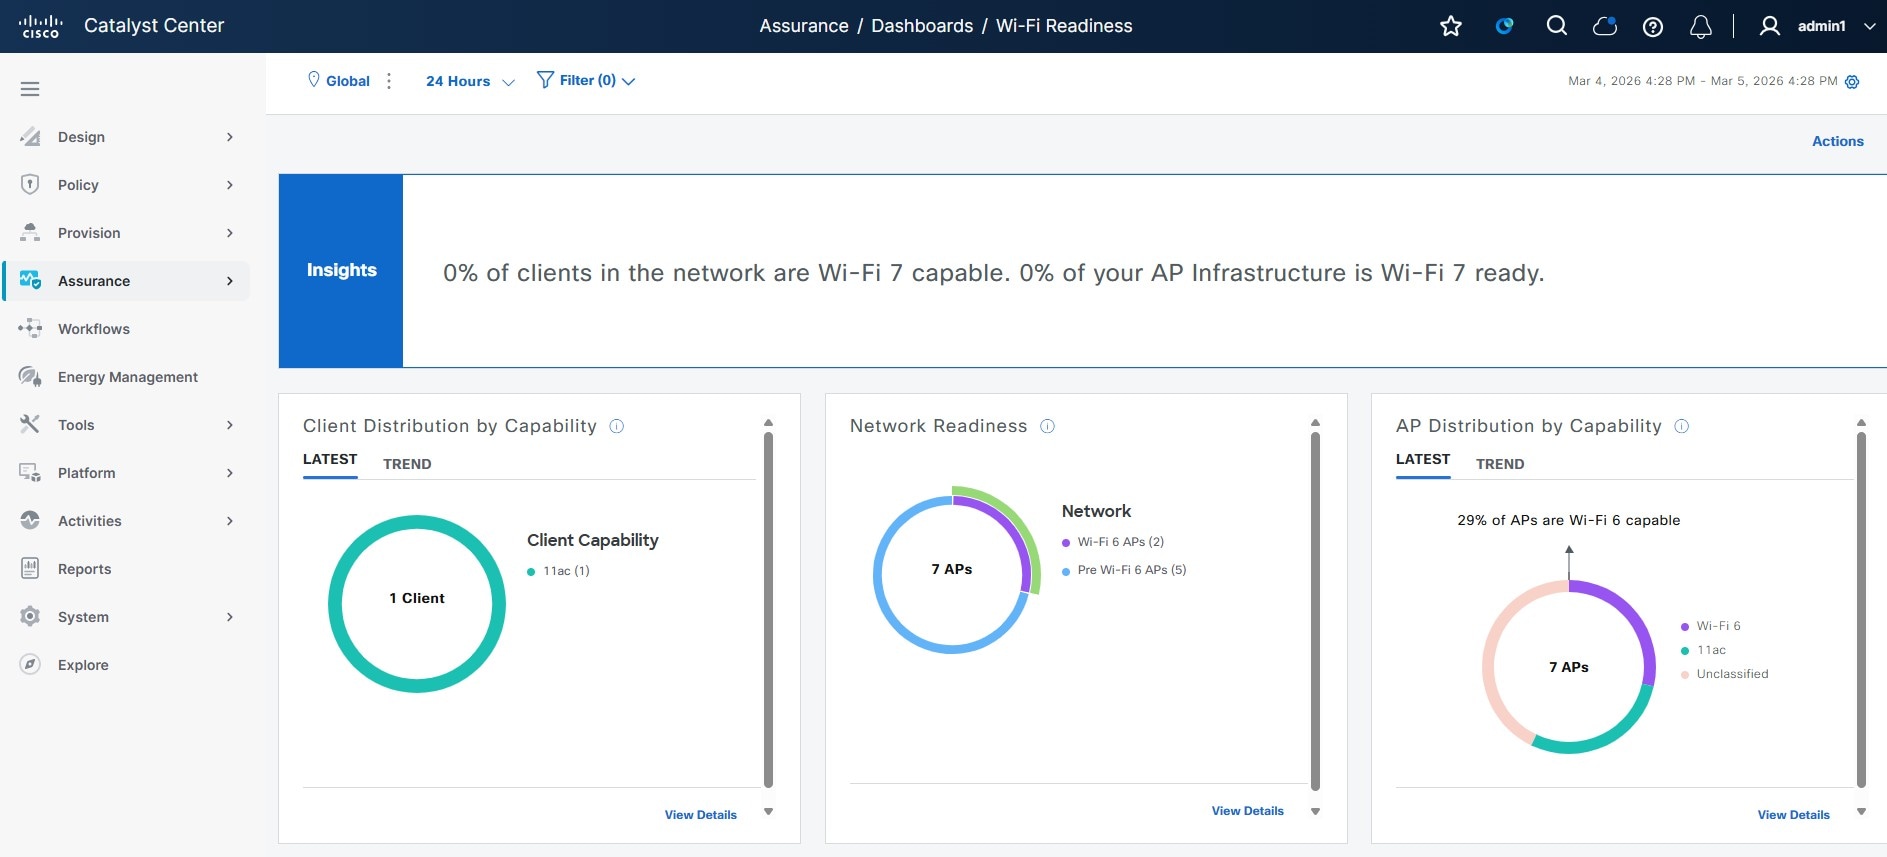
Use the Insights area to get an insight about your network. It provides this information:

  • The percentage of clients that are Wi-Fi 7, Wi-Fi 6E, and Wi-Fi 6 capable.

  • The percentage of AP infrastructure that is Wi-Fi 7, Wi-Fi 6E, and Wi-Fi 6 ready.

  • Based on the above information, recommendations on what actions you can take to enjoy the full benefits of the Wi-Fi 7, Wi-Fi 6E, and Wi-Fi 6 network are provided.

Step 5

Use the Client Distribution By Capability dashlet to compare the distribution capability of clients between Wi-Fi 7, Wi-Fi 6E, and Wi-Fi 6 and to determine if the Wi-Fi 7, Wi-Fi 6E, and Wi-Fi 6 capable clients joined to the network.

Based on the AP to which the clients are associated, the clients might function at their Wi-Fi 7 capability or at a lesser capability. For example, a Wi-Fi 6 client associated to a 11ac AP will function as an 11ac client.

Client distribution by capability dashlet
You can view all the available wireless capabilities of the clients in the network such as Wi-Fi 7, Wi-Fi 6E, and Wi-Fi 6.

This dashlet includes these tabs:

  • Latest: Displayed by default.

    • The circle shows the actual wireless capability of the clients joined to the network. The wireless clients are capable of functioning in one of these protocols:

      • Wi-Fi 7: 802.11be capable client(s).

      • Wi-Fi 6E: 802.11ax 6 GHz capable client(s).

      • Wi-Fi 6: 802.11ax capable client(s).

      • 11ac: 802.11ac Wave1 and Wave2 capable client(s).

      • 11n: 802.11n capable client(s).

      • 11abg: 802.11a, b, or g capable client(s).

      • Unclassified: The client is listed under Unclassified due to these reasons:

        • The capabilities of the client device is not reported due to network delay.

        • The AP or wireless controller to which the client device is connected, does not have the correct software version installed.

    Hover your cursor over a color in the chart to display the number of clients associated with that color.

  • Trend: Click the Trend tab to display a trend chart. This color-coded trend chart shows the number of the clients that are associated to Wi-Fi 7, Wi-Fi 6E, and Wi-Fi 6, or unclassified protocols over a time range.

    Hover your cursor over the chart to display the total number of clients and their protocol for that specific day and time.

Click View Details to open a slide-in pane with additional details. From the slide-in pane, you can click a color segment in the chart to refresh the data in the table that is displayed below the chart.

Step 6

Use the Network Readiness dashlet to determine how many APs are Wi-Fi 7, Wi-Fi 6E, and Wi-Fi 6 capable and are configured (enabled) to operate.

Network Readiness dashlet
You can view all the available wireless capabilities of the clients associated with the wireless network such as Wi-Fi 7, Wi-Fi 6E, and Wi-Fi 6.
  • The outer segment of the circle shows the number of Wi-Fi 6E APs with the 6-GHz band enabled or Wi-Fi 6 APs with 11ax disabled.

    Note


    Wi-Fi 6E APs can operate in Wi-Fi 6E mode only if the wireless controllers and APs are running a software version that supports 6 GHz band.

  • The inner circle shows the number of APs that are Wi-Fi 6E, Wi-Fi 6, and non-Wi-Fi 6 (11ac/n/a/b/g) capable.

    Note


    Wi-Fi 6 APs can operate in Wi-Fi 6 mode under these conditions:

    • The 11ax configuration on the Wi-Fi 6 APs is enabled.

    • The wireless controllers and APs are running a software version that supports Wi-Fi 6 (11ax).

Click View Details to open a slide-in pane with additional details. From the slide-in pane, click a color segment in the chart; AP and WLC tabs display. Click the AP and WLC tabs to display Wi-Fi 6 readiness at radio and band levels, respectively.

Step 7

Use the AP Distribution by Protocol dashlet to determine the number of APs that have the hardware capability to support the Wi-Fi standards: Wi-Fi 7, Wi-Fi 6E, and Wi-Fi 6

AP distribution by protocol dashlet

This dashlet includes these tabs:

  • Latest: Displayed by default. It shows the number of APs that support Wi-Fi 7, Wi-Fi 6E, and Wi-Fi 6

    • Wi-Fi 7: 802.11be capable client(s).

    • Wi-Fi 6E: 802.11ax 6 GHz band capable AP(s).

    • Wi-Fi 6: 802.11ax capable AP(s).

    • 11ac: 802.11ac capable AP(s).

    • 11n: 802.11n capable AP(s).

    • 11abg: 802.11a/b/g capable AP(s).

    Hover your cursor over a color in the chart to display the number of APs associated with that color.

  • Trend: Click the Trend tab to display a trend chart. This color-coded trend chart shows the number of the APs that are associated to the different protocols Wi-Fi 7, Wi-Fi 6E, and Wi-Fi 6) over a time range.

    Hover your cursor over the chart to display the total number of APs and their protocol for that specific day and time.

Click View Details to open a slide-in pane with additional details. From the slide-in pane, you can click a color segment in the chart to refresh the data in the table that is displayed below the chart.