Deterministic Demand Matrix

Demand matrix

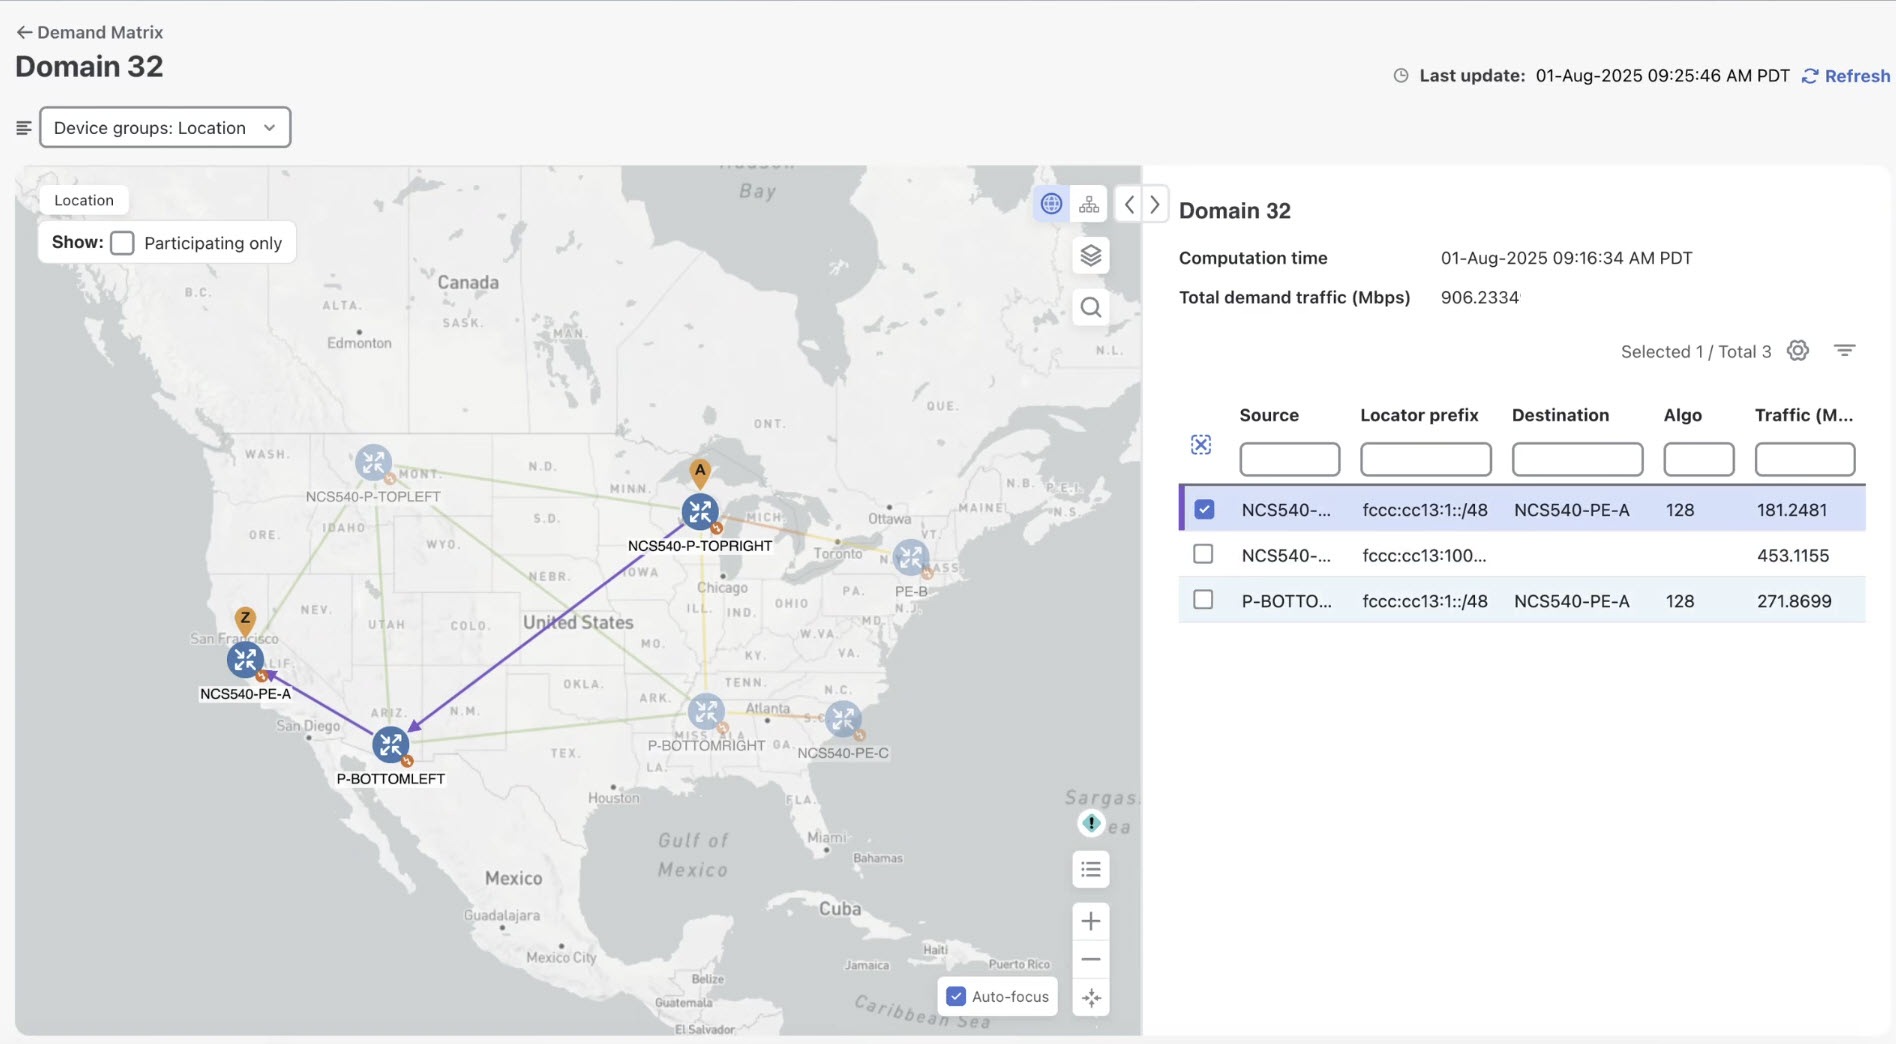
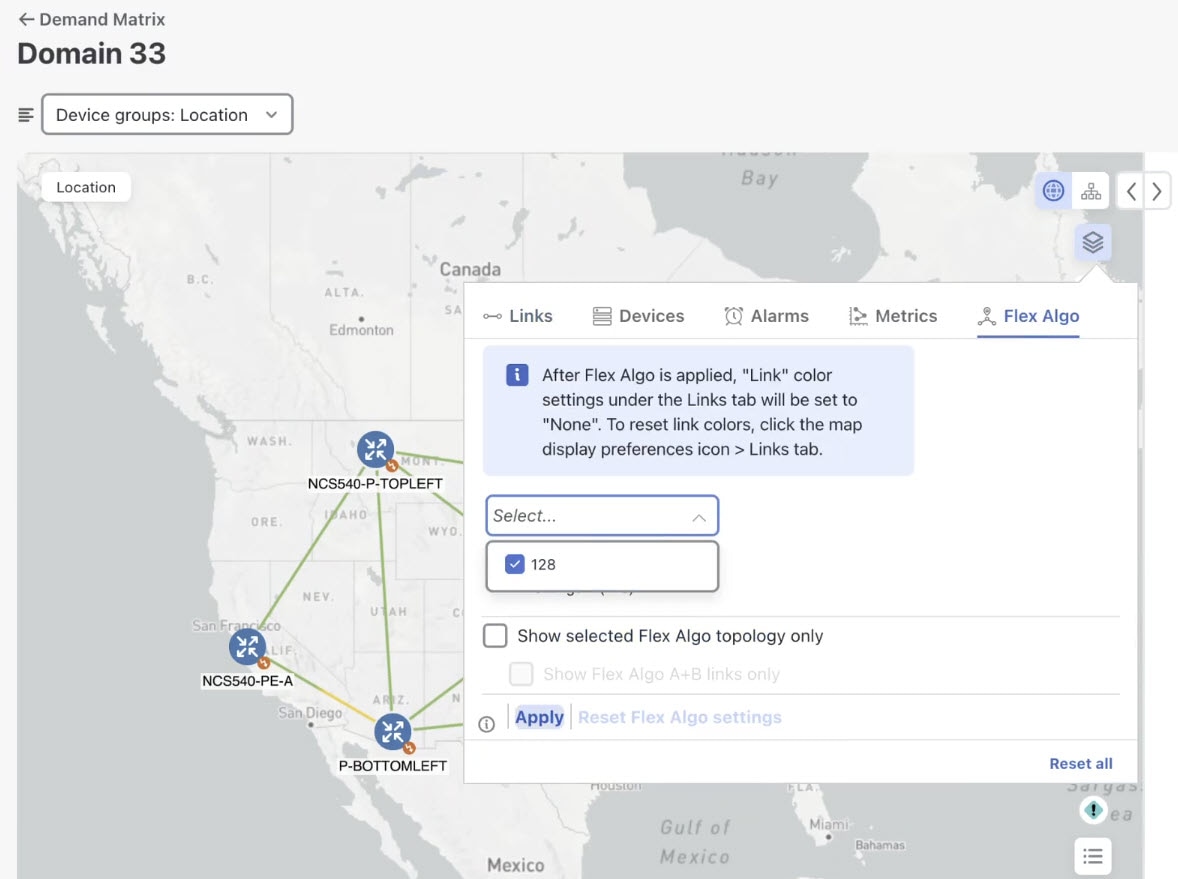
The Demand Matrix is a representation of the aggregate SRv6 traffic flows within a network domain. Each flow (demand) corresponds to the total SRv6 traffic entering the domain at a specific node and exiting at another, destined for a specific Locator. Demands are associated with specific destination SRv6 Locators, which define how traffic is forwarded within the domain based on any relevant flex-algo assigned to the Locator. The Demand Matrix, also referred to as the Deterministic Demand Matrix (DDM), provides

  • detailed, near real-time visibility into SRv6 traffic demands within IGP domains, and

  • granular insights into traffic patterns, traffic volume, and where potential bottlenecks may arise.

It achieves this by leveraging per-locator, per-egress interface counters from network devices. Refer to the Segment Routing v6 Configuration Guide for Cisco 8000 Series Routers, Cisco IOS XR Releases guide for information on how SRv6 locator counters track external and internal traffic flows and calculate net external traffic using the demand matrix.

Advantages of using DDM

Using DDM offers several key benefits for network monitoring, analysis, and planning:

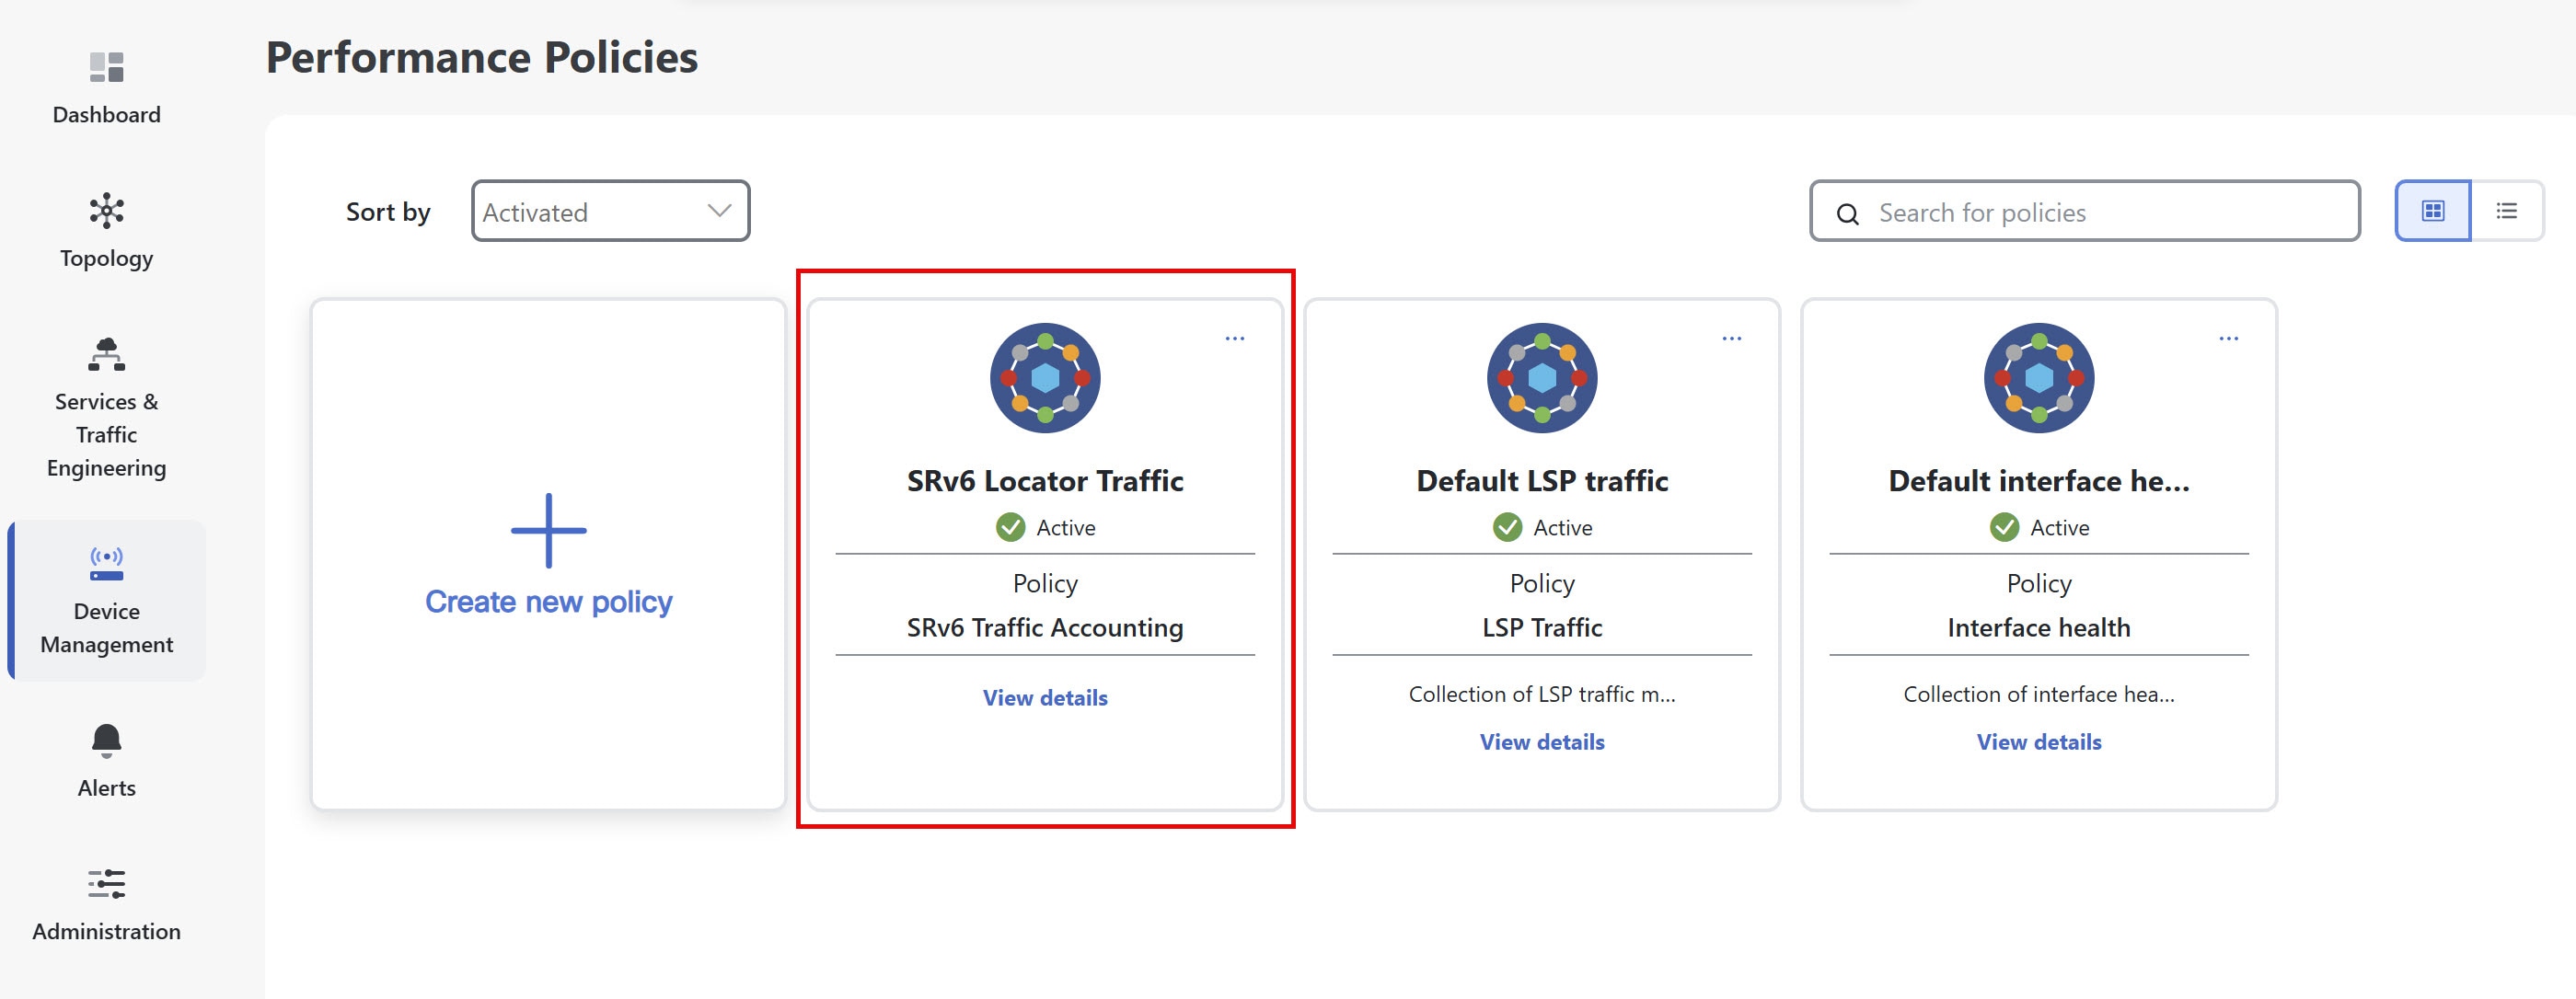
  • Enhanced visibility: Gain clear insights into traffic flow demands across the network through the Crosswork Network Controller UI.

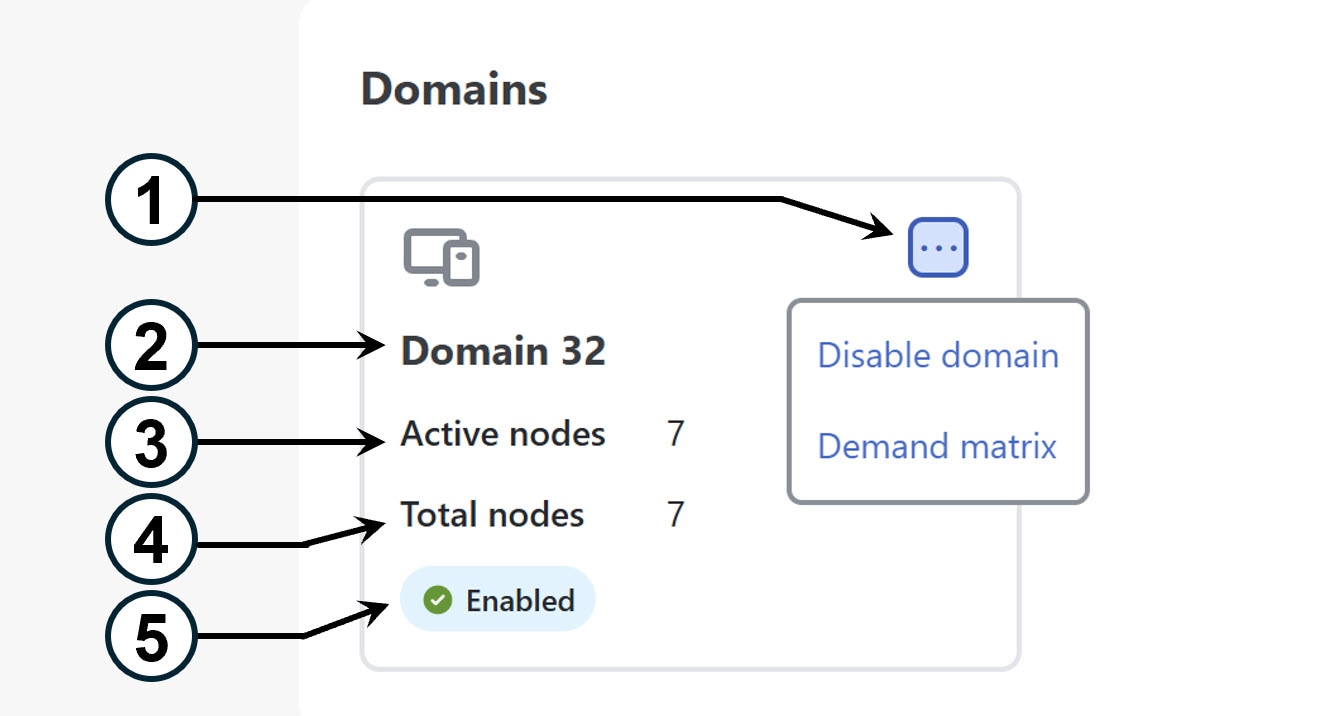
  • Per-Domain insights: Easily manage and monitor individual IGP domains. View metadata about active/total nodes and traffic reporting status within each domain.

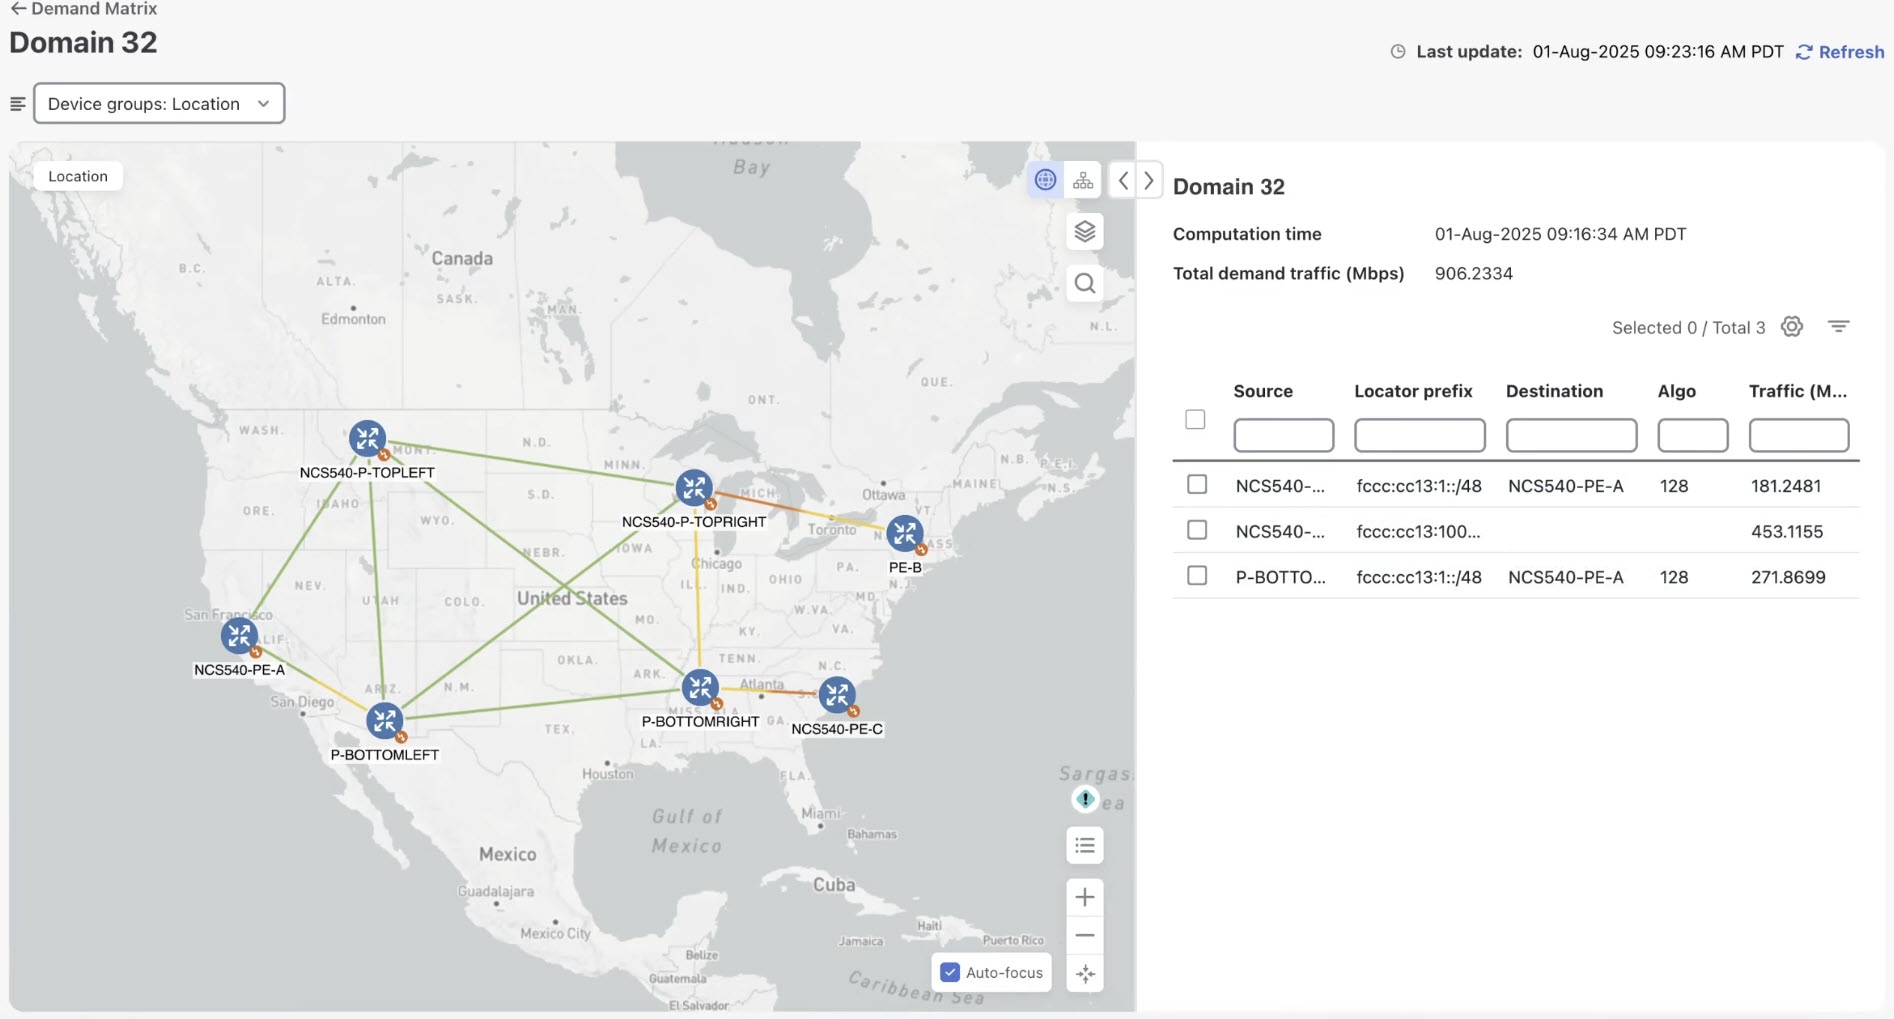
  • Effective Network Planning: Filter demands to view those routed over specific links or interfaces, supporting targeted troubleshooting and planning by identifying traffic distribution and potential bottlenecks.

How DDM Works

At its core, DDM continuously collects per-locator, per-egress interface (LOC.INT.E) counters directly from network devices. It uses this counter data, along with network topology to deterministically compute traffic demands for each IGP domain. These computed demands are then used to visualize traffic patterns overlaid on the topology map.

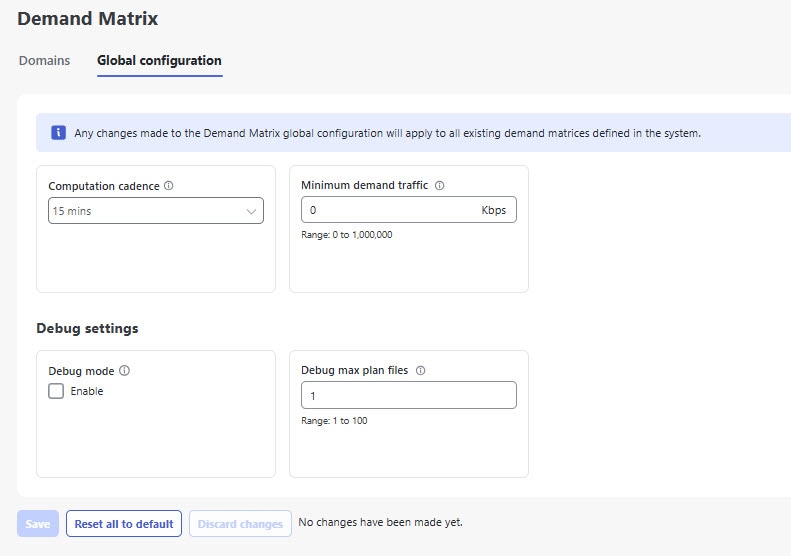
DDM uses a user-defined cadence to determine how often the demand matrices are updated. When a computation interval is reached, DDM retrieves the latest network topology to perform demand computation. Once computed, these demands are used for path visualization and detailed link views. DDM also records domain metadata, such as the total and active nodes, providing context on domain health and activity.

  • If a device misses sending a counter update, DDM uses the previously received counter records to continue computing demands, ensuring continuity.

  • DDM has two-cadence grace period to maintain operational stability. This period ensures that late-arriving counter updates are processed, and that demands (such as those from a removed node or link) or domains stay visible in the UI for up to two cadences before being cleared.

DDM device and configuration requirements

For DDM to provide visibility into traffic demands, your network devices must meet these requirements and configurations.

Platform compatibility

Your devices must meet these requirements.

  • Devices must be running Cisco IOS-XR version 7.10.1 or higher to support the LOC.INT.E counters. Most platforms support this by version 24.3.1.


    Note


    Currently, there is no support for Cisco XE or multi-vendor environments.


  • Enable gNMI for all participating devices, by adding gNMI credentials profile, and gNMI protocol connectivity. For more infomation, see Add and Configure Devices in Cisco Crosswork Network Controller Administration guide.

Configure and activate performance policy

DDM relies on specific performance policies to collect necessary SRv6 locator from devices. To collect locator counters, you must configure and activate an SRv6 traffic accounting policy.

To create the policy, complete these steps:

Procedure


Step 1

From the main menu, choose Device Management > Performance Policies. Click Create new policy.

Step 2

Configure these policy parameters:

  1. Choose SRv6 traffic accounting as the policy type.

  2. Enter a policy name.

  3. Select devices and choose Cisco IOS-XR devices with gNMI enabled.

  4. Click Next.

Step 3

Set polling frequency to define how often devices should be polled for this policy. By default data will be collected according to the polling frequency.

Step 4

Click Activate to apply the policy. The policy appears under Performance Policies.

Figure 1. SRv6 traffic accounting performance policy
SRv6 traffic accounting performance policy

Configure device configurations

These configurations are required on your Cisco IOS-XR devices to enable SRv6 data collection and traffic steering for DDM integration.

Procedure


Step 1

Enable SRv6 locator accounting.

This configuration enables the router to perform detailed accounting for IPv6 traffic specifically related to SRv6 locators. By tracking traffic on a per-prefix and per-nexthop basis, operators gain granular visibility into the usage and flow of SRv6-enabled services.

RP/0/RP0/CPU0:L1-NCS5501#sh running-config accounting 
accounting
 prefixes
  ipv6
   mode per-prefix per-nexthop srv6-locators
  !
 !
!

Step 2

Enable SRv6 accounting data to telemetry

This configuration sets up model-driven telemetry on the router to stream SRv6 accounting data to external collectors. By defining specific sensor paths, the router can push operational data related to SRv6 locator accounting, enabling real-time monitoring, analysis, and orchestration of SRv6 network performance and traffic patterns.

RP/0/RP0/CPU0:L1-NCS5501#sh running-config telemetry model-driven
telemetry model-driven
 sensor-group cisco_models

  sensor-path Cisco-IOS-XR-fib-common-oper:cef-accounting/vrfs/vrf[vrf-name='default']/afis/afi[afi-type=ipv6]/pfx/srv6locs/srv6loc
 !
!

Step 3

Enable customer/VRF traffic steering to SRv6 locators via BGP

This configuration enables an edge router to steer customer or VRF (Virtual Routing and Forwarding) IPv4 and IPv6 traffic into specific SRv6 locators using BGP.

RP/0/RP0/CPU0:L1-NCS5501#sh running-config router bgp 
router bgp 60
 bgp router-id <ROUTER_ID_IP>
 segment-routing srv6
  locator L1algo0
 !
 address-family ipv4 unicast
  network <ROUTER_ID_IP>/32
 !
 address-family vpnv4 unicast
  vrf all                ! If there are multiple VRF where traffic is ingressing, add srv6 locator in vrf all. 
   segment-routing srv6
    locator L1algo0
    alloc mode per-vrf
   !
  !
 !
 vrf ntt
  rd 200:200
  address-family ipv4 unicast
   segment-routing srv6   ! If there is only one VRF where traffic is ingressing, add srv6 locator in this vrf alone, if there is no VRF, then add the locator in neighbor address family 
    locator L1algo0
    alloc mode per-vrf
   !
   redistribute connected
  !
  neighbor <NEIGHBOR_IP>
   remote-as 61
   update-source GigabitEthernet0/0/0/0
   address-family ipv4 unicast
    route-policy PASS_ALL in
    route-policy PASS_ALL out
   !
  !
 !

Step 4

Verify SRv6 traffic steering via CEF accounting

To verify that IPv6 traffic is being steered into SRv6 locators, rather than MPLS labels, use the sh cef ipv6 accounting command on the device.

sh cef ipv6 accounting
fccc:cc3e:3::/48
Accounting: 0/0 packets/bytes output (per-prefix-per-path mode)
 via fe80::2/128, Bundle-Ether1201
  path-idx 0
  next hop fe80::2/128
  Accounting: 200000/58400000 packets/bytes output  <<< Traffic packets for prefix fccc:cc3e:3::

Important considerations when using DDM

Before using DDM, review these important considerations applicable for Crosswork Network Controller version 7.2.

  • SRv6 policy accuracy: The demand matrix may be inaccurate in the presence of SRv6 policies. Full incorporation of these policies is planned for future phases.

  • Summarized locators: There is no current support for redistributed or summarized locators across IGP domain boundaries. While demands for these locators are computed, they will appear as unrouted.

  • Locator leaking: Locator leaking is assumed to occur at IS-IS level boundaries.

  • High availability (HA): DDM does not support HA. This means there is no built-in redundancy or failover capability, and data loss may occur during upgrades or unexpected restarts.

  • User permissions: Users must have admin permissions to modify global configurations and perform enable/disable actions on domains. Read-only users can only view demand matrices.

  • Locator accounting coverage: For the most accurate and complete SRv6 demand matrix, Locator counter collection should include every device in the IGP domain. See Locator counter collection coverage for the effects of partial coverage.

  • Locator counter collection synchronization: Collecting locator counters from nodes at different times during the collection interval can result in transient false demands. See Locator Counter Collection Synchronization for details and mitigation steps.

Manage demand matrix domains

Use these dashboards to manage demand matrix domains and visualize the demands in detail by drilling down to specific locators and links:

  • Domain dashboard: Acts as the central hub for managing and monitoring all IGP domains. It displays all discovered domains and provides an overview of each domain's status and key metadata.

  • Global configurations: Allows you to define global settings that influence how DDM operates across all monitored IGP domains.

  • Demand matrix: Provides a detailed view of the computed demands for a selected domain and its visualization on the topology map.

Demand matrix domains dashboard

The Demand matrix domain dashboard (Services & Traffic Engineering > Demand Matrix) displays all the domains discovered by Crosswork Network Controller. A domain is an identifier assigned to an IGP process.


Note


The domains will begin displaying the updated info on active and total nodes, per the specified cadence set in the Global configuration settings. The default cadence is 15 minutes.


Figure 2. Demand matrix domains dashboard
Demand matrix domains dashboard
Callout No. Description

1

  • Enable domain: Enable the domain to start demand computation and visualization for that domain. By default, domains are in a disabled state.

  • Disable domain: Disable the domain to stop demand computation for that domain. You will not be able to see the demand matrix for this domain in a disabled state.

  • Demand matrix: View detailed traffic demand metrics for the domain on a topology map.

2

Domain identifier: The domain ID is taken from the router configuration (link-state instance-id) that is used to advertise IGP with BGP-LS.

3

Active nodes: Number of nodes in the domain that are actively sending SRv6 locator counter data to DDM.

4

Total nodes: Total nodes in the domain.

5

Status: Indicates whether DDM is enabled for the domain.

Configure global configurations

The Demand Matrix global configuration allows you to define system-wide settings that influence how the DDM operates across all monitored IGP domains. By adjusting these system-wide settings, you can influence the frequency of demand computations, filter out insignificant traffic, and manage debug logging as per your monitoring requirements. Configuration updates made here are also captured in the audit logs.

Procedure


Step 1

From the main menu, choose Services & Traffic Engineering > Demand matrix and click on the Global configuration tab.

Figure 3. Demand Matrix global configuration
Demand Matrix global configuration

Step 2

Adjust the required settings.

Note


Any changes made to the Demand Matrix global configuration will apply to all existing demand matrices defined in the system.

  1. Computation Cadence: Select the frequency for demand matrix computation (15, 30, or 60 minutes). The default is 15 minutes. This cadence should be logically set to the same or a higher value than the polling frequency for the "SRv6 traffic accounting" performance policy.

  2. Minimum Demand Traffic: Set a minimum traffic threshold (default is 0 Kbps). Demands with traffic below this value will be excluded from visualization, allowing focus on significant traffic flows.

  3. Debug mode: Enable debug optimizer to log plan files to the Crosswork Network Controller file system. Files are saved to the maximum number of files you specify in Debug max plan files.

  4. Debug max plan files: Set the maximum number of debug plan files you would like to save. The default is 1.

Step 3

Click Save to save your configuration.


View demand matrix

The Demand Matrix interface is your primary tool for monitoring SRv6 traffic demands, offering both a comprehensive overview of domain-wide traffic, the ability to drill down into specific demand paths, and to view demands routed through a particular link.


Note


DDM operates strictly on a per-IGP domain basis. For traffic that crosses domain boundaries, it can accurately quantify the amount of traffic destined for an SRv6 locator in a neighboring domain. Within the current domain, you will see this traffic visualized as originating from the domain boundary router and extending to its destination within that domain. However, DDM cannot currently visualize the traffic's path beyond the current domain, meaning the full end-to-end path into the neighboring domain will not be displayed.


To view and monitor demand matrix, complete these steps:

Procedure


Step 1

From the main menu, choose Services & Traffic Engineering > Demand matrix > Enabled Domain-ID > More icon > Demand matrix.

The Domain's demand matrix page is displayed with the different domain nodes in a topology map.

Figure 4. Demand matrix for a domain
Demand matrix for a domain

On the right-hand side, you can view the computation time (reflecting the configured cadence) and the total traffic volume across all demands in the domain. A table lists all individual demands, detailing their source, destination, locator prefixes, and traffic volume.

Step 2

To visualize a specific demand's details, select it from the list. You can then see its IGP path from the source to the destination on the topology map, including details like the flexible algorithm used and traffic volume.

Figure 5. Visualize demand metric
Visualize demand metric

Step 3

You can filter metrics by Flex Algo. To visualize the flexible algorithm topology:

  1. On the topology map, click Display Preferences icon and then click Flex Algo.

  2. From the drop-down list, select the flexible algorithm ID (for example, 129) to filter.

  3. (Optional) Select Show selected Flex Algo topology only to isolate the flexible algorithms on the topology map.

  4. Click Apply to display the updated topology map.

    Figure 6. Flex algo in demand matrix
    Flex algo in demand matrix

Step 4

To view metrics for the IGP path:

  1. Select a demand metric from the table and click Display Preferences icon and then click Metrics.

  2. Toggle applicable metrics to On.

Step 5

To view demands routed through a particular link:

  1. On the topology map, click on a link.

  2. From the Links page, select View details for the link. This displays the Link details page.

  3. Click the Traffic engineering tab then click the Demands tab.

    All demands routed through this link are displayed. Along with other link details, the table also shows the ECMP split percentage between these demands and the flex algos using that link.


Locator counter collection coverage

For the most accurate and complete SRv6 demand matrix, Locator counter (LOC.INT.E) collection should include every device in the IGP domain. This is the recommended deployment model for DDM. With partial coverage (for example, when some devices support Locator accounting and others do not), the demand matrix may be impacted in several ways, including:

  • false demands

  • missing demands

  • double counting of traffic

In general, with partial LOC.INT.E coverage, false demands can arise at any node serving as a transit for traffic to a Locator (for example, when the node has non-zero LOC.INT.E counters for transiting traffic), if one or more neighboring nodes do not support LOC.INT.E counters and, as a result, the ingress counters from those neighbors are not considered.

Locator counter collection synchronization

Locator counters are collected from each device via gNMI streaming, with each device sending updates periodically. Because these updates represent different snapshots in time, the data across devices may not be perfectly synchronized within the collection interval. As a result, transient false demands with relatively low rates may appear on different nodes, especially when traffic is dynamic over short periods.

To address this, you can set a Minimum Demand Traffic threshold. Any detected demands below this value will be filtered out, reducing the impact of such false demands. However, use this setting carefully: if your network includes legitimate, low-rate demands that are important, setting the threshold too high could also filter out real demands.