Upgrade SD-WAN Controllers with the Use of vManage GUI or CLI
Available Languages
Download Options
Bias-Free Language
The documentation set for this product strives to use bias-free language. For the purposes of this documentation set, bias-free is defined as language that does not imply discrimination based on age, disability, gender, racial identity, ethnic identity, sexual orientation, socioeconomic status, and intersectionality. Exceptions may be present in the documentation due to language that is hardcoded in the user interfaces of the product software, language used based on RFP documentation, or language that is used by a referenced third-party product. Learn more about how Cisco is using Inclusive Language.
Contents
Introduction
This document describes the process to upgrade the Software-Defined Wide Area Network (SD-WAN) Controllers.
Prerequisites
Requirements
Cisco recommends that you have knowledge of these topics:
- Cisco Software-Defined Wide Area Network (SD-WAN)
- Cisco Software Central
- Download the Controllers software from software.cisco.com
- Run the AURA script before the upgrade CiscoDevNet/sure: SD-WAN Upgrade Readiness Experience
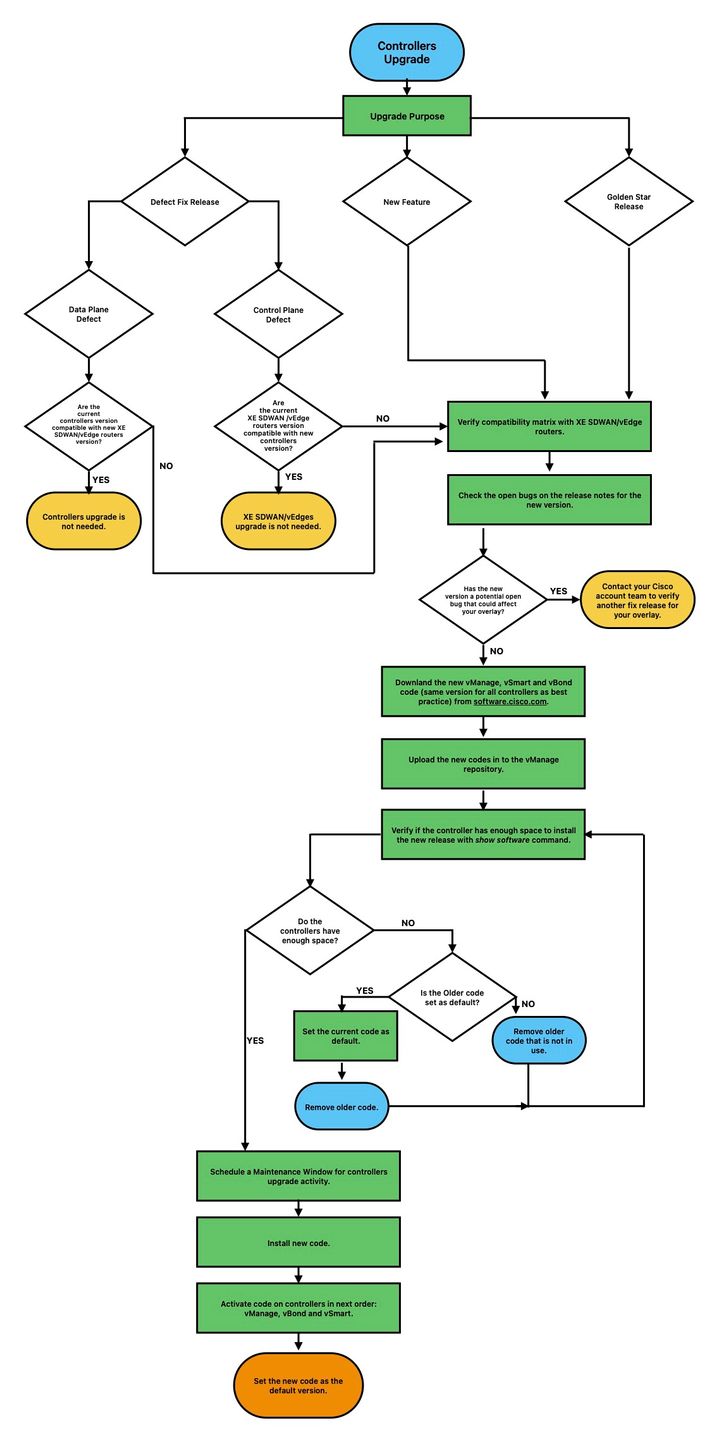
There could be multiple reasons to plan for a Controllers upgrade, such as:
- New releases with new features.
- Fix of known caveats/bugs.
- Deferred Releases.
Note: If the release has been deferred, it is a best practice to upgrade as soon as possible to the gold-star version. Deferred releases are not recommended on production controllers due to know defects.
When it is time to upgrade your Controllers, please consider the next useful information:
- Verify the Release Notes of the SD-WAN Controllers.
- Verify the Cisco vManage Upgrade Paths.
- Verify the Cisco SD-WAN Controllers meet the Recommended Computing Resources.
- Verify the End-of-Life and End-of-Sale Notices of the SD-WAN products.
Note: The order to upgrade the SD-WAN Controllers is vManage > vBonds > vSmarts.
Components Used
This document is based on these software versions:
- Cisco vManage 20.12.6 and 20.15.4.1
- Cisco vBond and vSmart 20.12.16 and 20.15.4.1
The information in this document was created from the devices in a specific lab environment. All of the devices used in this document started with a cleared (default) configuration. If your network is live, ensure that you understand the potential impact of any command.
Pre-checks to Be Performed Prior to a Controller Upgrade
Backup your vManage
- If cloud-hosted, confirm the latest backup is done or initiate a backup of config db as mentioned in the next step.
- You can view the current backups as well as trigger an on-demand snapshot from the SSP portal. Find more guidance here.
- If on-prem:
- take a config-db backup
- VM snapshot of all the controllers.
vManage# request nms configuration-db backup path /home/admin/db_backup
successfully saved the database to /home/admin/db_backup.tar.gz
- If on-prem, collect the show running-config and save this locally.
- If on-prem, ensure you know your configuration-db (neo4j) username and password and notate to your exact current version.
If you need assistance to retrieve your configuration-db credentials, you can reach out to Cisco TAC.
System Compute on the vManage

Note: This check is applicable for vBonds and vSmarts also.
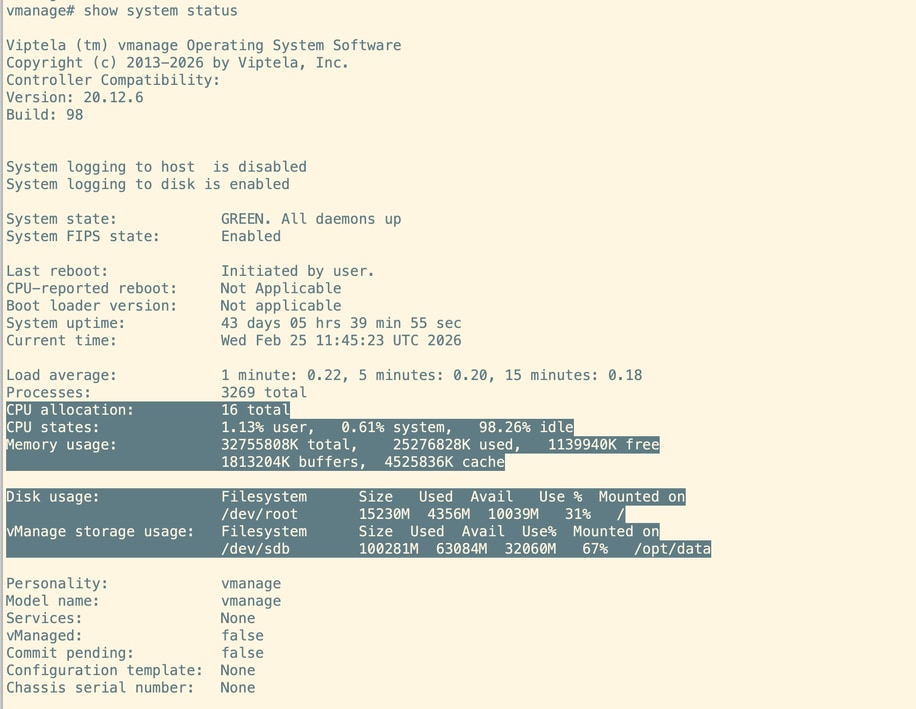
On the CLI of each vManage node, execute the command show system status. Make sure the required compute are mapped to the vManage nodes. You can refer to the Compute Guide.
Run an AURA Check
- Download and adhere to the steps in order to run AURA from CiscoDevNet/sure: SD-WAN Upgrade Readiness Experience
- For detailed steps, please refer to this guide: Configure Aura Deployment Before Upgrade.
- Open to a TAC SR in order to address any questions related to the failed checks in the AURA report.
- From 20.11.x onwards, vManage automatically runs AURA when the image is activated is using vManage UI.
Disk Space Utilization vManage
Before starting the upgrade, verify that disk usage on all three critical partitions—/boot, /rootfs.rw, and /opt/data—is at 60% or lower.
For cleanup, look for and remove unnecessary user-copied files or uncompressed log files.
Delete any admin-tech files, heap dumps, Neo4j backups, thread dumps, or temporary files that are consuming disk space.
If you are unsure about which files can be safely deleted, open a Cisco TAC case for assistance.
Ensure Send to Controllers/Send to vBond is Done
On the vManage UI navigate to Configuration --> Certificates --> Controllers and select send to vBond
Check vManage Statistics Collection Interval
Cisco recommends the Statistics Collection Interval in Administration > Settings is set to the default timer of 30 minutes.
Note: Cisco recommends that your vSmarts and vBonds be attached to the vManage template before an upgrade.
Verify NMS Diagnostics on all the vManage nodes
Execute the command "request nms all diagnostics" and make sure the NPing for all the NMS services are successfull. Incase of vManage cluster these checks need to be performed on all the vManage nodes:
Note: In a 6 node vManage cluster, configuration-db runs on 3 nodes only.
Look into diagnostics for configuration-db:
Ensure we are able to get configuration-db attributes as below:
Make sure all the vManage nodes are listed in Neo4j Cluster Status for both "neo4j" and "system"
Make sure the schema validation is successfull and none of the Neo4j nodes are quarantined.
Go through the entire output and if there are any errors or failures noticed, please reach out to TAC before proceeding with the upgrade.
Check the Disk Space usage on vManage nodes
Make sure except for /rootfs.ro, none of the other disk partitions have more than 60% as use%. Verify this on all vManage nodes.

Verify Disk Space on vSmart and vBond
Use the command df -kh | grep boot from vShell to determine the size of the disk.
controller:~$ df -kh | grep boot
/dev/sda1       2.5G  232M  2.3G  10% /boot
controller:~$
If the size is greater than 200 MB, proceed with the upgrade of the controllers.
If the size is less than 200 MB, pursue these steps:
1. Verify the current version is the only one listed under show software command. This check is applicable for all 3 controllers, vManage, vBond and vSmart.
VERSION    ACTIVE   DEFAULT PREVIOUS  CONFIRMED TIMESTAMP
------------------------------------------------------------------------------
20.12.6     true    true    false    auto     2023-05-02T16:48:45-00:00
20.9.1      false   false   true     user     2023-05-02T19:16:09-00:00
2. Verify the current version is set as default under show software version command. This check is applicable for all 3 controllers, vManage, vBond and vSmart.
controller# request software set-default 20.12.6
status mkdefault 20.11.1: successful
controller#
3. If more versions are listed, remove any versions not active with the command request software remove <version>. This increases the space available to proceed with the upgrade. This check is applicable for all 3 controllers, vManage, vBond and vSmart.
controller# request software remove 20.9.1
status remove 20.9.1: successful
vedge-1# show software
VERSION   ACTIVE DEFAULT PREVIOUS CONFIRMED TIMESTAMP
------------------------------------------------------------------------------
20.12.6   true   true    false    auto      2023-05-02T16:48:45-00:00
controller#
4. Check the disk space in order to ensure it is greater than 200 MB. If it is not, proceed to open a TAC SR.
Before and After Commands
Before and after the upgrade, execute these commands to verify that the controllers have properly converged:
-
show control connections
Ensure each controller has active control connections with all other controllers (full mesh). -
show omp peers (vSmart only)
Verify the number of OMP peers on each vSmart controller. -
show omp summary (vSmart only)
Check overall OMP status and peer information. -
show running policy (vSmart only)
Confirm that all intended policies are active and visible on the controller.Review the output of these commands both before and after the upgrade to ensure network stability and proper convergence.
Controllers Upgrade Workflow
vManage Cluster Upgrade
In the case of cluster upgrade, the steps mentioned in the Cisco SD-WAN Getting Started Guide - Cluster Management [Cisco SD-WAN] - Cisco guide must be pursued.
Note: The vManage cluster upgrade has no impact on the data network. For standalone vManage we can install and activate the new software using vManage UI. For vManage cluster, it is recommended to install the software using vManage UI and activate the software using vManage CLI using the request software activate < > as described in the section Upgrade SD-WAN Controllers via CLI below.
Caution: if you have any questions or issues when you upgrade your cluster,contact TACbefore you proceed.
Upgrade SD-WAN Controllers via vManage Graphic User Interface (GUI)
Step 1. Upload the software images to vManage repository
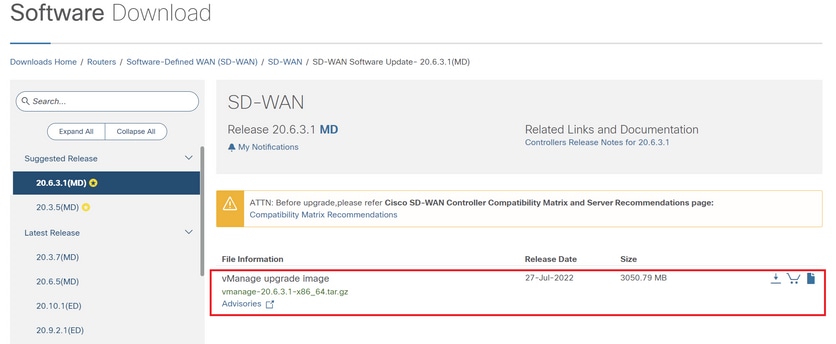
Navigate to Software Download and download the required software version image for vManage.
Note: There are two types of images for controllers: new deployment and upgrade. For the scope of this guide, the image to download must be an upgrade image.
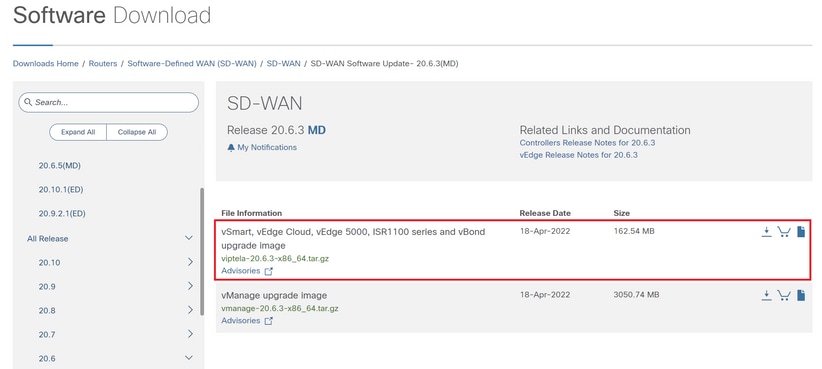
Navigate to Software Download and download the software version image for vBond and vSmart.
Note: The upgrade image for vBond and vSmart is the same.

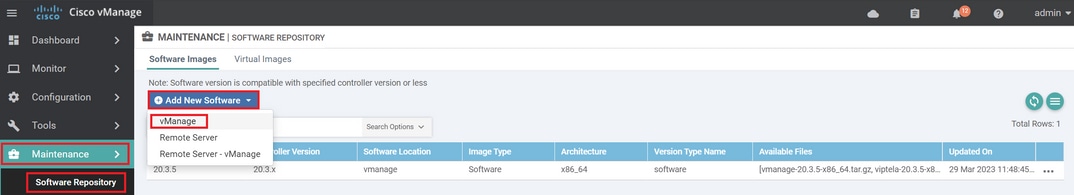
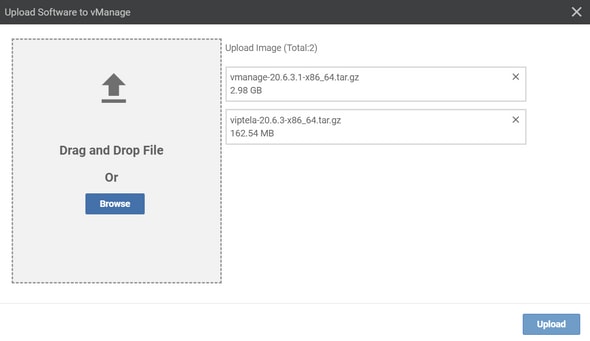
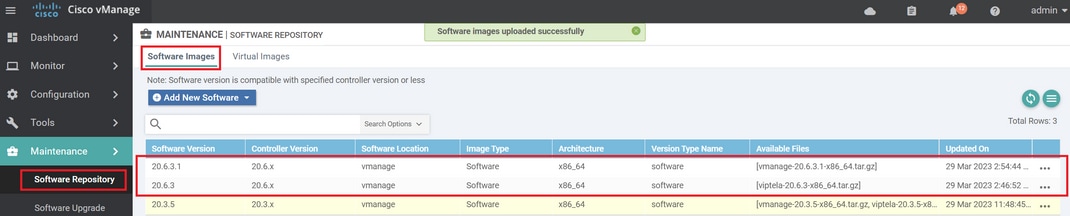
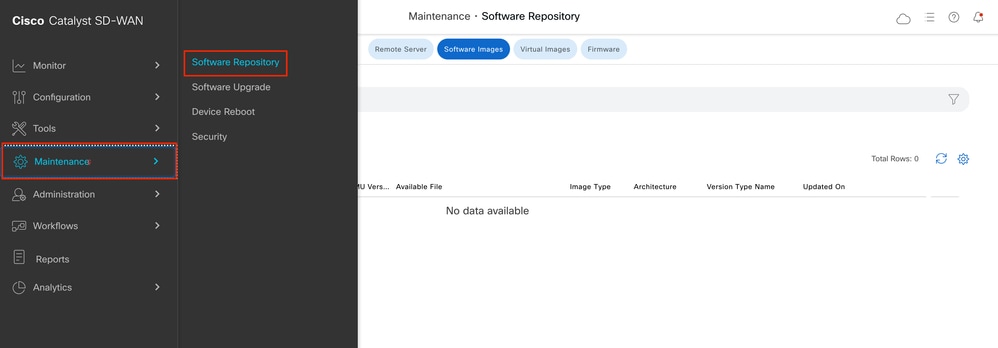
To upload the new images, navigate to Maintenance > Software Repository > Software Images.
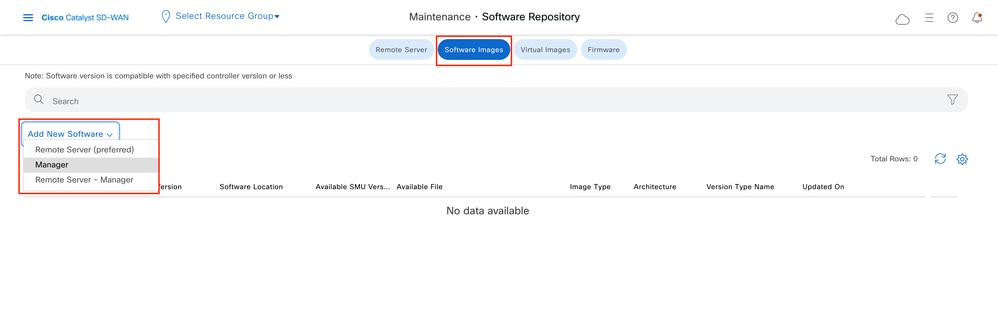
Click Add New Software and select vManage in the drop-down menu.
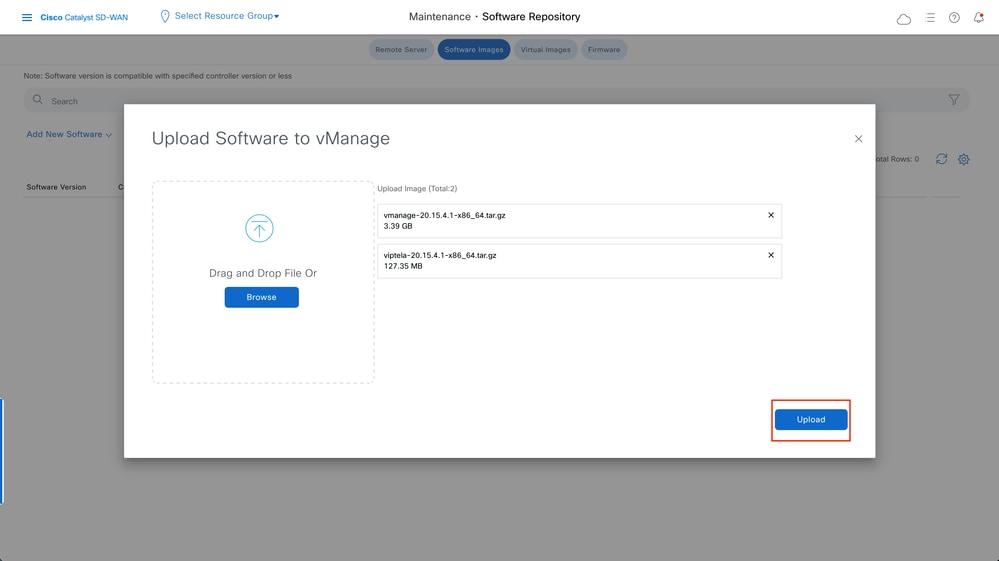
Select the images and click Upload.
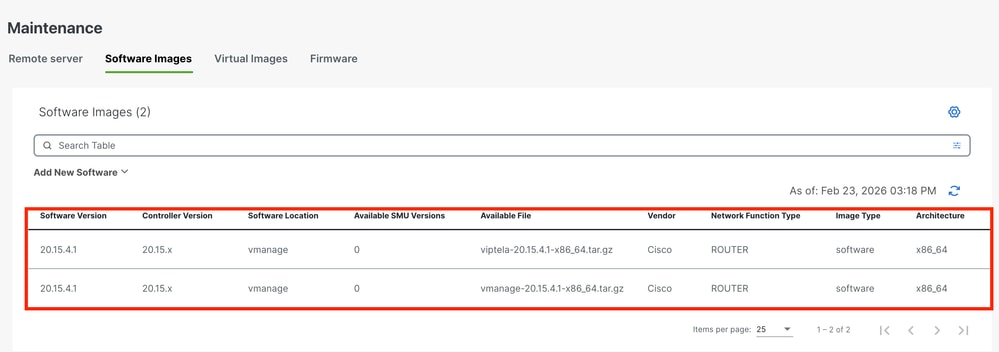
Once the images are uploaded, verify they are listed in Software Repository > Software Images.
Step 2. Installation, Activation and Set New Version as Default
This step explains how to perform the upgrade in three steps, installation, activation and set the new version as default.
vManage
Caution: Ensure you have validated the pre-checks to be performed prior to a vManage upgrade.
Step A. Installation
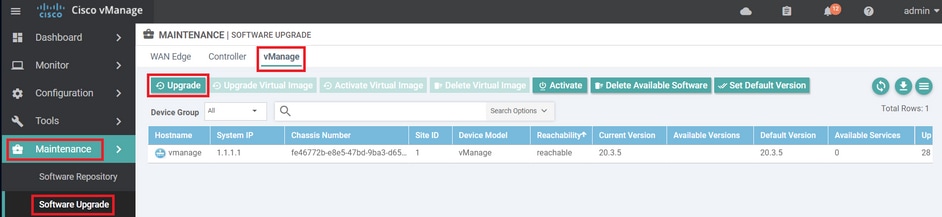
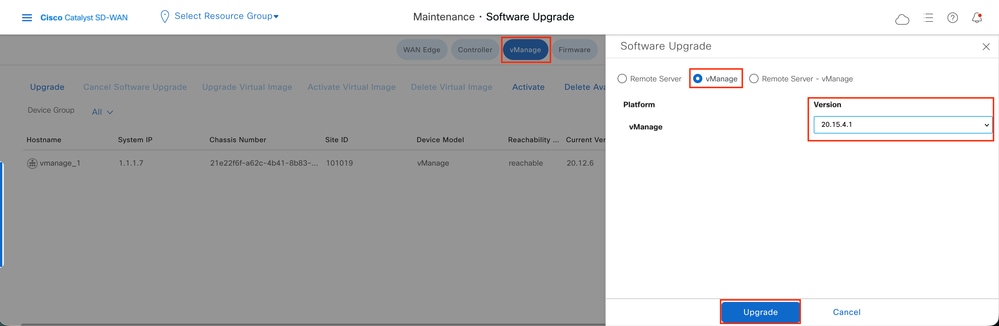
On the main menu, navigate to Maintenance > Software Upgrade > vManage and click Upgrade.
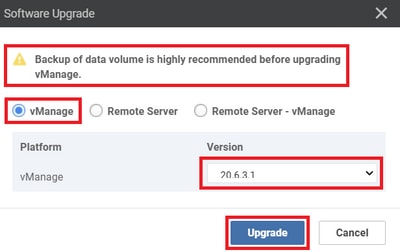
In the Software Upgrade pop-up window, do as follows:
- Choose the vManage tab.
- Select the image version to upgrade to from the version drop-down list.
- Click Upgrade.
Note: This process does not execute a reboot of the vManage, only transfers, uncompresses and creates the directories needed for the upgrade.
Note: Backup of data volume is highly recommended before to proceed with the upgrade of vManage.

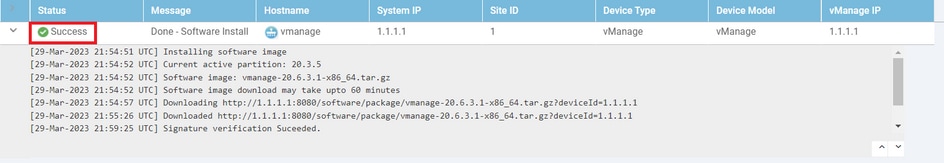
Verify the status of the task until it shows as Success.
Step B. Activation
On this step, vManage activates the new installed software version and reboots itself to boot up with the new software.
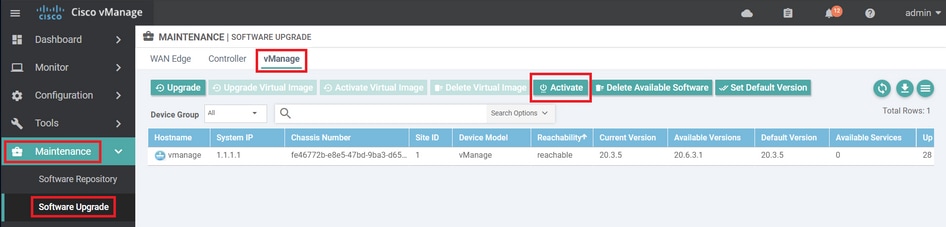
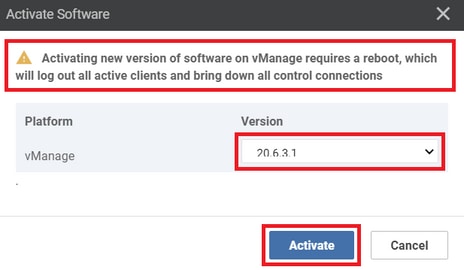
Navigate to Maintenance > Software Upgrade > vManage, and click Activate.
Select the new version and click Activate.
Note: The access to the GUI is not available while the vManage reboots. The complete activation can take up to 60 minutes.
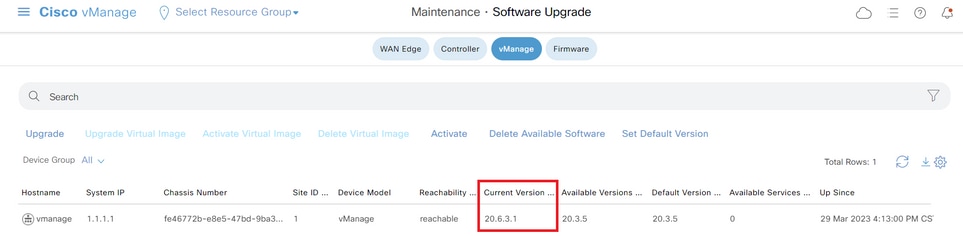
After the process finishes, log in and navigate to Maintenance > Software Upgrade > Manager to verify the new version is activated.
Step C. Set Default Software Version
You can set a software image to be the default image on a Cisco SD-WAN device. It is recommended to set the new image as default after verify that the software operate as desired on the device and in the network.
If a factory reset on the device is performed, the device boots up with the image that is set as default.
Note: It is recommended to set the new version as default because if the vManage reboots, the old version is booted up. This can cause a corruption in the database. A version downgrade from a major release to an older one, it is not supported in vManage.
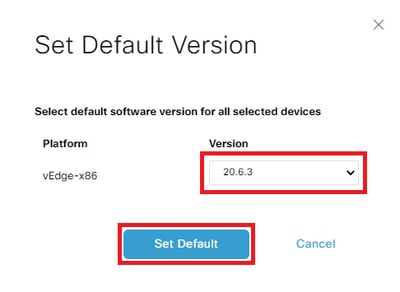
To set a software image as default image, do as follows:
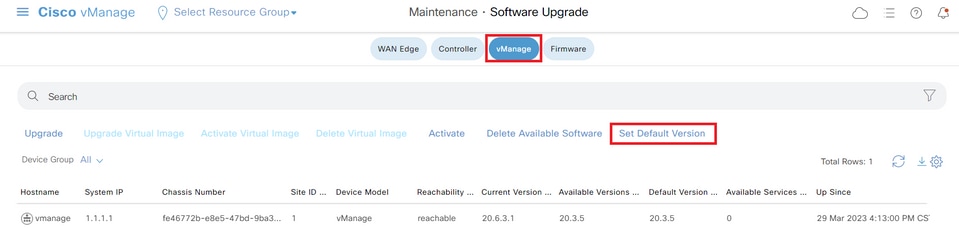
- Navigate to Maintenance > Software Upgrade> Manager > Software Image Actions.
- Click Set Default Version, select the new version from the drop-down list and click Set Default.
Note: This process does not perform a reboot of vManage.
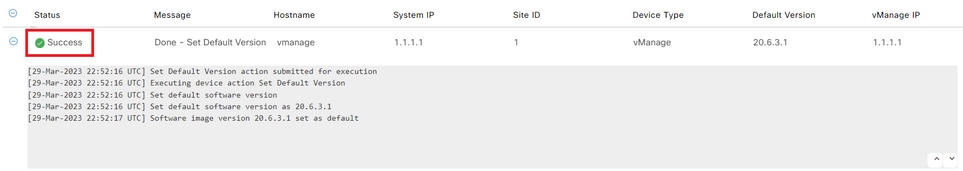
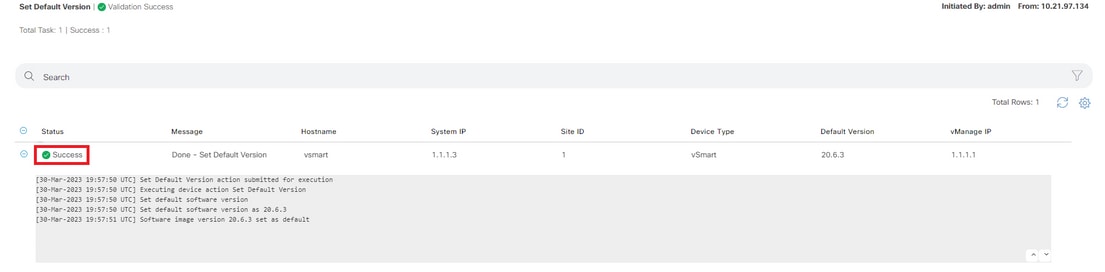
Verify the status of the task until it shows as Success.
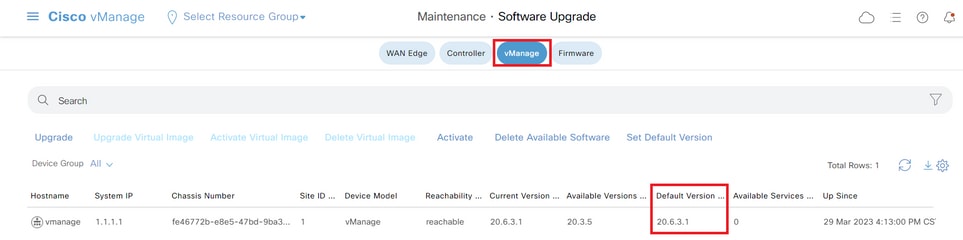
To verify the Default Version, navigate to Maintenance > Software Upgrade > Manager.
vBond
Step A. Installation
On this step, vManage sends the new software to vBond and install the new image.
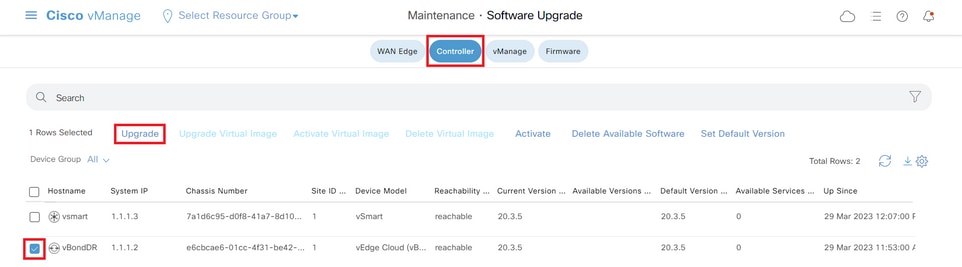
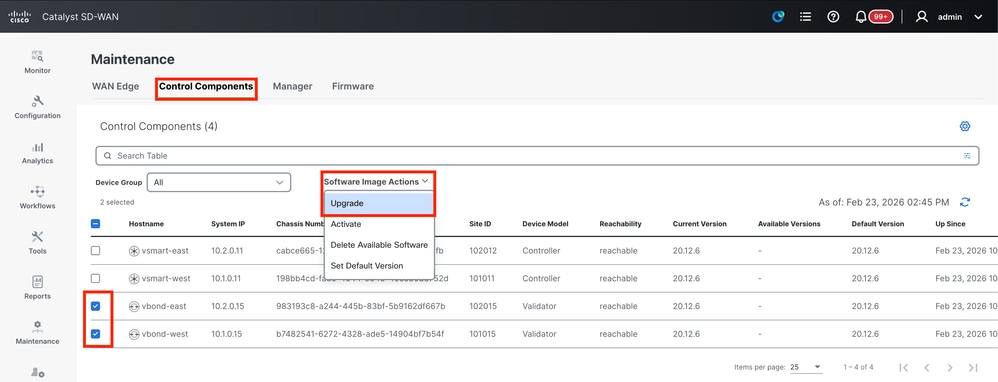
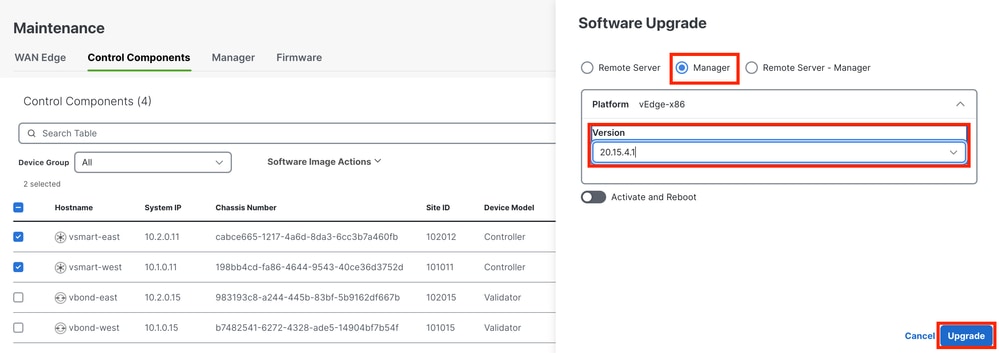
Navigate to Maintenance > Software Upgrade > Control Components and click Upgrade.
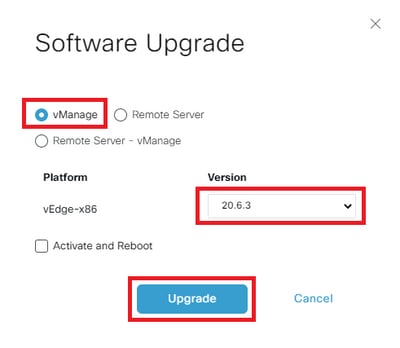
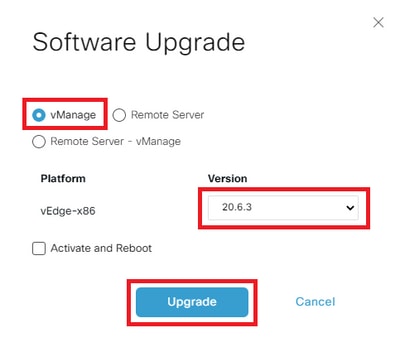
In the Software Upgrade pop-up window, do as follows:
- Choose the Manage tab.
- Select the image version to upgrade to from the version drop-down list.
- ClickUpgrade.
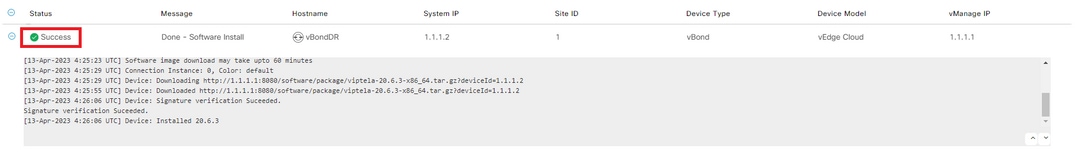
Note: This process does not execute a reboot of the vBond, only transfers, uncompresses and creates the directories needed for the upgrade.
Verify the status of the task until it shows as Success.
Step B. Activation
On this step, vBond activates the new installed software version and reboots itself to boot up with the new software.
Navigate toMaintenance>Software Upgrade>Control Components, and click Activate.
Select the new version and click Activate.
Note: This process requires a reboot of vBond. The complete activation can take up to 30 minutes.
Verify the status of the task until it shows as Success.
After the process finishes, navigate to Maintenance > Software Upgrade > Control Components to verify the new version is activated.
Optional Step. Activate and Reboot the New Software Image
Note: This step is optional. You can check the box of Activate and Reboot option during the installation process. Use this procedure to install and activate the new upgraded software version.
Step C. Set Default Software Version
You can set a software image to be the default image on a Cisco SD-WAN device. It is recommended to set the new image as default after verify that the software operate as desired on the device and in the network.
If a factory reset on the device is performed, the device boots up with the image that is set as default.
To set a software image as default image, do as follows:
- Navigate toMaintenance>Software Upgrade>Control Components > Software Image Actions.
- ClickSet Default Version, select the new version from the drop-down list and clickSet Default.
Note: This process does not perform a reboot of vBond.
Verify the status of the task until it shows as Success.
To verify the Default Version, navigate to Maintenance > Software Upgrade > Control Components.
vSmart
vSmart (Controller) Upgrade Guidelines
- Cisco recommends upgrading 50% of the vSmart controllers first. After the initial upgrade, monitor the system for stability for at least 24 hours. If no issues are observed, proceed with upgrading the remaining vSmart controllers.
- For upgrading vSmart (Controller), Cisco recommends using the vManage GUI instead of the CLI.
Note: The vManage GUI offers a more streamlined and user-friendly upgrade process.
Before upgrading vSmart controllers, please ensure the prerequisites are met to maintain seamless data plane operation after the upgrade.
Pre-Requisites
Step 1. Collect Reference Screenshots from the Dashboard
- For vSmart controllers, navigate toMonitor > Overview > Controller > System Statusto capture CPU and memory utilization.
- Collect the Real-Time command show omp summary from all the vSmarts on the vManage.
Step 2. Check for OMP Peer State Notifications
- Review the events or alarms dashboard for any notifications indicating OMP peer state down status.
- To do this, navigate toMonitor > Logs > Alarms/Eventsand look for any relevant alerts before proceeding with the upgrade.
Step 3. Back Up vSmart Configurations
- Collect the running configuration of all vSmart controllers, including the current vSmart policy.
- Save these configurations as a backup to ensure you can restore settings if needed after the upgrade.
Step 4. Check Disk Space
Review the disk usage on your vSmart to ensure there is adequate free space before starting the upgrade. Pay special attention to partitions that are at or near full capacity, such as
/var/volatile/log/tmplogin the output below, which is currently at 100%. Address any storage issues as needed to avoid upgrade failures or operational disruptions.vSmart# df -h
Filesystem Size Used Avail Use% Mounted on
none 7.6G 4.0K 7.6G 1% /dev
/dev/nvme0n1p1 7.9G 1.8G 6.0G 23% /boot
/dev/loop0 139M 139M 0 100% /rootfs.ro
/dev/nvme1n1 20G 7.6G 12G 41% /rootfs.rw
aufs 20G 7.6G 12G 41% /
tmpfs 7.6G 728K 7.6G 1% /run
shm 7.6G 16K 7.6G 1% /dev/shm
tmp 1.0G 16K 1.0G 1% /tmp
tmplog 120M 120M 0 100% /var/volatile/log/tmplog
svtmp 2.0M 1.2M 876K 58% /etc/sv
vSmart#Step 5. Monitor vSmart Resource Utilization
- Check CPU and memory usage on vSmart controllers.
- In vshell, run thetopandfree -m commands to collect current resource statistics
vSmart# vshell
vSmart~$top
vSmart~$ free -m
Step 6. Verify OMP and Control Status on All vSmarts
- Perform OMP and control verification on all vSmarts to establish a baseline before making changes.
- Runshow omp summaryand record the output as the reference of the original state for comparison after the upgrade.
- Useshow control summary andshow control connectionsto confirm that the number of control connections to edges, other vSmarts, vBonds, and vManage is correct.
- Runshow control local-propertiesfor additional control plane details.
- Executeshow system status to ensure each vSmart has “vManaged” status astrueand the “Configuration template” is not set toNone.
Step 7. Validate Sample Edge Devices
Select a sample of 10 to 15 devices from different site-lists and perform the checks:
- Runshow sdwan omp peersto ensure each device has active OMP peerings with all expected vSmarts.
- Executeshow sdwan omp summaryto review the overall OMP status.
- Useshow sdwan bfd sessionsto capture the number of active BFD sessions and their uptime.
Cisco Recommended Configuration Settings
While not mandatory for the upgrade, Cisco strongly recommends these configuration best practices to ensure optimal operation.
OMP Hold Timer
- For software versions20.12.1 and later, configure the OMP hold timer to300 seconds.
- For versionsprior to 20.12.1, set the OMP hold timer to60 seconds.
OMP Graceful Restart Timer
- The default timer of12 hours (43,200 seconds)is generally sufficient to maintain data plane tunnels during temporary vSmart outages.
IPsec Rekey Timer
- To prevent IPsec rekeying while OMP is down, configure the IPsec rekey timer totwice the value of the OMP graceful restart timer.
These settings help enhance network stability and minimize disruptions during planned or unplanned outages.
Proceed to the next step only if all the verifications are successful.
Step A. Installation
On this step, vManagesends the new software to vSmart and install the new image.
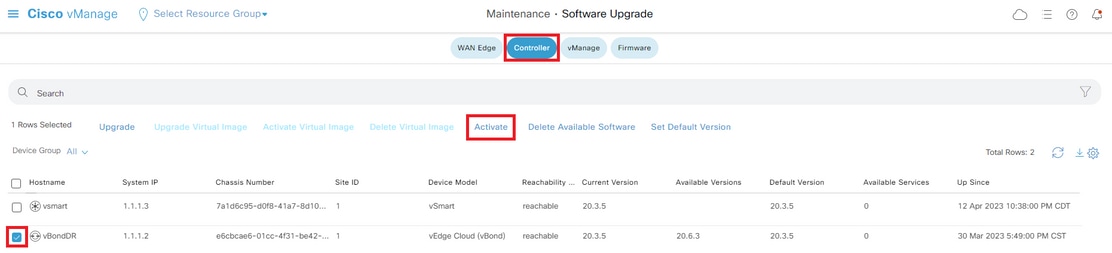
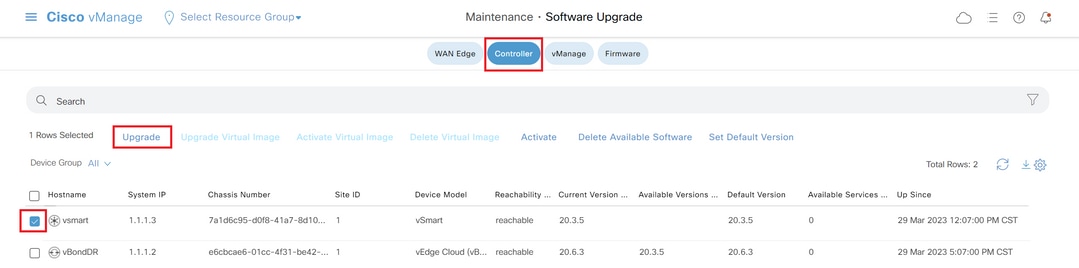
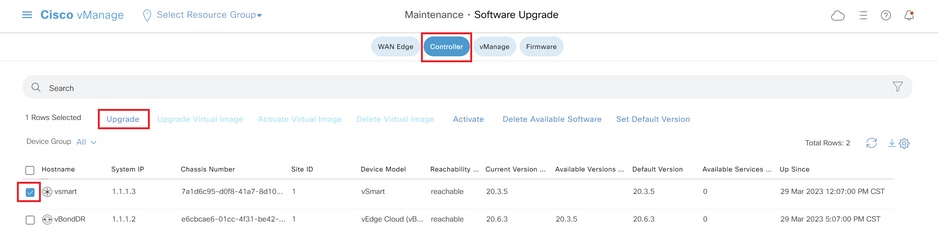
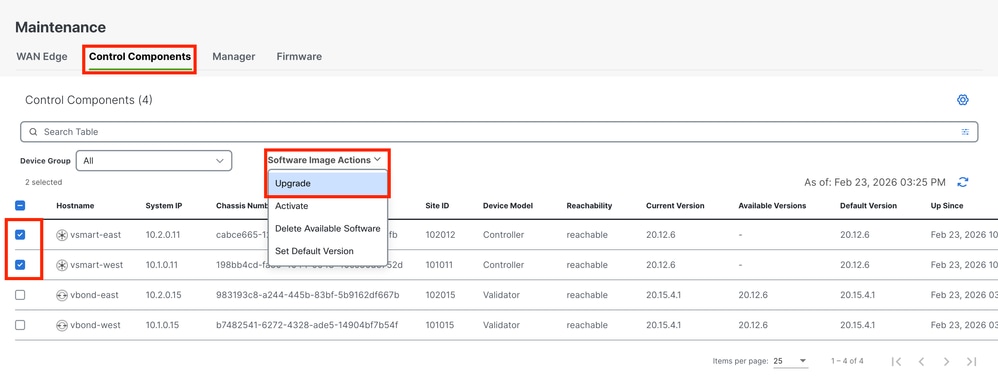
Navigate toMaintenance>Software Upgrade>Controller and click Upgrade.
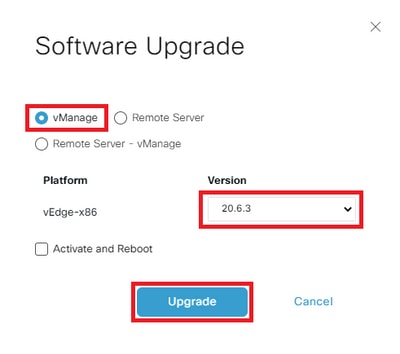
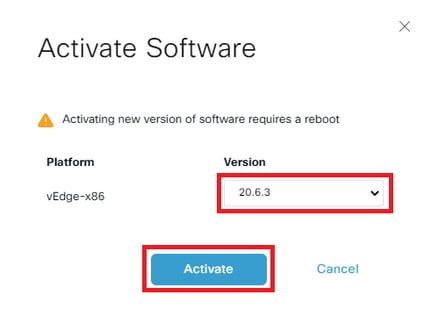
In the Software Upgrade pop-up window, do as follows:
- Choose the vManage tab.
- Select the image version to upgrade to from the version drop-down list.
- ClickUpgrade.
Note: This process does not execute a reboot of the vSmart, only transfers, uncompresses and creates the directories needed for the upgrade.
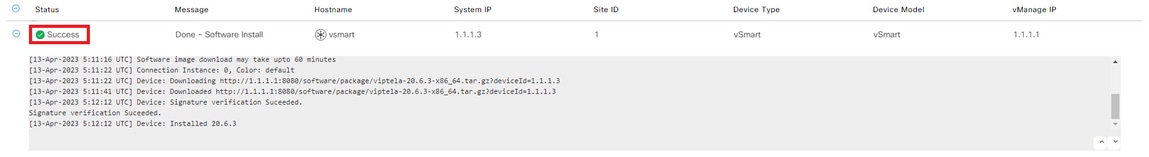
Verify the status of the task until it shows as Success.
Step B. Activation
On this step, vSmart activates the new installed software version and reboots itself to boot up with the new software.
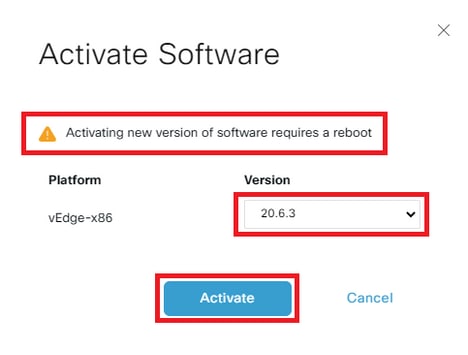
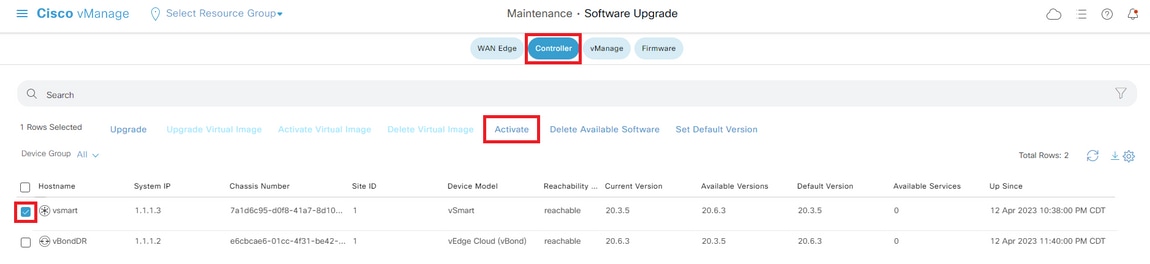
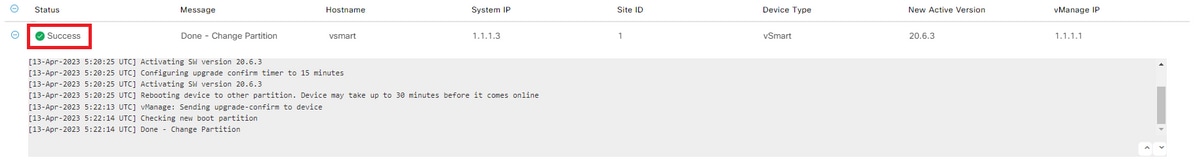
Navigate toMaintenance>Software Upgrade>Controller, and click Activate.

Select the new version and click Activate.

Note: This process requires a reboot of vSmart. The complete activation can take up to 30 minutes.
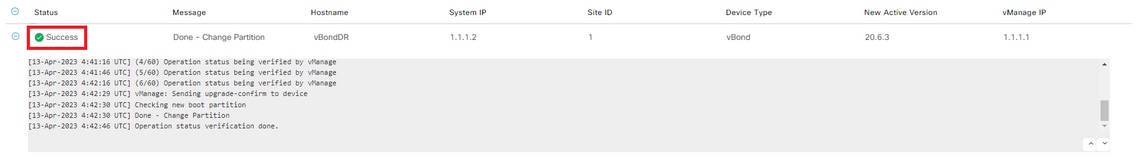
Verify the status of the task until it shows as Success.

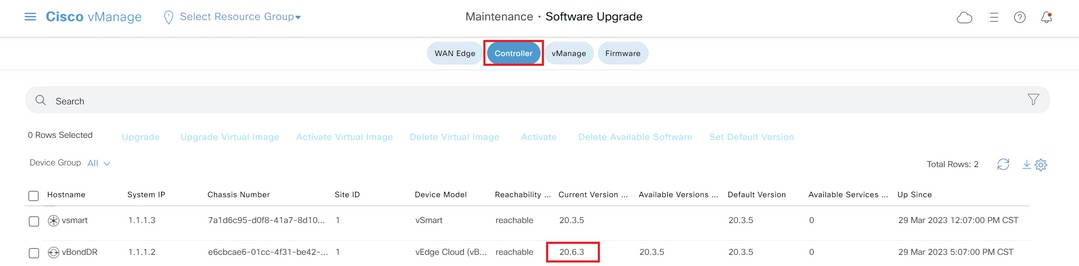
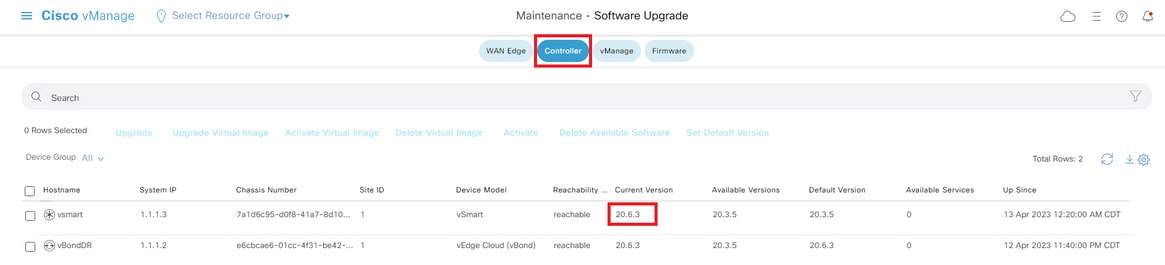
After the process finishes, navigate to Maintenance > Software Upgrade > Controller to verify the new version is activated.
Optional Step. Activate and Reboot the New Software Image
Note: This step is optional. You can check the box of Activate and Reboot option during the installation process. Use this procedure to install and activate the new upgraded software version.
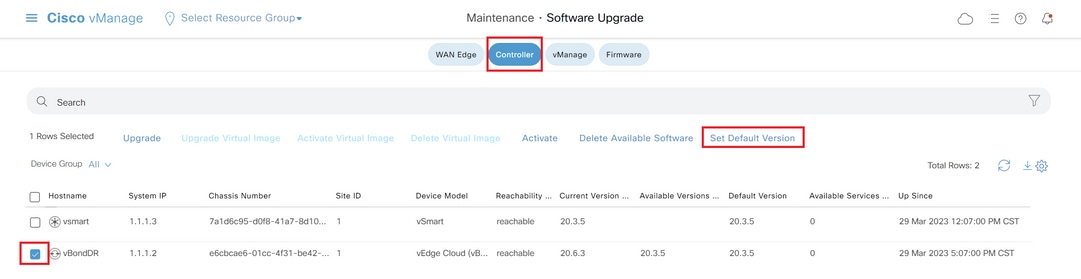
Step C. Set Default Software Version
You can set a software image to be the default image on a Cisco SD-WAN device. It is recommended to set the new image as default after verify that the software operate as desired on the device and in the network.
If a factory reset on the device is performed, the device boots up with the image that is set as default.
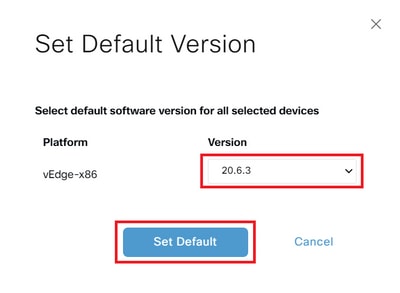
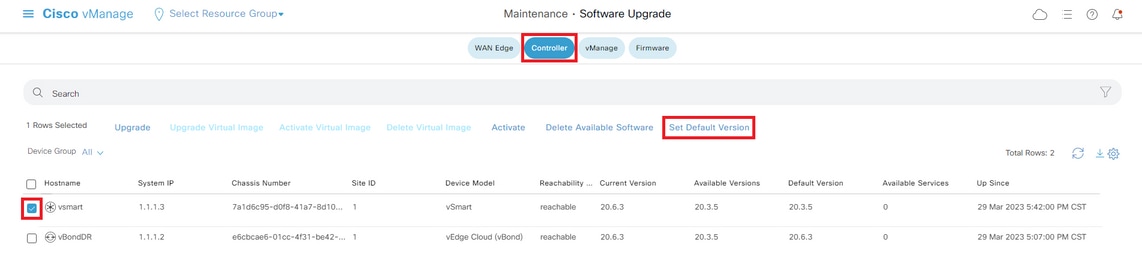
To set a software image as default image, do as follows:
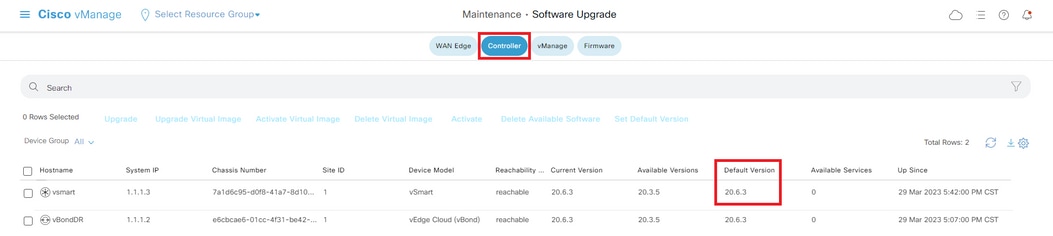
- Navigate toMaintenance>Software Upgrade>Controller.
- ClickSet Default Version, select the new version from the drop-down list and clickSet Default.
Note: This process does not perform a reboot of vSmart.

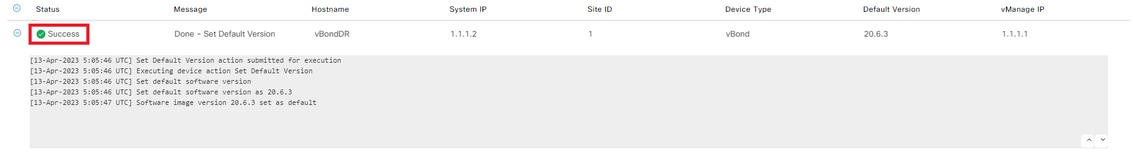
Verify the status of the task until it shows as Success.

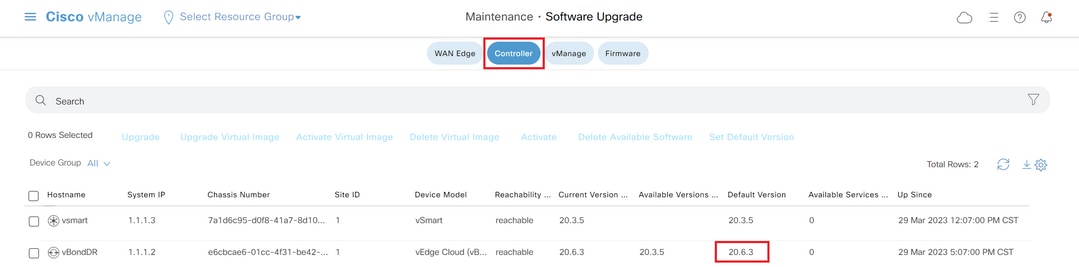
To verify the Default Version, navigate to Maintenance > Software Upgrade > Controller.
Upgrade SD-WAN Controllers via CLI
Step 1. Installation
There are two options to install the image:
Option 1: From CLI with the Use of HTTP, FTP or TFTP.
To install the software image from within the CLI:
-
Configure the time limit to confirm that a software upgrade is successful. The time can be from 1 through 60 minutes.
Viptela# system upgrade-confirm minutes - Install the software:
Viptela#request software install url/vmanage-20.15.4.1-x86_64.tar.gz [reboot]Specify the image location in one of the next ways:
- The image file is on the local server:
/directory-path/
You can use the autocompletion feature on CLI to complete the path and filename.
- The image file is on an FTP server.
ftp://hostname/
- The image file is on an HTTP server.
http://hostname/
- The image file is on a TFTP server.
tftp://hostname/
Optionally, specify the VPN identifier in which the server is located.
Therebootoption activates the new software image and reboots the device after the installation completes.
3. If you did not include the reboot option in Step 2, activate the new software image and this automatically performs a reboot of the instance to boot the new version up.
Viptela#request software activate4. Confirm, within the configured upgrade confirmation time limit (12 minutes by default), that the software installation was successful:
Viptela#request software upgrade-confirmIf you do not issue this command within this time limit, the device automatically reverts to the previous software image.
Option 2: From vManage GUI
This step helps you to upload the images into vManage repository.
Navigate to Software Download and download the software version image for vManage.
Navigate to Software Download and download the software version image for vBond and vSmart.
To upload the new images, on the main menu, navigate to Maintenance > Software Repository > Software Images, click Add New Software and on the drag-and-drop option select vManage.
Select the images and click Upload.
To verify if the images are available, navigate toSoftware Repository > Software Images.
Note: This procees needs to be done for all controllers.
vManage:
ClickUpgrade.
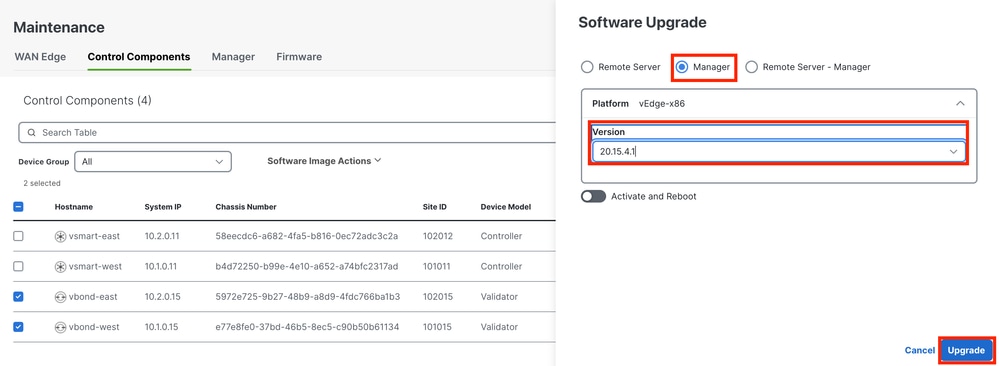
vBond:
Click Upgrade.
vSmart:
Click Upgrade.
In the Software Upgrade pop-up window, do as follows:
- Choose the vManage tab.
- Select the image version to upgrade to from the version drop-down list.
- ClickUpgrade.
For vManage:

For vBond and vSmart:
Step 2. Activation
Once the installation is done, verify the software images that are installed in the controllers.
vmanage# show software

VERSION ACTIVE DEFAULT PREVIOUS CONFIRMED TIMESTAMP
---------------------------------------------------------------------------
20.12.6 true true - - 2023-02-01T22:25:24-00:00
20.15.4.1 false false false - -
vbond# show software
VERSION ACTIVE DEFAULT PREVIOUS CONFIRMED TIMESTAMP
--------------------------------------------------------------------------
20.12.6 true true - - 2022-10-01T00:30:40-00:00
20.15.4.1 false false false - -vsmart# show software
VERSION ACTIVE DEFAULT PREVIOUS CONFIRMED TIMESTAMP
--------------------------------------------------------------------------
20.12.6 true true - - 2022-10-01T00:31:34-00:00
20.15.4.1 false false false - -Note: To activate the image, issue the next command in the controllers (Controller by Controller, 1st vManage, 2nd vBond, 3rd vSmart). Incase of vManage cluster, it is important to activate the software on all the vManage nodes in the cluster together.
vmanage# request software activate ?
Description: Display software versions
Possible completions:
20.12.6
20.15.4.1
clean Clean activation
now Activate software version
vmanage# request software activate 20.15.4.1
This will reboot the node with the activated version.
Are you sure you want to proceed? [yes,NO] yes

Broadcast message from root@vmanage (console) (Tue Feb 28 01:01:04 2023):

Tue Feb 28 01:01:04 UTC 2023: The system is going down for reboot NOW!
vbond# request software activate ?
Description: Display software versions
Possible completions:
20.12.6
20.15.4.1
clean Clean activation
now Activate software version
vbond# request software activate 20.15.4.1
This will reboot the node with the activated version.
Are you sure you want to proceed? [yes,NO] yes
Broadcast message from root@vbond (console) (Tue Feb 28 01:05:59 2023):
Tue Feb 28 01:05:59 UTC 2023: The system is going down for reboot NOWvsmart# request software activate ?
Description: Display software versions
Possible completions:
20.12.6
20.15.4.1
clean Clean activation
now Activate software version
vsmart# request software activate 20.15.4.1
This will reboot the node with the activated version.
Are you sure you want to proceed? [yes,NO] yes
Broadcast message from root@vsmart (console) (Tue Feb 28 01:13:44 2023):
Tue Feb 28 01:13:44 UTC 2023: The system is going down for reboot NOW!Note: The controllers activate the new image and reboot themselves.
To verify that new software version is activated, issue the next command:
vmanage# show version
20.15.4.1
vmanage# show software

VERSION ACTIVE DEFAULT PREVIOUS CONFIRMED TIMESTAMP
---------------------------------------------------------------------------
20.12.6 false true true - 2023-02-01T22:25:24-00:00
20.15.4.1 true false false auto 2023-02-28T01:05:14-00:00
vbond# show version
20.15.4.1
vbond# show software
VERSION ACTIVE DEFAULT PREVIOUS CONFIRMED TIMESTAMP
--------------------------------------------------------------------------
20.12.6 false true true - 2022-10-01T00:30:40-00:00
20.15.4.1 true false false - 2023-02-28T01:09:05-00:00vsmart# show version
20.15.4.1
vsmart# show software
VERSION ACTIVE DEFAULT PREVIOUS CONFIRMED TIMESTAMP
--------------------------------------------------------------------------
20.12.6 false true true - 2022-10-01T00:31:34-00:00
20.15.4.1 true false false - 2023-02-28T01:16:36-00:00Step 3. Set Default Software Version
You can set a software image to be the default image on a Cisco SD-WAN device. It is recommended to set the new image as default after verify that the software operate as desired on the device and in the network.
If a factory reset on the device is performed, the device boots up with the image that is set as default.
Note: It is recommended to set the new version as default because if the vManage reboots, the old version is booted up. This can cause a corruption in the database. A version downgrade from a major release to an older one, it is not supported in vManage.
Note: This process does not perform a reboot of Controllers.
To set a software version as default, issue the next command in the controllers:
vmanage# request software set-default ?
Possible completions:
20.12.6
20.15.4.1
cancel Cancel this operation
start-at Schedule start.
| Output modifiers
<cr>
vmanage# request software set-default 20.15.4.1
status mkdefault 20.15.4.1: successful
vbond# request software set-default ?
Possible completions:
20.12.6
20.15.4.1
cancel Cancel this operation
start-at Schedule start.
| Output modifiers
<cr>
vbond# request software set-default 20.15.4.1
status mkdefault 20.15.4.1: successfulvsmart# request software set-default ?
Possible completions:
20.12.6
20.15.4.1
cancel Cancel this operation
start-at Schedule start.
| Output modifiers
<cr>
vsmart# request software set-default 20.15.4.1
status mkdefault 20.15.4.1: successfulTo verify that new default version is set on controllers, issue the next command:
vmanage# show software

VERSION ACTIVE DEFAULT PREVIOUS CONFIRMED TIMESTAMP
---------------------------------------------------------------------------
20.12.6 false false true - 2023-02-01T22:25:24-00:00
20.15.4.1 true true false auto 2023-02-28T01:05:14-00:00
vbond# show software
VERSION ACTIVE DEFAULT PREVIOUS CONFIRMED TIMESTAMP
--------------------------------------------------------------------------
20.12.6 false false true - 2022-10-01T00:30:40-00:00
20.15.4.1 true true false - 2023-02-28T01:09:05-00:00vsmart# show software
VERSION ACTIVE DEFAULT PREVIOUS CONFIRMED TIMESTAMP
--------------------------------------------------------------------------
20.12.6 false false true - 2022-10-01T00:31:34-00:00
20.15.4.1 true true false - 2023-02-28T01:16:36-00:00Upgrade vManage/vManage cluster with Disaster Recovery Enabled
For the vManage or vManage Cluster where Disaster recovery is enabled,
Confirm there is no ongoing Disaster recovery replication. Navigate to Administration --> Disaster Recovery and make sure the status Success and not in a transient state such as Import Pending, Export Pending, or Download Pending. It is important to Pause the Disaster Recovery on the current active vManage.
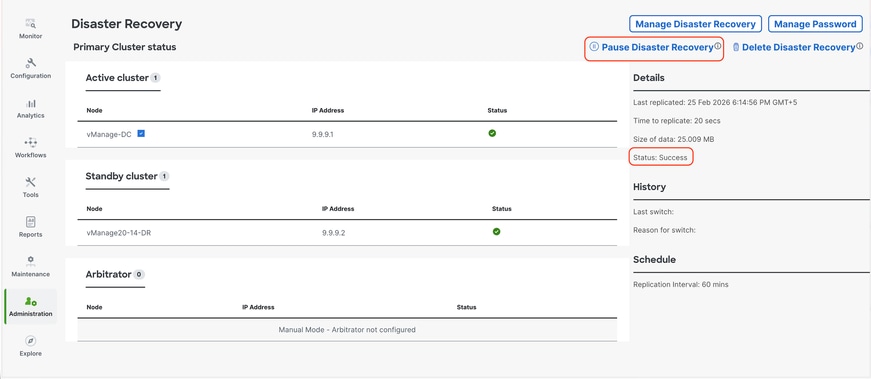
If the status is not success, wait for the status to show as "success". If it is stuck on some other status for a longer time(more than 1 hour depending on the replication interval set), reach out to Cisco TAC and make sure replication is successful before you proceed to pause the disaster recovery.
First Pause the disaster recovery and make sure the task is successful. Then proceed to upgrade the Active vManage as per the steps described above.
Note: For standalone Active vManage we can install and activate the new software using vManage UI. For Active vManage cluster, it is recommended to install the software using vManage UI and activate the software using vManage CLI using the request software activate < > as described in the section Upgrade SD-WAN Controllers via CLI below.
For standby vManage/vManage cluster we need to install and activate the software using CLI of vManage nodes.
-
Post-Upgrade Validation Checks
-
Verify Software Versions: Confirm that all controllers are running the intended software version.
-
Check SD-WAN Manager Services: Ensure all services on the SD-WAN Manager instances are operational.
-
Validate Control Connections Between Controllers: Verify that control connections are established and stable among all controllers.
-
Confirm Policy Activation:Verify that the policy is activated on the SD-WAN Manager.
-
Check Control Connection Distribution: Ensure control connections are properly distributed across all SD-WAN Manager nodes. Navigate toMonitor > Networkand review theControlcolumn.
-
Site-Level Post-Upgrade Tests: Perform the these checks on all sites where pre-upgrade checks were conducted:
-
Control Connections and BFD Sessions:
show sd-wan control connections
show sd-wan bfd sessions -
Routing Verification:
show ip route
show ip route vrf <vrf_id>
show sd-wan omp routes vpn <vpn_id> -
Data Center Reachability: Verify connectivity to data center services.
-
Template Synchronization: Confirm that device templates are attached and synchronized on devices after the upgrade.
-
Policy Verification from Controllers:
-
show sd-wan policy from-controller
-
User Acceptance Testing: Conduct user testing on the migrated sites to validate application functionality
-
Rollback Plan
vBond and vSmart Rollback Plan
If any unexpected issues are observed with the Validator (vBond) or Controller (vSmart) after the upgrade, revert to the previous software version by activating the older image on the affected devices.
vSmart# request software activate <older image version>
vBond# request software activate <older image version>
vManage Rollback Plan
If unexpected issues occur with the SD-WAN Manager (vManage) after the upgrade, restore the system using the snapshot taken prior to the upgrade.
Note:vManage does not support downgrading to previous versions via the CLI.
Troubleshoot
1. If GUI goes down for a long time after activation, and never become reachable again, these outputs can be helpful to find the root cause out:
vmanage# request nms application-server status
NMS application server
Enabled: true   <<<<<<<<<<<   "false"
Status: running PID:26470 for 22279s   <<<<<<<<<<  "not running"
If the app-server status shows Enabled as false and the Status is not running, you can issue the next command to restore the GUI:
vmanage# request nms application-server restart
2. To verify the status of all the nms services, you can issue the next command:
vmanage# request nms all status
NMS service proxy
Enabled: true
Status: running PID:30888 for 819s
NMS service proxy rate limit
Enabled: true
Status: running PID:32029 for 812s
NMS application server
Enabled: true
Status: running PID:30834 for 819s
NMS configuration database
Enabled: true
Status: running PID:28321 for 825s
Native metrics status: ENABLED
Server-load metrics status: ENABLED
NMS coordination server
Enabled: true
Status: running PID:16814 for 535s
NMS messaging server
Enabled: true
Status: running PID:32561 for 799s
NMS statistics database
Enabled: false
Status: not running
NMS data collection agent
Enabled: true
Status: running PID:31051 for 824s
NMS CloudAgent v2
Enabled: true
Status: running PID:31902 for 817s
NMS cloud agent
Enabled: true
Status: running PID:18517 for 1183s
NMS SDAVC server
Enabled: false
Status: not running
NMS SDAVC gateway
Enabled: false
Status: not running
vManage Device Data Collector
Enabled: true
Status: running PID:3709 for 767s
NMS OLAP database
Enabled: true
Status: running PID:18167 for 521s
vManage Reporting
Enabled: true
Status: running PID:30015 for 827s
3. To verify the TCP handshake is completed, issue the next command:
vmanage# request nms all diagnostics NMS service server Pinging vManage node on localhost ... Starting Nping 0.7.80 ( https://nmap.org/nping ) at 2026-02-24 06:17 UTC SENT (0.0014s) Starting TCP Handshake > localhost:8443 (127.0.0.1:8443) RCVD (0.0014s) Handshake with localhost:8443 (127.0.0.1:8443) completed SENT (1.0025s) Starting TCP Handshake > localhost:8443 (127.0.0.1:8443) RCVD (1.0025s) Handshake with localhost:8443 (127.0.0.1:8443) completed SENT (2.0036s) Starting TCP Handshake > localhost:8443 (127.0.0.1:8443) RCVD (2.0036s) Handshake with localhost:8443 (127.0.0.1:8443) completed Max rtt: 0.012ms | Min rtt: 0.010ms | Avg rtt: 0.010ms TCP connection attempts: 3 | Successful connections: 3 | Failed: 0 (0.00%) Nping done: 1 IP address pinged in 2.00 seconds Server network connections -------------------------- tcp6 0 0 127.0.0.1:8443 127.0.0.1:43682 ESTABLISHED 31081/envoy tcp6 0 0 127.0.0.1:43892 127.0.0.1:8443 ESTABLISHED 30944/java tcp6 0 0 169.254.1.1:8443 169.254.1.8:52962 ESTABLISHED 31081/envoy tcp6 0 0 127.0.0.1:43738 127.0.0.1:8443 ESTABLISHED 30944/java tcp6 0 0 127.0.0.1:8443 127.0.0.1:43738 ESTABLISHED 31081/envoy tcp6 0 0 127.0.0.1:8443 127.0.0.1:43828 ESTABLISHED 31081/envoy tcp6 0 0 127.0.0.1:8443 127.0.0.1:43836 ESTABLISHED 31081/envoy tcp6 0 0 127.0.0.1:8443 127.0.0.1:43866 ESTABLISHED 31081/envoy tcp6 0 0 127.0.0.1:52020 127.0.0.1:8443 ESTABLISHED 30944/java tcp6 0 0 127.0.0.1:43828 127.0.0.1:8443 ESTABLISHED 30944/java tcp6 0 0 127.0.0.1:8443 127.0.0.1:43896 ESTABLISHED 31081/envoy tcp6 0 0 169.254.1.1:8443 169.254.1.8:51382 ESTABLISHED 31081/envoy tcp6 0 0 127.0.0.1:43726 127.0.0.1:8443 ESTABLISHED 30944/java tcp6 0 0 127.0.0.1:8443 127.0.0.1:43810 ESTABLISHED 31081/envoy tcp6 0 0 127.0.0.1:8443 127.0.0.1:43756 ESTABLISHED 31081/envoy tcp6 0 0 127.0.0.1:43748 127.0.0.1:8443 ESTABLISHED 30944/java tcp6 0 0 169.254.0.254:8443 151.186.182.23:35154 ESTABLISHED 31081/envoy tcp6 0 0 127.0.0.1:8443 127.0.0.1:43898 ESTABLISHED 31081/envoy tcp6 0 0 127.0.0.1:8443 127.0.0.1:43860 ESTABLISHED 31081/envoy tcp6 0 0 127.0.0.1:56308 127.0.0.1:8443 ESTABLISHED 30944/java tcp6 0 0 127.0.0.1:8443 127.0.0.1:52028 ESTABLISHED 31081/envoy tcp6 0 0 127.0.0.1:43756 127.0.0.1:8443 ESTABLISHED 30944/java tcp6 0 0 127.0.0.1:43712 127.0.0.1:8443 ESTABLISHED 30944/java tcp6 0 0 127.0.0.1:8443 127.0.0.1:43834 ESTABLISHED 31081/envoy tcp6 0 0 169.254.0.254:8443 151.186.182.23:52168 ESTABLISHED 31081/envoy tcp6 0 0 127.0.0.1:43810 127.0.0.1:8443 ESTABLISHED 30944/java tcp6 0 0 127.0.0.1:43836 127.0.0.1:8443 ESTABLISHED 30944/java tcp6 0 0 127.0.0.1:43852 127.0.0.1:8443 ESTABLISHED 30944/java tcp6 0 0 169.254.0.254:8443 151.186.182.23:53030 ESTABLISHED 31081/envoy tcp6 0 0 127.0.0.1:43898 127.0.0.1:8443 ESTABLISHED 30944/java tcp6 0 0 127.0.0.1:8443 127.0.0.1:43892 ESTABLISHED 31081/envoy tcp6 0 0 127.0.0.1:52028 127.0.0.1:8443 ESTABLISHED 30944/java tcp6 0 0 127.0.0.1:44096 127.0.0.1:8443 ESTABLISHED 30944/java tcp6 0 0 127.0.0.1:43896 127.0.0.1:8443 ESTABLISHED 30944/java tcp6 0 0 127.0.0.1:43866 127.0.0.1:8443 ESTABLISHED 30944/java tcp6 0 0 127.0.0.1:43730 127.0.0.1:8443 ESTABLISHED 30944/java tcp6 0 0 127.0.0.1:43860 127.0.0.1:8443 ESTABLISHED 30944/java tcp6 0 0 127.0.0.1:43878 127.0.0.1:8443 ESTABLISHED 30944/java tcp6 0 0 127.0.0.1:43772 127.0.0.1:8443 ESTABLISHED 30944/java tcp6 0 0 127.0.0.1:8443 127.0.0.1:52020 ESTABLISHED 31081/envoy tcp6 0 0 127.0.0.1:8443 127.0.0.1:56308 ESTABLISHED 31081/envoy tcp6 0 0 127.0.0.1:43874 127.0.0.1:8443 ESTABLISHED 30944/java tcp6 0 0 127.0.0.1:8443 127.0.0.1:43772 ESTABLISHED 31081/envoy tcp6 0 0 127.0.0.1:43826 127.0.0.1:8443 ESTABLISHED 30944/java tcp6 0 0 127.0.0.1:52038 127.0.0.1:8443 ESTABLISHED 30944/java tcp6 0 0 127.0.0.1:8443 127.0.0.1:43754 ESTABLISHED 31081/envoy tcp6 0 0 127.0.0.1:8443 127.0.0.1:43726 ESTABLISHED 31081/envoy tcp6 0 0 127.0.0.1:43782 127.0.0.1:8443 ESTABLISHED 30944/java tcp6 0 0 127.0.0.1:43862 127.0.0.1:8443 ESTABLISHED 30944/java tcp6 0 0 127.0.0.1:43834 127.0.0.1:8443 ESTABLISHED 30944/java tcp6 0 0 169.254.1.1:8443 169.254.1.8:52964 ESTABLISHED 31081/envoy tcp6 0 0 127.0.0.1:8443 127.0.0.1:44096 ESTABLISHED 31081/envoy tcp6 0 0 127.0.0.1:43754 127.0.0.1:8443 ESTABLISHED 30944/java tcp6 0 0 127.0.0.1:8443 127.0.0.1:43874 ESTABLISHED 31081/envoy tcp6 0 0 127.0.0.1:8443 127.0.0.1:43712 ESTABLISHED 31081/envoy tcp6 0 0 127.0.0.1:43794 127.0.0.1:8443 ESTABLISHED 30944/java tcp6 0 0 127.0.0.1:8443 127.0.0.1:43696 ESTABLISHED 31081/envoy tcp6 0 0 127.0.0.1:43696 127.0.0.1:8443 ESTABLISHED 30944/java tcp6 0 0 169.254.1.1:8443 169.254.1.8:52978 ESTABLISHED 31081/envoy tcp6 0 0 127.0.0.1:8443 127.0.0.1:43748 ESTABLISHED 31081/envoy tcp6 0 0 127.0.0.1:8443 127.0.0.1:43730 ESTABLISHED 31081/envoy tcp6 0 0 127.0.0.1:8443 127.0.0.1:43852 ESTABLISHED 31081/envoy tcp6 0 0 127.0.0.1:8443 127.0.0.1:43878 ESTABLISHED 31081/envoy tcp6 0 0 127.0.0.1:8443 127.0.0.1:43826 ESTABLISHED 31081/envoy tcp6 0 0 127.0.0.1:43682 127.0.0.1:8443 ESTABLISHED 30944/java tcp6 0 0 127.0.0.1:8443 127.0.0.1:43794 ESTABLISHED 31081/envoy tcp6 0 0 127.0.0.1:8443 127.0.0.1:43862 ESTABLISHED 31081/envoy tcp6 0 0 127.0.0.1:8443 127.0.0.1:52038 ESTABLISHED 31081/envoy tcp6 0 0 127.0.0.1:8443 127.0.0.1:43782 ESTABLISHED 31081/envoy NMS application server Sending ICMP Echo to vManage on localhost ... PING localhost.localdomain (127.0.0.1) 56(84) bytes of data. 64 bytes from localhost.localdomain (127.0.0.1): icmp_seq=1 ttl=64 time=0.022 ms 64 bytes from localhost.localdomain (127.0.0.1): icmp_seq=2 ttl=64 time=0.030 ms 64 bytes from localhost.localdomain (127.0.0.1): icmp_seq=3 ttl=64 time=0.027 ms --- localhost.localdomain ping statistics --- 3 packets transmitted, 3 received, 0% packet loss, time 2034ms rtt min/avg/max/mdev = 0.022/0.026/0.030/0.003 ms Pinging vManage node on localhost ... Starting Nping 0.7.80 ( https://nmap.org/nping ) at 2026-02-24 06:17 UTC SENT (0.0015s) Starting TCP Handshake > localhost:8443 (127.0.0.1:8443) RCVD (0.0015s) Handshake with localhost:8443 (127.0.0.1:8443) completed SENT (1.0026s) Starting TCP Handshake > localhost:8443 (127.0.0.1:8443) RCVD (1.0026s) Handshake with localhost:8443 (127.0.0.1:8443) completed SENT (2.0037s) Starting TCP Handshake > localhost:8443 (127.0.0.1:8443) RCVD (2.0037s) Handshake with localhost:8443 (127.0.0.1:8443) completed Max rtt: 0.012ms | Min rtt: 0.009ms | Avg rtt: 0.010ms TCP connection attempts: 3 | Successful connections: 3 | Failed: 0 (0.00%) Nping done: 1 IP address pinged in 2.00 seconds Disk I/O statistics for vManage storage --------------------------------------- avg-cpu: %user %nice %system %iowait %steal %idle 1.63 0.00 0.37 0.06 0.00 97.93 Device tps kB_read/s kB_wrtn/s kB_dscd/s kB_read kB_wrtn kB_dscd nvme1n1 24.49 74.59 913.44 0.00 2717198 33273456 0 NMS configuration database Checking cluster connectivity for ports 7687,7474 ... Pinging vManage node 0 on 169.254.1.5:7687,7474... Starting Nping 0.7.80 ( https://nmap.org/nping ) at 2026-02-24 06:17 UTC SENT (0.0013s) Starting TCP Handshake > 169.254.1.5:7474 RCVD (0.0013s) Handshake with 169.254.1.5:7474 completed SENT (1.0024s) Starting TCP Handshake > 169.254.1.5:7687 RCVD (1.0024s) Handshake with 169.254.1.5:7687 completed SENT (2.0035s) Starting TCP Handshake > 169.254.1.5:7474 RCVD (2.0035s) Handshake with 169.254.1.5:7474 completed SENT (3.0046s) Starting TCP Handshake > 169.254.1.5:7687 RCVD (3.0046s) Handshake with 169.254.1.5:7687 completed SENT (4.0057s) Starting TCP Handshake > 169.254.1.5:7474 RCVD (4.0058s) Handshake with 169.254.1.5:7474 completed SENT (5.0069s) Starting TCP Handshake > 169.254.1.5:7687 RCVD (5.0069s) Handshake with 169.254.1.5:7687 completed Max rtt: 0.021ms | Min rtt: 0.010ms | Avg rtt: 0.013ms TCP connection attempts: 6 | Successful connections: 6 | Failed: 0 (0.00%) Nping done: 1 IP address pinged in 5.01 seconds Server network connections -------------------------- tcp 0 0 169.254.1.5:7687 169.254.1.1:59650 ESTABLISHED 30148/java tcp 0 0 169.254.1.5:7687 169.254.1.1:49998 ESTABLISHED 30148/java tcp 0 0 169.254.1.5:7687 169.254.1.13:55794 ESTABLISHED 30148/java tcp 0 0 169.254.1.5:7687 169.254.1.1:35374 ESTABLISHED 30148/java tcp 0 0 169.254.1.5:7687 169.254.1.1:40100 ESTABLISHED 30148/java tcp 0 0 169.254.1.5:7687 169.254.1.1:52748 ESTABLISHED 30148/java tcp 0 0 169.254.1.5:7687 169.254.1.1:35380 ESTABLISHED 30148/java tcp 0 0 169.254.1.5:7687 169.254.1.1:40618 ESTABLISHED 30148/java tcp 0 0 169.254.1.5:7687 169.254.1.1:59658 ESTABLISHED 30148/java tcp 0 0 169.254.1.5:7687 169.254.1.13:55782 ESTABLISHED 30148/java Connecting to localhost... +------------------------------------------------------------------------------------+ | type | row | attributes[row]["value"] | +------------------------------------------------------------------------------------+ | "StoreSizes" | "TotalStoreSize" | 156365978 | | "PageCache" | "Flush" | 68694 | | "PageCache" | "EvictionExceptions" | 0 | | "PageCache" | "UsageRatio" | 0.1795189950980392 | | "PageCache" | "Eviction" | 3186 | | "PageCache" | "HitRatio" | 1.0 | | "ID Allocations" | "NumberOfRelationshipIdsInUse" | 8791 | | "ID Allocations" | "NumberOfPropertyIdsInUse" | 47067 | | "ID Allocations" | "NumberOfNodeIdsInUse" | 4450 | | "ID Allocations" | "NumberOfRelationshipTypeIdsInUse" | 77 | | "Transactions" | "LastCommittedTxId" | 26470 | | "Transactions" | "NumberOfOpenTransactions" | 1 | | "Transactions" | "NumberOfOpenedTransactions" | 109412 | | "Transactions" | "PeakNumberOfConcurrentTransactions" | 10 | | "Transactions" | "NumberOfCommittedTransactions" | 106913 | +------------------------------------------------------------------------------------+ 15 rows ready to start consuming query after 126 ms, results consumed after another 2 ms Completed Connecting to localhost... Displaying the Neo4j Cluster Status +---------------------------------------------------------------------------------------------------------------------------------+ | name | aliases | access | address | role | requestedStatus | currentStatus | error | default | home | +---------------------------------------------------------------------------------------------------------------------------------+ | "neo4j" | [] | "read-write" | "localhost:7687" | "standalone" | "online" | "online" | "" | TRUE | TRUE | | "system" | [] | "read-write" | "localhost:7687" | "standalone" | "online" | "online" | "" | FALSE | FALSE | +---------------------------------------------------------------------------------------------------------------------------------+ 2 rows ready to start consuming query after 3 ms, results consumed after another 1 ms Completed Total disk space used by configuration-db: 63M . Detailed disk space usage of configuration-db: 0 database_lock 8.0K neostore 48K neostore.counts.db 1.8M neostore.indexstats.db 48K neostore.labelscanstore.db 8.0K neostore.labeltokenstore.db 40K neostore.labeltokenstore.db.id 32K neostore.labeltokenstore.db.names 40K neostore.labeltokenstore.db.names.id 72K neostore.nodestore.db 48K neostore.nodestore.db.id 8.0K neostore.nodestore.db.labels 40K neostore.nodestore.db.labels.id 1.9M neostore.propertystore.db 312K neostore.propertystore.db.arrays 48K neostore.propertystore.db.arrays.id 72K neostore.propertystore.db.id 8.0K neostore.propertystore.db.index 48K neostore.propertystore.db.index.id 32K neostore.propertystore.db.index.keys 40K neostore.propertystore.db.index.keys.id 4.2M neostore.propertystore.db.strings 104K neostore.propertystore.db.strings.id 16K neostore.relationshipgroupstore.db 48K neostore.relationshipgroupstore.db.id 48K neostore.relationshipgroupstore.degrees.db 296K neostore.relationshipstore.db 48K neostore.relationshipstore.db.id 48K neostore.relationshiptypescanstore.db 8.0K neostore.relationshiptypestore.db 40K neostore.relationshiptypestore.db.id 8.0K neostore.relationshiptypestore.db.names 40K neostore.relationshiptypestore.db.names.id 16K neostore.schemastore.db 48K neostore.schemastore.db.id 11M profiles 44M schema ############################################## Running schema violation pre-check script WARNING: sun.reflect.Reflection.getCallerClass is not supported. This will impact performance. Validating Schema from the configuration-db Successfully validated configuration-db schema written to file /opt/data/containers/mounts/upgrade-coordinator/schema.json Contents of /opt/data/containers/mounts/upgrade-coordinator/schema.json: { "check_name": "Validating configuration-db admin names", "check_result": "SUCCESSFUL", "check_analysis": "Successfully validated configuration-db schema", "check_action": "" } ############################################## ############################################## Running quarantine check WARNING: sun.reflect.Reflection.getCallerClass is not supported. This will impact performance. Check if Neo4j Nodes are Quarantined None of the neo4j nodes is quarantined ############################################## ############################################## Checking High Direct Memory Usage in Neo4j High Direct Memory Usage in Neo4j not found NMS data collection agent Checking data-collection-agent status ------------------------ data-collection-agent container exists Checking Data collection agent processes status ------------------------ Data collection agent parent processs ID 12 Data collection agent process ID 104 Data collection bulk process ID 97 Data collection rest process ID 98 Data collection monitor process ID 99 Checking vmanage access ------------------------ Successfully logged into vmanage. Checking DCS Push Status ------------------------ vAnalytics not enabled. NMS coordination server Checking cluster connectivity for ports 2181 ... Pinging vManage node 0 on 169.254.1.4:2181... Starting Nping 0.7.80 ( https://nmap.org/nping ) at 2026-02-24 06:18 UTC SENT (0.0014s) Starting TCP Handshake > 169.254.1.4:2181 RCVD (0.0014s) Handshake with 169.254.1.4:2181 completed SENT (1.0025s) Starting TCP Handshake > 169.254.1.4:2181 RCVD (1.0025s) Handshake with 169.254.1.4:2181 completed SENT (2.0036s) Starting TCP Handshake > 169.254.1.4:2181 RCVD (2.0036s) Handshake with 169.254.1.4:2181 completed Max rtt: 0.012ms | Min rtt: 0.010ms | Avg rtt: 0.010ms TCP connection attempts: 3 | Successful connections: 3 | Failed: 0 (0.00%) Nping done: 1 IP address pinged in 2.00 seconds Server network connections -------------------------- tcp 0 0 169.254.1.4:2181 169.254.1.1:56716 ESTABLISHED 16814/java NMS container manager Checking container-manager status Listing all images ------------------------ REPOSITORY TAG IMAGE ID CREATED SIZE sdwan/host-agent 1.0.1 ca71fd3fe4a2 5 months ago 131MB sdwan/cluster-oracle 1.0.1 8ef918482315 5 months ago 294MB sdwan/data-collection-agent 1.0.1 4bf055257027 5 months ago 157MB sdwan/application-server 19.1.0 6a9624dc3125 5 months ago 508MB sdwan/configuration-db 4.4.38 700fe6e56199 5 months ago 472MB sdwan/coordination-server 3.7.1 a04198d518b3 5 months ago 606MB sdwan/olap-db 23.3.13.6 a17712731d5f 5 months ago 494MB sdwan/device-data-collector 1.0.0 515f2793ee43 5 months ago 116MB sdwan/service-proxy 1.27.2 5174f58b97b1 5 months ago 105MB sdwan/messaging-server 0.20.0 9560cd4b7c42 5 months ago 105MB sdwan/statistics-db 7.17.6 b9f8ab30d647 5 months ago 589MB cloudagent-v2 3358cee09e99 66063bed474e 5 months ago 458MB sdwan/upgrade-coordinator 2.0.0 969cd2f1626a 5 months ago 93.3MB sdwan/vault 1.0.1 0883c094affc 6 months ago 511MB sdwan/support-tools latest 022aebae12e6 13 months ago 143MB sdavc 4.6.0 730e83b39087 17 months ago 602MB sdavc-gw 4.6.0 84083ed484ba 18 months ago 369MB sdwan/reporting latest 509ec99584fd 19 months ago 772MB sdwan/ratelimit latest 719f624e9268 2 years ago 45.7MB Listing all containers ------------------------ CONTAINER ID IMAGE COMMAND CREATED STATUS PORTS NAMES c676b358b12d sdwan/olap-db:23.3.13.6 "/usr/bin/docker-ini…" 10 hours ago Up 10 hours (healthy) 127.0.0.1:8123->8123/tcp olap-db 627c1dcf16fa sdwan/coordination-server:3.7.1 "/docker-entrypoint.…" 10 hours ago Up 10 hours (healthy) 127.0.0.1:2181->2181/tcp, 127.0.0.1:2888->2888/tcp, 127.0.0.1:3888->3888/tcp coordination-server 9299443ff7a1 sdwan/messaging-server:0.20.0 "/entrypoint.sh" 10 hours ago Up 10 hours (healthy) 127.0.0.1:4222->4222/tcp, 127.0.0.1:6222->6222/tcp, 127.0.0.1:8222->8222/tcp messaging-server 0c5236ee911b sdwan/ratelimit:latest "/usr/local/bin/rate…" 10 hours ago Up 10 hours (healthy) 6379/tcp, 127.0.0.1:8460-8462->8460-8462/tcp ratelimit 094166df1cd9 cloudagent-v2:3358cee09e99 "./entrypoint.sh" 10 hours ago Up 10 hours 127.0.0.1:9051-9052->9051-9052/tcp cloudagent-v2 8f1287c11840 sdwan/reporting:latest "/sbin/tini -g -- py…" 10 hours ago Up 10 hours 80/tcp, 127.0.0.1:9080->9080/tcp reporting 66a46485cfab sdwan/vault:1.0.1 "docker-entrypoint.s…" 10 hours ago Up 10 hours (healthy) 8200/tcp, 127.0.0.1:8201->8201/tcp vault ccf5336112b6 sdwan/data-collection-agent:1.0.1 "/usr/bin/docker-ini…" 10 hours ago Up 10 hours (healthy) data-collection-agent 079ecfe36482 sdwan/service-proxy:1.27.2 "/entrypoint.sh" 10 hours ago Up 10 hours (healthy) service-proxy ec1b50457302 sdwan/configuration-db:4.4.38 "/usr/bin/docker-ini…" 10 hours ago Up 10 hours (healthy) 127.0.0.1:5000->5000/tcp, 127.0.0.1:6000->6000/tcp, 127.0.0.1:6362->6362/tcp, 127.0.0.1:6372->6372/tcp, 127.0.0.1:7000->7000/tcp, 127.0.0.1:7473-7474->7473-7474/tcp, 127.0.0.1:7687-7688->7687-7688/tcp configuration-db f54ccdcf7a14 sdwan/device-data-collector:1.0.0 "/bin/sh -c /vMDDC/v…" 10 hours ago Up 10 hours (healthy) 127.0.0.1:8129->8129/tcp device-data-collector 605f986dc9f1 sdwan/application-server:19.1.0 "/sbin/tini -g -- /e…" 10 hours ago Up 10 hours (healthy) application-server 50377e02b120 sdwan/host-agent:1.0.1 "/entrypoint.sh pyth…" 10 hours ago Up 10 hours (healthy) 127.0.0.1:9099->9099/tcp host-agent ca36faf52f36 sdwan/cluster-oracle:1.0.1 "/entrypoint.sh java…" 10 hours ago Up 10 hours (healthy) 127.0.0.1:9090->9090/tcp cluster-oracle Docker info ------------------------ Client: Context: default Debug Mode: false Server: Containers: 14 Running: 14 Paused: 0 Stopped: 0 Images: 19 Server Version: 20.10.25-ce Storage Driver: overlay2 Backing Filesystem: extfs Supports d_type: true Native Overlay Diff: true userxattr: false Logging Driver: local Cgroup Driver: cgroupfs Cgroup Version: 1 Plugins: Volume: local Network: bridge host ipvlan macvlan null overlay Log: awslogs fluentd gcplogs gelf journald json-file local logentries splunk syslog Swarm: inactive Runtimes: io.containerd.runc.v2 io.containerd.runtime.v1.linux runc Default Runtime: runc Init Binary: docker-init containerd version: 1e1ea6e986c6c86565bc33d52e34b81b3e2bc71f.m runc version: v1.1.4-8-g974efd2d-dirty init version: b9f42a0-dirty Security Options: seccomp Profile: default Kernel Version: 5.15.146-yocto-standard Operating System: Linux OSType: linux Architecture: x86_64 CPUs: 16 Total Memory: 30.58GiB Name: vmanage_1 ID: GHLX:JUWP:Z7JP:J3UX:MOF7:ZY7G:MSLS:E7BI:3LKT:2WRU:K2HZ:YWL7 Docker Root Dir: /var/lib/nms/docker Debug Mode: false Registry: https://index.docker.io/v1/ Labels: Experimental: false Insecure Registries: 127.0.0.0/8 Live Restore Enabled: false WARNING: No cpu cfs quota support WARNING: No cpu cfs period support WARNING: No blkio throttle.read_bps_device support WARNING: No blkio throttle.write_bps_device support WARNING: No blkio throttle.read_iops_device support WARNING: No blkio throttle.write_iops_device support NMS SDAVC server is disabled on this vmanage node NMS Device Data Collector Checking Device Data Collector Port.... Port 8129 is reachable Current Health Status:- true Getting docker stats of Device Data Collector container .... CONTAINER ID NAME CPU % MEM USAGE / LIMIT MEM % NET I/O BLOCK I/O PIDS f54ccdcf7a14 device-data-collector 0.00% 9.773MiB / 30.58GiB 0.03% 1.85MB / 876kB 0B / 0B 21 NMS OLAP database Checking cluster connectivity for ports 9000,8123,9009 ... Pinging vManage node 0 on 169.254.1.10:9000,8123,9009... Starting Nping 0.7.80 ( https://nmap.org/nping ) at 2026-02-24 06:18 UTC SENT (0.0013s) Starting TCP Handshake > 169.254.1.10:8123 RCVD (0.0013s) Handshake with 169.254.1.10:8123 completed SENT (1.0024s) Starting TCP Handshake > 169.254.1.10:9000 RCVD (1.0024s) Handshake with 169.254.1.10:9000 completed SENT (2.0036s) Starting TCP Handshake > 169.254.1.10:9009 RCVD (2.0036s) Handshake with 169.254.1.10:9009 completed SENT (3.0047s) Starting TCP Handshake > 169.254.1.10:8123 RCVD (3.0047s) Handshake with 169.254.1.10:8123 completed SENT (4.0058s) Starting TCP Handshake > 169.254.1.10:9000 RCVD (4.0058s) Handshake with 169.254.1.10:9000 completed SENT (5.0069s) Starting TCP Handshake > 169.254.1.10:9009 RCVD (5.0070s) Handshake with 169.254.1.10:9009 completed SENT (6.0081s) Starting TCP Handshake > 169.254.1.10:8123 RCVD (6.0081s) Handshake with 169.254.1.10:8123 completed SENT (7.0092s) Starting TCP Handshake > 169.254.1.10:9000 RCVD (7.0092s) Handshake with 169.254.1.10:9000 completed SENT (8.0103s) Starting TCP Handshake > 169.254.1.10:9009 RCVD (8.0103s) Handshake with 169.254.1.10:9009 completed Max rtt: 0.014ms | Min rtt: 0.008ms | Avg rtt: 0.009ms TCP connection attempts: 9 | Successful connections: 9 | Failed: 0 (0.00%) Nping done: 1 IP address pinged in 8.01 seconds Server network connections -------------------------- tcp 0 0 169.254.1.10:8123 169.254.1.1:38848 ESTABLISHED 18258/clickhouse-se tcp 0 0 169.254.1.10:8123 169.254.1.1:38736 ESTABLISHED 18258/clickhouse-se tcp 0 0 169.254.1.10:8123 169.254.1.1:38864 ESTABLISHED 18258/clickhouse-se tcp 0 0 169.254.1.10:8123 169.254.1.1:38826 ESTABLISHED 18258/clickhouse-se tcp 0 0 169.254.1.10:8123 169.254.1.1:32996 ESTABLISHED 18258/clickhouse-se tcp 0 0 169.254.1.10:8123 169.254.1.1:38792 ESTABLISHED 18258/clickhouse-se tcp 0 0 169.254.1.10:8123 169.254.1.1:38720 ESTABLISHED 18258/clickhouse-se tcp 0 0 169.254.1.10:8123 169.254.1.1:38704 ESTABLISHED 18258/clickhouse-se tcp 0 0 169.254.1.10:8123 169.254.1.1:38790 ESTABLISHED 18258/clickhouse-se tcp 0 0 169.254.1.10:8123 169.254.1.1:38740 ESTABLISHED 18258/clickhouse-se tcp 0 0 169.254.1.10:8123 169.254.1.1:38786 ESTABLISHED 18258/clickhouse-se tcp 0 0 169.254.1.10:8123 169.254.1.1:38576 ESTABLISHED 18258/clickhouse-se tcp 0 0 169.254.1.10:8123 169.254.1.1:38766 ESTABLISHED 18258/clickhouse-se tcp 0 0 169.254.1.10:8123 169.254.1.1:38754 ESTABLISHED 18258/clickhouse-se tcp 0 0 169.254.1.10:8123 169.254.1.1:38828 ESTABLISHED 18258/clickhouse-se tcp 0 0 169.254.1.10:8123 169.254.1.1:38676 ESTABLISHED 18258/clickhouse-se tcp 0 0 169.254.1.10:8123 169.254.1.1:38770 ESTABLISHED 18258/clickhouse-se tcp 0 0 169.254.1.10:8123 169.254.1.1:38620 ESTABLISHED 18258/clickhouse-se tcp 0 0 169.254.1.10:8123 169.254.1.1:32768 ESTABLISHED 18258/clickhouse-se tcp 0 0 169.254.1.10:8123 169.254.1.1:38820 ESTABLISHED 18258/clickhouse-se tcp 0 0 169.254.1.10:8123 169.254.1.1:38574 ESTABLISHED 18258/clickhouse-se tcp 0 0 169.254.1.10:8123 169.254.1.1:38878 ESTABLISHED 18258/clickhouse-se tcp 0 0 169.254.1.10:8123 169.254.1.1:38804 ESTABLISHED 18258/clickhouse-se tcp 0 0 169.254.1.10:8123 169.254.1.1:38692 ESTABLISHED 18258/clickhouse-se tcp 0 0 169.254.1.10:8123 169.254.1.1:38808 ESTABLISHED 18258/clickhouse-se tcp 0 0 169.254.1.10:8123 169.254.1.1:38844 ESTABLISHED 18258/clickhouse-se tcp 0 0 169.254.1.10:8123 169.254.1.1:32984 ESTABLISHED 18258/clickhouse-se tcp 0 0 169.254.1.10:8123 169.254.1.1:60970 ESTABLISHED 18258/clickhouse-se tcp 0 0 169.254.1.10:8123 169.254.1.1:60974 ESTABLISHED 18258/clickhouse-se tcp 0 0 169.254.1.10:8123 169.254.1.1:51222 ESTABLISHED 18258/clickhouse-se tcp 0 0 169.254.1.10:8123 169.254.1.1:38712 ESTABLISHED 18258/clickhouse-se tcp 0 0 169.254.1.10:8123 169.254.1.1:38662 ESTABLISHED 18258/clickhouse-se tcp 0 0 169.254.1.10:8123 169.254.1.1:60986 ESTABLISHED 18258/clickhouse-se tcp 0 0 169.254.1.10:8123 169.254.1.1:38598 ESTABLISHED 18258/clickhouse-se tcp 0 0 169.254.1.10:8123 169.254.1.1:38640 ESTABLISHED 18258/clickhouse-se tcp 0 0 169.254.1.10:8123 169.254.1.1:38652 ESTABLISHED 18258/clickhouse-se tcp 0 0 169.254.1.10:8123 169.254.1.1:32982 ESTABLISHED 18258/clickhouse-se tcp 0 0 169.254.1.10:8123 169.254.1.1:38572 ESTABLISHED 18258/clickhouse-se tcp 0 0 169.254.1.10:8123 169.254.1.1:38630 ESTABLISHED 18258/clickhouse-se tcp 0 0 169.254.1.10:8123 169.254.1.1:38606 ESTABLISHED 18258/clickhouse-se Mode: SingleTenant ---------------------------- Node health state ---------------------------- Server status: [OK] Replica status: [OK] Database summary ---------------------------- database count: 5 table count in db(INFORMATION_SCHEMA) : 4 table count in db(backup) : 0 table count in db(default) : 61 table count in db(information_schema) : 4 table count in db(system) : 82 Tables in database default ---------------------------- - aggregated_apps_dpi_app_60min_summary_view_default - aggregated_apps_dpi_app_summary_default - aggregated_apps_dpi_site_5min_summary_view_default - aggregated_apps_dpi_site_summary_default - aggregated_apps_dpi_stats_default - aggregated_apps_dpi_summary_default - alarm_default - api_telemetry - api_telemetry_metadata - app_hosting_interface_stats_default - app_hosting_stats_default - approute_stats_default - approute_stats_routing_summary_default - approute_stats_transport_summary_default - art_stats_default - audit_log_default - bridge_interface_stats_default - bridge_mac_stats_default - cloudx_stats_default - device_configuration_default - device_events_default - device_health_stats_default - device_stats_files_default - device_system_status_stats_default - dpi_stats_default - eio_lte_stats_default - flow_log_stats_default - fwall_stats_default - interface_stats_default - ips_alert_stats_default - nwa_default - nwapending_default - nwpi_agg_metrics_default - nwpi_app_default - nwpi_domain_agg_trend_default - nwpi_domain_default - nwpi_flow_default - nwpi_flow_event_default - nwpi_flow_metric_default - nwpi_hops_of_flow_default - nwpi_routing_default - nwpi_te_default - nwpi_time_series_default - nwpi_trace_and_task_default - pagination_request_info_default - perf_mon_statistics_default - perf_mon_summary_default - perfmon_app_15min_summary_view_default - perfmon_app_summary_default - qos_stats_default - sdra_stats_default - site_health_stats_default - sleofflinereport_default - speed_test_default - sul_stats_default - tracker_stats_default - umbrella_stats_default - umtsrestevent_default - urlf_stats_default - vnf_stats_default - wlan_client_info_stats_default ---------------------------- ┌─parts.table──────────────────────────────┬──rows─┬─latest_modification─┬─disk_size──┬─primary_keys_size─┬─engine─────────────┬─bytes_size─┬─min_date───┬─max_date───┬─compressed_size─┬─uncompressed_size─┬─ratio─┐ │ device_system_status_stats_default │ 7238 │ 2026-02-24 06:13:12 │ 430.24 KiB │ 100.00 B │ MergeTree │ 440561 │ 2026-02-23 │ 2026-02-24 │ 0.00 B │ 0.00 B │ nan │ │ api_telemetry │ 34476 │ 2026-02-24 06:06:32 │ 306.22 KiB │ 264.00 B │ MergeTree │ 313574 │ tuple() │ tuple() │ 0.00 B │ 0.00 B │ nan │ │ audit_log_default │ 744 │ 2026-02-24 06:15:48 │ 200.16 KiB │ 48.00 B │ MergeTree │ 204967 │ 2026-02-23 │ 2026-02-24 │ 0.00 B │ 0.00 B │ nan │ │ device_events_default │ 4819 │ 2026-02-24 06:17:06 │ 189.26 KiB │ 245.00 B │ MergeTree │ 193802 │ 2026-02-23 │ 2026-02-24 │ 0.00 B │ 0.00 B │ nan │ │ interface_stats_default │ 7036 │ 2026-02-24 06:10:50 │ 117.07 KiB │ 104.00 B │ MergeTree │ 119879 │ 2026-02-23 │ 2026-02-24 │ 0.00 B │ 0.00 B │ nan │ │ alarm_default │ 408 │ 2026-02-23 21:48:41 │ 69.99 KiB │ 212.00 B │ ReplacingMergeTree │ 71671 │ 2026-02-23 │ 2026-02-23 │ 0.00 B │ 0.00 B │ nan │ │ api_telemetry_metadata │ 5342 │ 2026-02-24 06:01:04 │ 57.52 KiB │ 32.00 B │ MergeTree │ 58899 │ tuple() │ tuple() │ 0.00 B │ 0.00 B │ nan │ │ approute_stats_default │ 2540 │ 2026-02-24 06:10:20 │ 37.25 KiB │ 259.00 B │ MergeTree │ 38139 │ 2026-02-23 │ 2026-02-24 │ 0.00 B │ 0.00 B │ nan │ │ device_configuration_default │ 18 │ 2026-02-23 20:55:39 │ 33.97 KiB │ 51.00 B │ MergeTree │ 34787 │ 2026-02-23 │ 2026-02-23 │ 0.00 B │ 0.00 B │ nan │ │ device_health_stats_default │ 1463 │ 2026-02-24 06:15:00 │ 23.07 KiB │ 303.00 B │ ReplacingMergeTree │ 23626 │ 2026-02-23 │ 2026-02-24 │ 0.00 B │ 0.00 B │ nan │ │ site_health_stats_default │ 1413 │ 2026-02-24 06:15:01 │ 9.95 KiB │ 230.00 B │ ReplacingMergeTree │ 10185 │ 2026-02-23 │ 2026-02-24 │ 0.00 B │ 0.00 B │ nan │ │ approute_stats_routing_summary_default │ 70 │ 2026-02-23 20:30:17 │ 1.79 KiB │ 83.00 B │ MergeTree │ 1837 │ tuple() │ tuple() │ 0.00 B │ 0.00 B │ nan │ │ nwa_default │ 120 │ 2026-02-24 06:11:08 │ 1.69 KiB │ 32.00 B │ MergeTree │ 1734 │ 2026-02-23 │ 2026-02-24 │ 0.00 B │ 0.00 B │ nan │ │ approute_stats_transport_summary_default │ 18 │ 2026-02-23 20:30:17 │ 997.00 B │ 83.00 B │ MergeTree │ 997 │ tuple() │ tuple() │ 0.00 B │ 0.00 B │ nan │ └──────────────────────────────────────────┴───────┴─────────────────────┴────────────┴───────────────────┴────────────────────┴────────────┴────────────┴────────────┴─────────────────┴───────────────────┴───────┘ Application server stats --------------------------------- STATISTICS --------------------------------- Success: 20418 Fail: 0 CONN DOWN: 0 OOM: 0 ILL ARG: 0 --------------------------------- This action is not supported vmanage_1# -
Revision History
| Revision | Publish Date | Comments |
|---|---|---|
4.0 |
13-Oct-2023
|
vManage Cluster Upgrade Section |
3.0 |
11-Jul-2023
|
Pre-checks to Be Performed Prior to a Controller Upgrade |
2.0 |
27-Apr-2023
|
Initial Release |
1.0 |
26-Apr-2023
|
Initial Release |
Contributed by Cisco Engineers
- Cesar Daniel AvilaTechnical Consulting Engineer
- Ian EstradaTechnical Consulting Engineer
 Feedback
Contact Cisco
- Open a Support Case

- (Requires a Cisco Service Contract)