Throughput Issues on ASR1000 Series Router
Available Languages
Download Options
Bias-Free Language
The documentation set for this product strives to use bias-free language. For the purposes of this documentation set, bias-free is defined as language that does not imply discrimination based on age, disability, gender, racial identity, ethnic identity, sexual orientation, socioeconomic status, and intersectionality. Exceptions may be present in the documentation due to language that is hardcoded in the user interfaces of the product software, language used based on RFP documentation, or language that is used by a referenced third-party product. Learn more about how Cisco is using Inclusive Language.
Contents
Introduction
This document describes the procedure to identify whether the packet loss on an ASR1000 router is due to the maximum capacity of its component/Field Replaceable Units (FRU). Knowledge of the router forwarding capacity saves time as it eliminates the need for lengthy ASR1000 packet drop troubleshoot.
Prerequisites
Requirements
There are no specific requirements for this document.
Components Used
The information in this document is based on these software and hardware versions:
- All Cisco ASR 1000 Series Aggregation Services Routers, which include the 1001, 1002, 1004, 1006 and 1013 platforms
- Cisco IOS®-XE Software Release that supports the Cisco ASR 1000 Series Aggregation Services Routers
The information in this document was created from the devices in a specific lab environment. All of the devices used in this document started with a cleared (default) configuration. If your network is live, make sure that you understand the potential impact of any command.
Conventions
Refer to Cisco Technical Tips Conventions for more information on document conventions.
Problem
ASR1000 series router platform is a centralized router platform which means all the packets received by the router have to reach a centralized forwarding engine before it can be sent out. The centralized forwarding card is called the Embedded Service Processor (ESP). The ESP module in the chassis determines the forwarding capacity of the router. The Shared Port Adaptors (SPA) which receives packets from the line or send packets out on to the line is connected to ESP card though a carrier card called SPA Interface Processors (SIP). The aggregate bandwidth capacity of the SIP determines how much traffic is sent to and from the ESP.
Miscalculation of the Router capacity for the hardware configuration in use (ESP and SIP combination) can lead to network designs where the ASR1000 series router fails to forward packets at line rate.
Solution
Three scenarios which can cause packet loss on an ASR1000 series router are explained in this section. The next section provides the Command Line Interface (CLI) that detect if the router is hit by one ofthese scenarios.
Scenario 1. High Bandwidth Ingress Interface(s) and Low Bandwidth Egress Interface(s)
Examples are:
- Traffic received on two Gig interfaces and transmitted out on one Gig interface
- Traffic received on a 10 Gig and transmitted out on a Gig interface
The SIP card supports the ingress packet classification and buffering in order to allow for oversubscription. Identify the ingress and egress interfaces for the traffic flow. If the router have a high bandwidth ingress link which receives packets at line rate and a low bandwidth egress link, it causes buffering at the ingress SIP.
Sustained incoming line rate traffic in these scenarios over a period of time causes the buffers to run out eventually and the router starts to drop packets. These manifest as ignored or ingress over sub drops in the show interface <interface-name> x/x/x controller output on the ingress interface.
- The fix in this scenario is to study the traffic flow in the network and distribute it based on the link capacity.
Note: SIP supports ingress packet classification which allows high priority packets to be still forwarded (as long as it is not over subscribed) and the non-critical packets gets dropped.
The ingress classification and scheduling of packets on ASR1000 routers is explained in the link.
Classifying and Scheduling packets on ASR1000
Scenario 2. Congestion at Next Hop Device and Interface Flow Control is On
Run the show interface output on the egress interface to check if flow control is on and if the interface receives pause inputs from the next hop device. Pause inputs indicates that the next hop device is congested. Input pause frames notifies the ASR1000 to slow down which causes packet buffering on the ASR1000. This ultimately leads to packet drops if the traffic rate is high and sustained over a period of time.
- The ASR1000 is not at fault in this scenario and the fix is to remove the bottleneck in the next hop device. Because the drops are seen on the router it is highly likely that network engineers overlook the nexthop device and all the troubleshoot efforts can be carried outon the router.
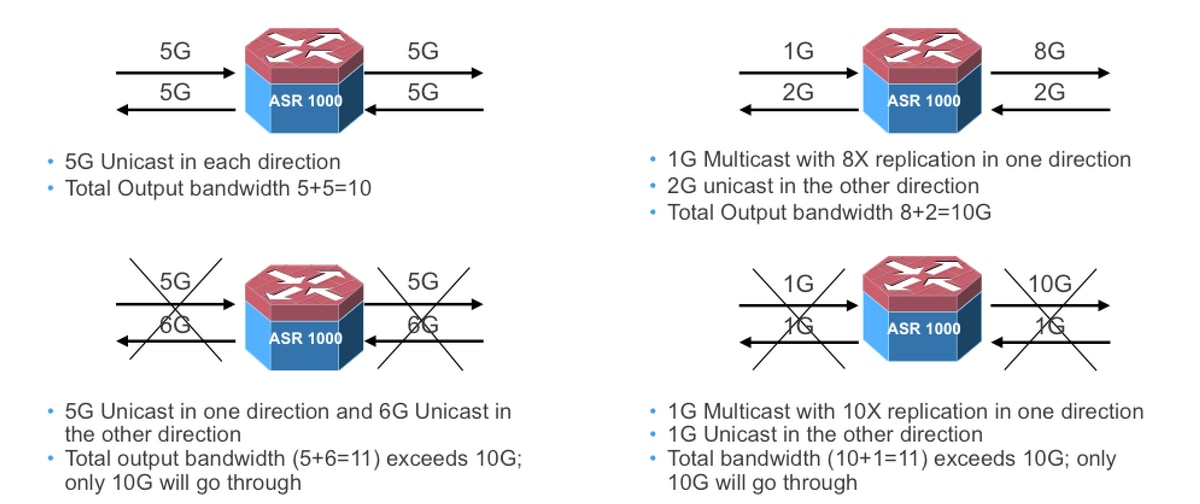
Scenario 3. Traffic Rate At or Higher Than Router Forwarding Capacity
Run the show platform command to identify the ESP and the SIP type in the chassis. ASR1000 has a passive back-plane; the throughput of the system is determined by the type of ESP and SIP used in the system.
For example:
- Part numbers ASR1000-ESP5, ASR1000-ESP20, ASR1000-ESP40, ASR1000-ESP100, and ASR1000-ESP200 can handle 5G, 20G, 40G, 100G and 200G worth of traffic. ESP bandwidth denotes the total output bandwidth of the system, regardless of the direction.
- Part numbers ASR-1000-SIP10, ASR-1000-SIP40 provides 10G and 40G of aggregate bandwidth per slot. The traffic delivered to the ESP by a SIP10 card with its two subslots populated with two SPA-1X10GE-L-V2 cards is determined by the SIP10 bandwidth and not the 20G line rate traffic received by the two 10GE SPA's.
The throughput of an ASR1000 router which has an ESP10 is as shown in the image
Run the show interface summary command to check the total traffic that traverses the router. Received Data Rate (RXBS) and Transmit Data Rate (TXBS) column provides the total ingress and egress rate.
Run the Show platform hardware qfp active datapath utilization summary in order to check the load on the ESP. If the ESP is overloaded then it back-pressures the ingress SIP card to slow down and start to buffer which ultimately leads to packet loss if the high rate is stained over a longer period.
The actions to follow in this scenario are:
- Upgrade the ESP card if the ESP limits have reached.
- Check the scale limits for the features configured on the router if the ESP data-path utilization is high and the traffic rate is below the ESP limits.
- Ensure the correct combination of ESP and SIP card are used for the traffic flow that traverses the router.
Troubleshoot Commands
If the troubleshoot commands reveal that the router is not impacted by the scenarios explained, proceed to the ASR1000 packet drop troubleshoot.
Packet Drops on Cisco ASR 1000 Series Service Routers
Here are a set of useful commands:
- show platform
- show interface <interface-name> <slot/card/port> controller
- show interface summary
- show platform hardware qfp active datapath utilization summary
- show platform hardware port <slot/card/port> plim buffer settings
- show platform hardware port <slot/card/port> plim buffer settings details
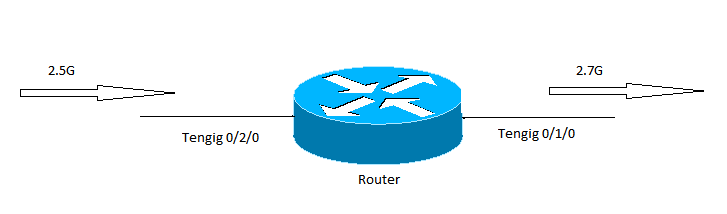
In this example, traffic is received on TenGigEthernet 0/2/0 and transmitted on TenGigEthernet0/1/0. The outputs are captured from an ASR1002 router loaded with15.1(3)S2 IOS®-XE software.
Show Platform
Run the show platform outputs in order to identify the capacity of the ESP and the SIP card. In this example, the total forwarding capacity (maximum output capacity ) of the router is 5G and is determined by the ESP capacity.
------------------ show platform ------------------


Chassis type: ASR1002

Slot      Type                State                 Insert time (ago)
--------- ------------------- --------------------- -----------------
0         ASR1002-SIP10       ok                    3y45w
 0/0      4XGE-BUILT-IN       ok                    3y45w
 0/1      SPA-1X10GE-L-V2     ok                    3y45w
 0/2      SPA-1X10GE-L-V2     ok                    3y45w
R0        ASR1002-RP1         ok, active            3y45w
F0        ASR1000-ESP5        ok, active            3y45w
P0        ASR1002-PWR-AC      ok                    3y45w
P1        ASR1002-PWR-AC      ok                    3y45w

Slot      CPLD Version        Firmware Version
--------- ------------------- ---------------------------------------
0         07120202            12.2(33r)XNC
R0        08011017            12.2(33r)XNC
F0        07091401            12.2(33r)XNC
Show Interface
The ingress over subscription drops indicate buffering in the ingress SIP and points that the forwarding engine or egress path congestion. The flow control status indicates whether the router processes the pause frames received or sends out pause frames in case of congestion.
Router#sh int Te0/2/0 controller
TenGigabitEthernet0/2/0 is up, line protocol is up
Hardware is SPA-1X10GE-L-V2, address is d48c.b52e.e620 (bia d48c.b52e.e620)
Description: Connection to DET LAN
Internet address is 10.10.101.10/29
MTU 1500 bytes, BW 10000000 Kbit/sec, DLY 10 usec,
reliability 255/255, txload 8/255, rxload 67/255
Encapsulation ARPA, loopback not set
Keepalive not supported
Full Duplex, 10000Mbps, link type is force-up, media type is 10GBase-SR/SW
output flow-control is on, input flow-control is on
ARP type: ARPA, ARP Timeout 04:00:00
Last input 00:06:33, output 00:00:35, output hang never
Last clearing of "show interface" counters 1d18h
Input queue: 0/375/0/0 (size/max/drops/flushes); Total output drops: 0
Queueing strategy: fifo
Output queue: 0/40 (size/max)
5 minute input rate 2649158000 bits/sec, 260834 packets/sec
5 minute output rate 335402000 bits/sec, 144423 packets/sec
15480002600 packets input, 18042544487535 bytes, 0 no buffer
Received 172 broadcasts (0 IP multicasts)
0 runts, 0 giants, 0 throttles
0 input errors, 0 CRC, 0 frame, 0 overrun, 0 ignored
0 watchdog, 257 multicast, 0 pause input
10759162793 packets output, 4630923784425 bytes, 0 underruns
0 output errors, 0 collisions, 0 interface resets
0 unknown protocol drops
0 babbles, 0 late collision, 0 deferred
0 lost carrier, 0 no carrier, 0 pause output
0 output buffer failures, 0 output buffers swapped out
TenGigabitEthernet0/2/0
0 input vlan errors
444980 ingress over sub drops
0 Number of sub-interface configured
vdevburr01c10#
Show Platform Hardware QFP Active Datapath Utilization Summary
This command reveals the load on the ESP. If the row Processing: Load has high values, it indicates the ESP utilization is high and needs further troubleshoot to see if it is caused due to features configured on the router or high traffic rate.
Router0#show platform hardware qfp active datapath utilization
  CPP 0                     5 secs       1 min       5 min      60 min
Input:  Priority (pps)        1073         921        1048        1203
                 (bps)     1905624     1772832     1961560     2050136
    Non-Priority (pps)      491628      407831      415573      373270
                 (bps)  3536432120  2962683416  3051102376  2652122448
           Total (pps)      492701      408752      416621      374473
                 (bps)  3538337744  2964456248  3053063936  2654172584
Output: Priority (pps)         179         170         124         181
                 (bps)      535864      509792      370408      540416
    Non-Priority (pps)      493706      409239      417159      374982
                 (bps)  3545612320  2967293504  3056172104  2657838152
           Total (pps)      493885      409409      417283      375163
                 (bps)  3546148184  2967803296  3056542512  2658378568
Processing: Load (pct)          17          46          38          36
Show Interface Summary
The TXBS field gives the total output traffic on the router. In this example, total output traffic is 3.1G (2680945000 + 372321000 = 3053266000).
Router#sh int summary

 *: interface is up
 IHQ: pkts in input hold queue     IQD: pkts dropped from input queue
 OHQ: pkts in output hold queue    OQD: pkts dropped from output queue
 RXBS: rx rate (bits/sec)          RXPS: rx rate (pkts/sec)
 TXBS: tx rate (bits/sec)          TXPS: tx rate (pkts/sec)
 TRTL: throttle count

  Interface                   IHQ       IQD       OHQ       OQD      RXBS      RXPS      TXBS      TXPS      TRTL
-----------------------------------------------------------------------------------------------------------------
  GigabitEthernet0/0/0          0         0         0         0         0         0         0         0         0
  GigabitEthernet0/0/1          0         0         0         0         0         0         0         0         0
  GigabitEthernet0/0/2          0         0         0         0         0         0         0         0         0
  GigabitEthernet0/0/3          0         0         0         0         0         0         0         0         0


* Te0/1/0                       0         0         0         0 383941000    152887 2680945000    265668        0
* Te0/2/0                       0         0         0         0 2541026000    254046 372321000    147526        0
  GigabitEthernet0              0         0         0         0         0         0         0         0         0
* Loopback0                     0         0         0         0         0         0         0         0         0
Show Platform Hardware Port <slot/card/port> Plim Buffer Settings
Use this command to check the buffer fill status on the PLIM. If the Curr value is near the Max, it indicates the PLIM buffers are filled up.
Router#Show platform hardware port 0/2/0 plim buffer settings
Interface 0/2/0
  RX Low
    Buffer Size 28901376 Bytes
    Drop Threshold 28900416 Bytes
    Fill Status Curr/Max 0 Bytes / 360448 Bytes
  TX Low
    Interim FIFO Size 192 Cache line
    Drop Threshold 109248 Bytes
    Fill Status Curr/Max 1024 Bytes / 2048 Bytes
  RX High
    Buffer Size 4128768 Bytes
    Drop Threshold 4127424 Bytes
    Fill Status Curr/Max 1818624 Bytes / 1818624 Bytes
  TX High
    Interim FIFO Size 192 Cache line
    Drop Threshold 109248 Bytes
    Fill Status Curr/Max 0 Bytes / 0 Bytes
Router#Show platform hardware port 0/2/0 plim buffer settings detail
Interface 0/2/0
  RX Low
    Buffer Size 28901376 Bytes
    Fill Status Curr/Max 0 Bytes / 360448 Bytes
    Almost Empty TH0/TH1 14181696 Bytes / 14191296 Bytes
    Almost Full  TH0/TH1 28363392 Bytes / 28372992 Bytes
    SkipMe Cache Start / End Addr 0x0000A800 / 0x00013AC0
    Buffer       Start / End Addr 0x01FAA000 / 0x03B39FC0
  TX Low
    Interim FIFO Size 192 Cache line
    Drop Threshold 109248 Bytes
    Fill Status Curr/Max 1024 Bytes / 2048 Bytes
    Event XON/XOFF 49536 Bytes / 99072 Bytes
    Buffer Start / End Addr 0x00000300 / 0x000003BF
  RX High
    Buffer Size 4128768 Bytes
    Fill Status Curr/Max 1818624 Bytes / 1818624 Bytes
    Almost Empty TH0/TH1 1795200 Bytes / 1804800 Bytes
    Almost Full  TH0/TH1 3590400 Bytes / 3600000 Bytes
    SkipMe Cache Start / End Addr 0x00013B00 / 0x00014FC0
    Buffer       Start / End Addr 0x03B3A000 / 0x03F29FC0
  TX High
    Interim FIFO Size 192 Cache line
    Drop Threshold 109248 Bytes
    Fill Status Curr/Max 0 Bytes / 0 Bytes
    Event XON/XOFF 49536 Bytes / 99072 Bytes
    Buffer Start / End Addr 0x000003C0 / 0x0000047F
Contributed by Cisco Engineers
- Shabeer MansoorCisco TAC Engineer
 Feedback
Contact Cisco
- Open a Support Case

- (Requires a Cisco Service Contract)