
Reduce complexity. Boost business.
Get consistent, agile connectivity
Simplify operations with policy-driven connectivity to accelerate secure and consistent deployment.

Protect your business
Stay protected with Cisco ACI zero-trust security, automated policies, and hybrid mesh firewall integration for business continuity.

Streamline your path to automation
Scale with seamless connectivity for any workload using automated, centralized policy management and dynamic network provisioning.

Access detailed analytics
With Cisco Nexus Dashboard, you can configure, operate, and analyze everything connected to your data center—all from one place.

Get more for your network by optimizing with trusted integrations
Choose the right software subscription for you
Cisco ACI
Networking Essentials
For single data center. Includes Cisco ACI management and operations capabilities.
Cisco ACI
Networking Advantage
For multiple data centers and/or clouds. Includes advanced capabilities in addition to Networking Essentials.
Recommended
Cisco ACI
Networking Premier
For multiple data centers and/or clouds. Includes Essentials and Advantage as well as insights and orchestration capabilities.
Explore customer stories


FAQs for Cisco Application Centric Infrastructure (ACI)
Cisco Application Centric Infrastructure (Cisco ACI) is a comprehensive networking solution for data centers. It enables faster innovation and minimizes downtime by simplifying, optimizing, and accelerating infrastructure deployment to expedite application deployment lifecycles.
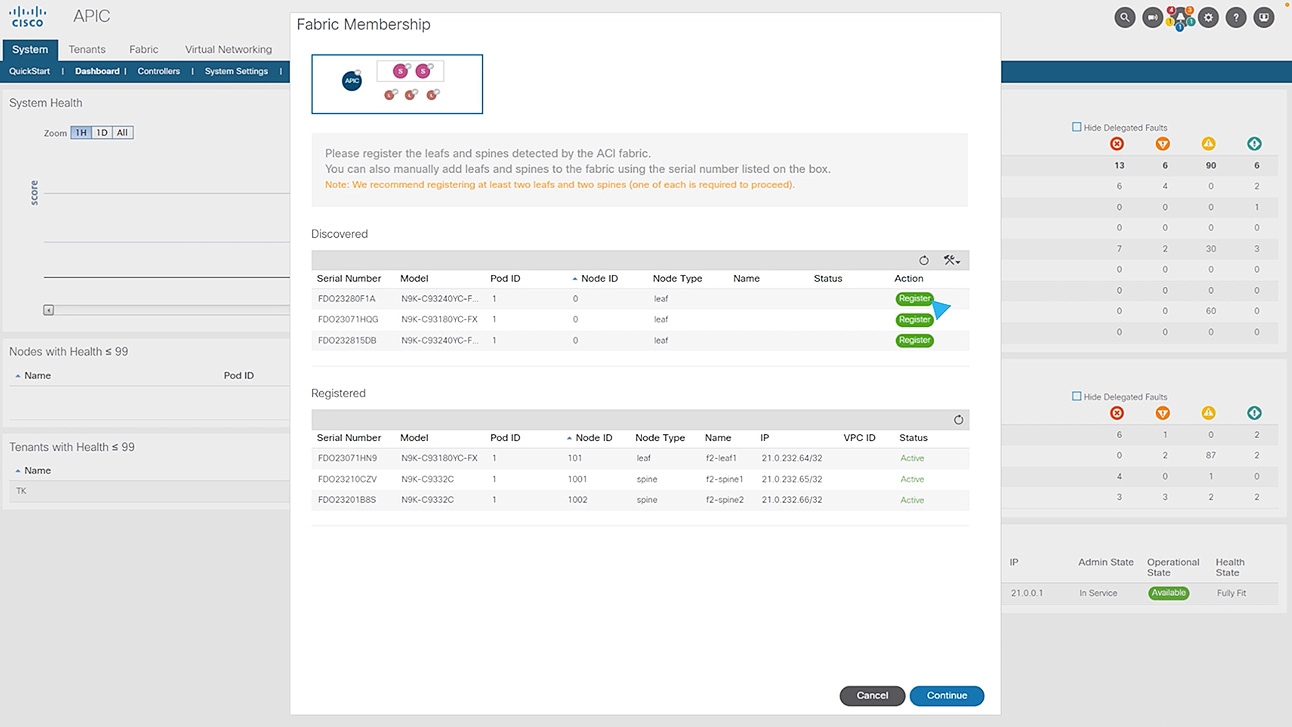
The Cisco ACI solution consists of two main components: Cisco Application Policy Infrastructure Controller (APIC) and the Cisco Nexus 9000 Series spine and leaf switches for Cisco ACI.
Cisco ACI helps you optimize your network, accelerate multi-cloud, and build protection through business continuity, integrated security features, and consistent security posture at scale.
Yes, common examples include integrations with Cisco Nexus Dashboard, Splunk AppDynamics, Cisco DNA-C/ISE, and Cisco SD-WAN for branch offices (network edge).