Cisco Spaces: Live Occupancy App

This chapter describes about the Live Occupancy app.

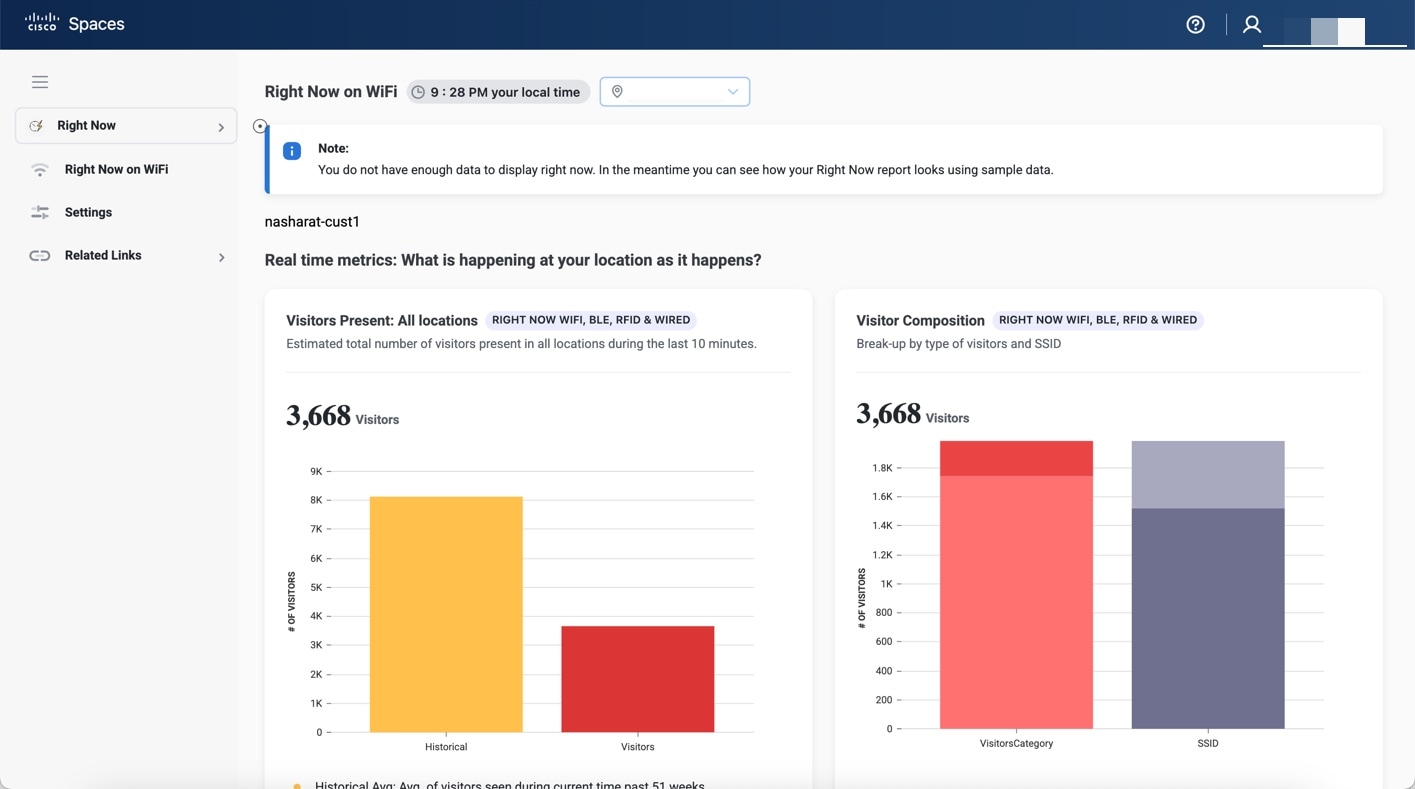
Live Occupancy Overview

The Live Occupancy app provides you the Live Occupancy report that shows the details of visitors currently present at your locations.

The Live Occupancy app is enhanced to address issues with counts when there are any changes in the Location Hierarchy. Prior to this enhancement, changes in Location Hierarchy such as adding new locations, removing existing locations or updating vital parameters such as TimeZone introduced stale or incorrect counts for Wi-Fi.

With this enhancement, the Presence chart count gets reset (removes all existing numbers until the current time) for the present day because the counts are invalid after the Location Hierarchy changes.

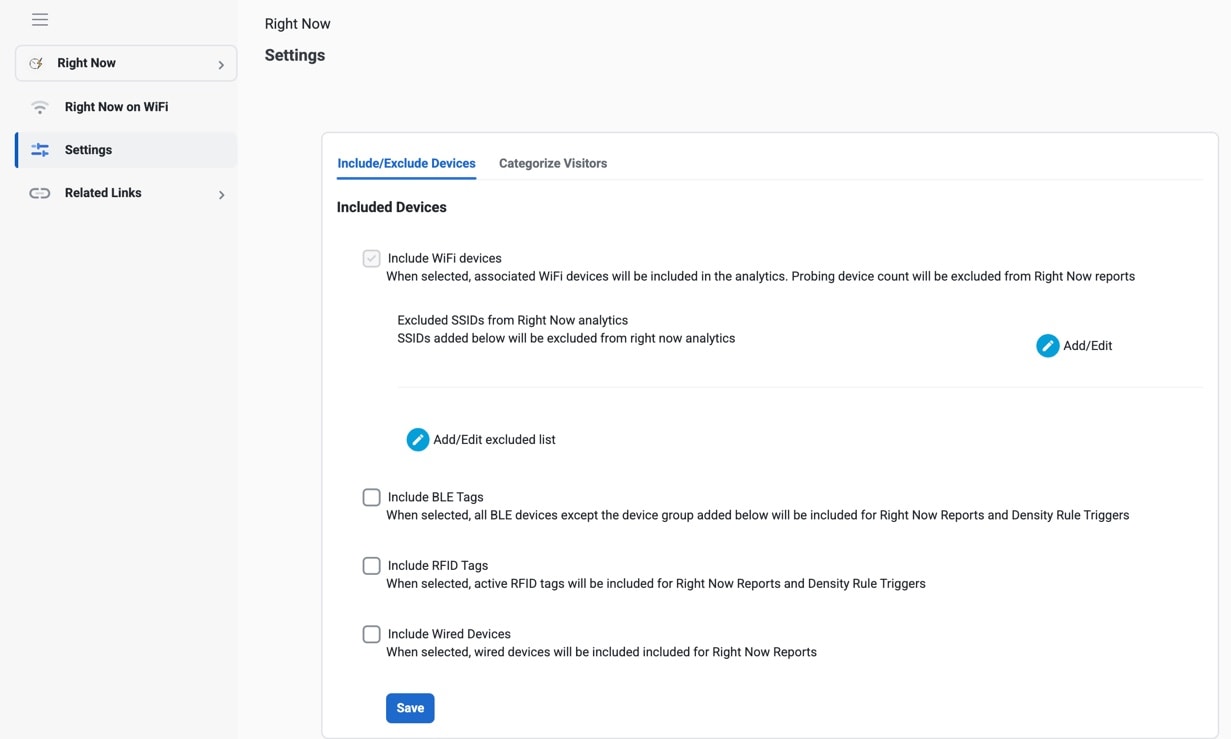
The Live Occupancy app is available for these license types:

  • SEE

  • EXTEND

  • SWITCH_EXT

  • SMART_VENUES

  • SMART_OPERATIONS

  • SMART_OPERATIONS_BASE

  • ACT (displayed in the UI as Advantage)

  • UNLIMTED

  • PREMIER_W

  • PREMIER_CW

WiFi Occupancy

The WiFi occupancy report displays the details of the visitors currently present at your locations. By default, the report shows the details of visitors currently present at all locations. You can filter upto the floor level.

The WiFi occupancy is enhanced to show the count of excluded devices that are not considered as visitors or filtered during data processing. The excluded device count is displayed as a message in the Note section of the WiFi occupancy.

Figure 1. Live Occupancy App

Note


  • If a location is removed or modified in the location hierarchy or timezone is changed, the existing Presence chart count is reset.

  • For BLE processing:

    • BLE group information should be received as part the IoT updates

    • RSSI value should be greater than -85

  • For probing devices:

    • Cisco Connector and other device types: RSSI value should be greater than -70

    • Cisco Meraki: RSSI value should be greater than -100.

    Only those probing devices meeting the specified signal strength thresholds are allowed to share the device location update events as part of the Firehose data stream.


Viewing the Live Occupancy Report

To view the Live Occupancy report, perform the following steps:

Procedure


Step 1

In the Cisco Spaces Dashboard, choose Live Occupancy.

The Live Occupancy app is displayed.

Step 2

From the Location drop-down list, choose the desired network location.

The Live Occupancy report for the selected network location is displayed.

The local time of your system is displayed under the Live Occupancy section at the top of the report.

The Live Occupancy report displays the following charts:

  • Visitors Present: All locations: Displays an estimated total number of visitors, during the last 10 minutes, in the filtered location including its child location.

  • Visitor Composition: Displays the composition of active visitors, in percentage, by SSID category (employee, guest, etc.) and by SSID (top 5 SSIDs).

  • Visitors Present: All Locations: Displays a trend of the total number of visitors during the last 10 minutes for the filtered location.

  • Visitors Present: Map View: Displays the location-wise count of active visitors in the child locations of the filtered location.

    • Map View: The child locations of the filtered location are shown in the world map along with the total number of visitors in each of those child locations.

      • Floor map view: Select a specific floor to see the chosen floor map view as well.

        If the selected location has a map, imported from Cisco CMX, which is uploaded to Cisco Spaces, you can view the floor and the total number of visitors on the displayed floor.

    • List View: The child locations of the filtered location are listed, and the number of current visitors for each child location is shown against that location.

Note

 
  • An "active visitor" can be any visitor who is present at the location during the last 10 minutes and is connected to the network (WLAN or SSID).

  • If a device has a dwell time lesser than a minute, during the 10-minute window, it is excluded from the Right Now report.

  • The average value for the last 51 weeks is shown as historical data for each chart in the report.


Settings

The Settings menu helps you manage devices, SSIDs, and visitors in the Live Occupancy app reports. The Settings menu includes the Include/Exclude Devices and Categorize Visitors tabs.

Figure 2. Live Occupancy - Settings

Including or Excluding Devices

Use the Include/Exclude Devices tab to select among the following options for Wi-Fi, BLE, and RFID devices for the Live Occupancy reports:

  • Wi-Fi devices option is included by default and you cannot deselect the same.

    To exclude devices connected to specific SSIDs from the Live Occupancy analytics, click Add/Edit or Add/Edit excluded list and select the desired SSIDs from the Exclude SSIDs list.

  • BLE Tags: To include BLE tags in the Live Occupancy reports, select Include BLE Tags.

    To exclude specific device groups from the Live Occupancy analytics, click Add/Edit or Add/Edit excluded list and select the desired BLE devices from the Exclude BLE devices list.

  • RFID Tags: To include RFID tags in the Live Occupancy reports, select Include RFID Tags.


Note


  • If you select RFID and BLE tags, then the corresponding device count is displayed in the Live Occupancy report.

  • If you configure an SSID to be excluded here, it not only excludes the clients connected to that SSID from Live Occupancy but also excludes them from other applications that receive data from Live Occupancy such as Partner Firehose Wifi data, Space Utilisation Floor occupancy metrics, and Signage Occupancy Count.


Categorizing Visitors

Use the Categorize Visitors tab to automatically or manually classify visitors, based on the visitor type, that have joined an SSID. The options available are:

  • Auto

  • Guest

  • Employee

  • Custom