Configuring the Embedded Event Manager

This chapter describes how to configure the Embedded Event Manager (EEM) to detect and handle critical events on Cisco NX-OS devices.

About EEM

EEM monitors events that occur on your device and takes action to recover or troubleshoot these events, based on your configuration.

EEM consists of three major components:

  • Event statements—Events to monitor from another Cisco NX-OS component that may require some action, workaround, or notification.

  • Action statements—An action that EEM can take, such as executing CLI commands, sending an email through the use of Smart Call Home feature, and disabling an interface to recover from an event.

  • Policies—An event that is paired with one or more actions to troubleshoot or recover from the event.

Policies

An EEM policy consists of an event statement and one or more action statements. The event statement defines the event to look for as well as the filtering characteristics for the event. The action statement defines the action EEM takes when the event occurs.

This figure shows the two basic statements in an EEM policy.

Figure 1. EEM Policy Statements

You can configure EEM policies using the command-line interface (CLI) or a VSH script.

EEM gives you a device-wide view of policy management. You configure EEM policies on the supervisor, and EEM pushes the policy to the correct module based on the event type. EEM takes any actions for a triggered event either locally on the module or on the supervisor (the default option).

EEM maintains event logs on the supervisor.

Cisco NX-OS has a number of preconfigured system policies. These system policies define many common events and actions for the device. System policy names begin with two underscore characters (__).

You can create user policies to suit your network. If you create a user policy, any actions in your policy occur after EEM triggers any system policy actions that are related to the same event as your policy.

You can also override some system policies. The overrides that you configure take the place of the system policy. You can override the event or the actions.

Use the show event manager system-policy command to view the preconfigured system policies and determine which policies that you can override.


Note


You should use the show running-config eem command to check the configuration of each policy. An override policy that consists of an event statement and no action statement triggers no action and no notification of failures.

Note


Your override policy should always include an event statement. An override policy without an event statement overrides all possible events in the system policy.

Event Statements

An event is any device activity for which some action, such as a workaround or a notification, should be taken. In many cases, these events are related to faults in the device such as when an interface or a fan malfunctions.

EEM defines event filters so only critical events or multiple occurrences of an event within a specified time period trigger an associated action.

This figure shows events that are handled by EEM.
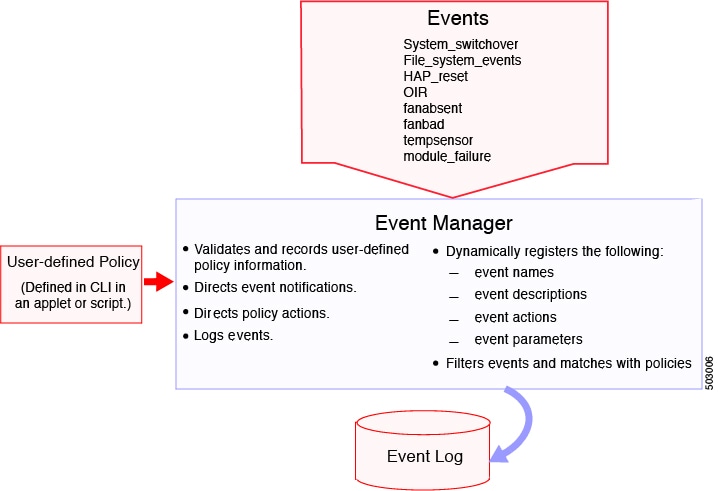
Figure 2. EEM Overview

Event statements specify the event that triggers a policy to run. You can configure multiple event triggers.

EEM schedules and runs policies on the basis of event statements. EEM examines the event and action commands and runs them as defined.


Note


If you want to allow the triggered event to process any default actions, you must configure the EEM policy to allow the event default action statement.

Action Statements

Action statements describe the action triggered by a policy. Each policy can have multiple action statements. If no action is associated with a policy, EEM still observes events but takes no actions.

EEM supports the following actions in action statements:

  • Execute any CLI commands.

  • Update a counter.

  • Log an exception.

  • Force the shutdown of any module.

  • Reload the device.

  • Shut down specified modules because the power is over budget.

  • Generate a syslog message.

  • Generate a Call Home event.

  • Generate an SNMP notification.

  • Use the default action for the system policy.


Note


EEM can only process a complete action cli list of up to 1024 characters in total. If more actions are required, you must define them as a new redundant applet with same trigger.


Note


If you want to allow the triggered event to process any default actions, you must configure the EEM policy to allow the default action. For example, if you match a CLI command in a match statement, you must add the event-default action statement to the EEM policy or EEM will not allow the CLI command to execute.

Note


Verify that your action statements within your user policy or overriding policy do not negate each other or adversely affect the associated system policy.

VSH Script Policies

You can also write policies in a VSH script, using a text editor. These policies have an event statement and action statement(s) just as other policies, and these policies can either augment or override system policies. After you write your VSH script policy, copy it to the device and activate it.

Environment Variables

You can define environment variables for EEM that are available for all policies. Environment variables are useful for configuring common values that you can use in multiple policies. For example, you can create an environment variable for the IP address of an external email server.

You can use an environment variable in action statements by using the parameter substitution format.

This example shows a sample action statement to force a module 1 shutdown, with a reset reason of "EEM action."

switch (config-eem-policy)# action 1.0 forceshut module 1 reset-reason “EEM action.”

If you define an environment variable for the shutdown reason, called default-reason, you can replace that reset reason with the environment variable, as shown in the following example.

switch (config-eem-policy)# action 1.0 foreshut module 1 reset-reason $default-reason

You can reuse this environment variable in any policy.

EEM Event Correlation

You can trigger an EEM policy based on a combination of events. First, you use the tag keyword to create and differentiate multiple events in the EEM policy. Then using a set of boolean operators (and, or, andnot), along with the count and time, you can define a combination of these events to trigger a custom action.

High Availability

Cisco NX-OS supports stateless restarts for EEM. After a reboot or supervisor switchover, Cisco NX-OS applies the running configuration.

Virtualization Support

Not all actions or events are visible. You must have network-admin privileges to configure policies.
Prerequisites for EEM

EEM has the following prerequisites:

  • You must have network-admin user privileges to configure EEM.

Guidelines and Limitations for EEM

EEM has the following configuration guidelines and limitations:

  • The maximum number of configurable EEM policies is 500.

  • Action statements within your user policy or overriding policy should not negate each other or adversely affect the associated system policy.

  • To allow a triggered event to process any default actions, you must configure the EEM policy to allow the default action. For example, if you match a CLI command in a match statement, you must add the event-default action statement to the EEM policy or EEM will not allow the CLI command to execute.

  • Only single action is supported when option collect is used in event applet action statement.

  • The following guidelines apply to Event Log Auto-Collection and Backup:

    • By default, enabled log collection on a switch provides between 15 minutes to several hours of event logs depending on size, scale and component activity.

    • To be able to collect relevant logs that span a longer period, only enable event log retention for the specific services/features you need. See "Enabling Extended Log File Retention For a Single Service". You can also export the internal event logs. See "External Log File Storage".

    • When troubleshooting, it is good practice to manually collect a snapshot of internal event logs in real time. See "Generating a Local Copy of Recent Log Files".

  • When you configure an EEM policy action to collect show tech commands, make sure to allocate enough time for the show tech commands to complete before the same action is called again.

  • Note the following about override policies:

    • An override policy that consists of an event statement without an action statement triggers no action and no notification of failures.

    • An override policy without an event statement overrides all possible events in the system policy.

  • The following rules apply to regular command expressions:

    • All regular expressions must conform to the Portable Operating System Interface for uniX (POSIX) extended standard.

    • All keywords must be expanded.

    • Only the * symbol can be used for argument replacement.

  • Note the following about EEM event correlation:

    • EEM event correlation is supported only on the supervisor module.

    • EEM event correlation is not supported across different modules within a single policy.

    • EEM event correlation supports up to four event statements in a single policy. The event types can be the same or different, but only these event types are supported: cli, counter, module, module-failure, oir, snmp, and syslog.

    • EEM event correlation does not override the system default policies.

  • When more than one event statement is included in an EEM policy, each event statement must have a tag keyword with a unique tag argument.

  • Default action execution is not supported for policies that are configured with tagged events.

  • You can invoke EEM from Python. For more information about Python, see the Cisco Nexus 9000 Series NX-OS Programmability Guide.

Default Settings for EEM

This table lists the default settings for EEM parameters.

Parameters Default
System policies Active

Configuring EEM

You can create policies that contain actions to take based on system policies. To display information about the system policies, use the show event manager system-policy command.

Defining an Environment Variable

You can define a variable to serve as a parameter in an EEM policy.

Procedure

  Command or Action Purpose

Step 1

configure terminal

Example:

switch# configure terminal
switch(config)#

Enters global configuration mode.

Step 2

event manager environment variable-name variable-value

Example:

switch(config)# event manager environment emailto “admin@anyplace.com”

Creates an environment variable for EEM. The variable-name can be any case-sensitive, alphanumeric string up to 29 characters. The variable-value can be any quoted alphanumeric string up to 39 characters.

Step 3

(Optional) show event manager environment {variable-name | all}

Example:

switch(config)# show event manager environment all
(Optional)

Displays information about the configured environment variables.

Step 4

(Optional) copy running-config startup-config

Example:

switch(config)# copy running-config startup-config
(Optional)

Copies the running configuration to the startup configuration.

Defining a User Policy Using the CLI

You can define a user policy using the CLI to the device.

Procedure

  Command or Action Purpose

Step 1

configure terminal

Example:

switch# configure terminal
switch(config)#

Enters global configuration mode.

Step 2

event manager applet applet-name

Example:

switch(config)# event manager applet monitorShutdown
switch(config-applet)#

Registers the applet with EEM and enters applet configuration mode. The applet-name can be any case-sensitive, alphanumeric string up to 29 characters.

Step 3

(Optional) description policy-description

Example:

switch(config-applet)# description “Monitors interface shutdown.”
(Optional)

Configures a descriptive string for the policy. The string can be any alphanumeric string up to 80 characters. Enclose the string in quotation marks.

Step 4

event event-statement

Example:

switch(config-applet)# event cli match “conf t ; interface * ; shutdown”

Configures the event statement for the policy. Repeat this step for multiple event statements. See Configuring Event Statements.

Step 5

(Optional) tag tag {and | andnot | or} tag [and | andnot | or {tag}] {happens occurs in seconds}

Example:

switch(config-applet)# tag one or two happens 1 in 10000
(Optional)

Correlates multiple events in the policy.

The range for the occurs argument is from 1 to 4294967295. The range for the seconds argument is from 0 to 4294967295 seconds.

Step 6

action number[.number2] action-statement

Example:

switch(config-applet)#action 1.0 cli show interface Ethernet 3/1

Configures an action statement for the policy. Repeat this step for multiple action statements. See Configuring Action Statements.

Step 7

(Optional) show event manager policy-state name [module module-id]

Example:

switch(config-applet)# show event manager policy-state monitorShutdown
(Optional)

Displays information about the status of the configured policy.

Step 8

(Optional) copy running-config startup-config

Example:

switch(config)# copy running-config startup-config
(Optional)

Copies the running configuration to the startup configuration.

Configuring Event Statements

Use one of the following commands in applet configuration mode to configure an event statement:

Command

Purpose

event application [tag tag] sub-system sub-system-id type event-type

Example:

switch(config-applet)# event application
sub-system 798 type 1

Triggers an event when an event specification matches the subsystem ID and application event type.

The range for the sub-system-id and for the event-type is from 1 to 4294967295.

The tag tag keyword-argument pair identifies this specific event when multiple events are included in the policy.

Note

 
To use this command, you must first enable the feature evmed command to enable generic event detectors.
event cli [tag tag] match expression [count repeats | time seconds]

Example:

switch(config-applet)# event cli match “conf t ; interface * ; shutdown”

Triggers an event if you enter a command that matches the regular expression.

The tag tag keyword-argument pair identifies this specific event when multiple events are included in the policy.

The repeats range is from 1 to 65000. The time range, in seconds, is from 0 to 4294967295, where 0 indicates no time limit.

event counter [tag tag] name counter entry-val entry entry-op {eq | ge | gt | le | lt | ne} [exit-val exit exit-op {eq | ge | gt | le | lt | ne}]

Example:

switch(config-applet)# event counter name
mycounter entry-val 20 gt

Triggers an event if the counter crosses the entry threshold based on the entry operation. The event resets immediately. Optionally, you can configure the event to reset after the counter passes the exit threshold.

The tag tag keyword-argument pair identifies this specific event when multiple events are included in the policy.

The counter name can be any case-sensitive, alphanumeric string up to 28 characters. The entry and exit value ranges are from 0 to 2147483647.

event fanabsent [fan number] time seconds

Example:

switch(config-applet)# event fanabsent time
300

Triggers an event if a fan is removed from the device for more than the configured time, in seconds. The number range is module-dependent. The seconds range is from 10 to 64000.

event fanbad [fan number] time seconds

Example:

switch(config-applet)# event fanbad time
3000

Triggers an event if a fan fails for more than the configured time, in seconds. The number range is module-dependent. The seconds range is from 10 to 64000.

event fib {adjacency extra | resource tcam usage | route {extra | inconsistent | missing}}

Example:

switch(config-applet)# event fib adjacency
extra

Triggers an event for one of the following:

  • adjacency extra—If there is an extra route in the unicast FIB.

  • resource tcam usage—Each time the TCAM utilization percentage becomes a multiple of 5, in either direction.

  • route {extra | inconsistent | missing} —If a route is added, changed, or deleted in the unicast FIB.

event gold module {slot | all} test test-name [severity {major | minor | moderate}] testing-type {bootup | monitoring | ondemand | scheduled} consecutive-failure count

Example:

switch(config-applet)# event gold module 2
test ASICRegisterCheck testing-type
ondemand consecutive-failure 2

Triggers an event if the named online diagnostic test experiences the configured failure severity for the configured number of consecutive failures. The slot range is from 1 to 10. The test-name is the name of a configured online diagnostic test. The count range is from 1 to 1000.

event interface [tag tag] {name interface slot/port parameter}

Example:

switch(config-applet)# event interface
ethernet 2/2 parameter

Triggers an event if the counter is exceeded for the specified interface.

The tag tag keyword-argument pair identifies this specific event when multiple events are included in the policy.

Note

 
To use this command, you must first enable the feature evmed command to enable generic event detectors.
event memory {critical | minor | severe}

Example:

switch(config-applet)# event memory
critical

Triggers an event if a memory threshold is crossed. See also Configuring Memory Thresholds.

event module [tag tag] status {online | offline | any} module {all | module-num}

Example:

switch(config-applet)# event module status
offline module all

Triggers an event if the specified module enters the selected status.

The tag tag keyword-argument pair identifies this specific event when multiple events are included in the policy.

event module-failure [tag tag] type failure-type module {slot | all} count repeats [time seconds]

Example:

switch(config-applet)# event module-failure
type lc-failed module 3 count 1

Triggers an event if a module experiences the failure type configured.

The tag tag keyword-argument pair identifies this specific event when multiple events are included in the policy.

The repeats range is from 0 to 4294967295. The seconds range is from 0 to 4294967295, where 0 indicates no time limit.

event none

Example:

switch(config-applet)# event none

Manually runs the policy event without any events specified.

Note

 
To use this command, you must first enable the feature evmed command to enable generic event detectors.
event oir [tag tag] {fan | module | powersupply} {anyoir | insert | remove} [number]

Example:

switch(config-applet)# event oir fan remove
4

Triggers an event if the configured device element (fan, module, or power supply) is inserted or removed from the device.

The tag tag keyword-argument pair identifies this specific event when multiple events are included in the policy.

You can optionally configure a specific fan, module, or power supply number. The number range is as follows:

  • Fan number—Module dependent.

  • Module number—Device dependent.

  • Power supply number—The range is from 1 to 3.

event policy-default count repeats [time seconds]

Example:

switch(config-applet)# event policy-default
count 3

Uses the event configured in the system policy. Use this option for overriding policies.

The repeats range is from 1 to 65000. The seconds range is from 0 to 4294967295, where 0 indicates no time limit.

event poweroverbudget

Example:

switch(config-applet)# event
poweroverbudget

Triggers an event if the power budget exceeds the capacity of the configured power supplies.

event snmp [tag tag] oid oid get-type {exact | next} entry-op {eq | ge | gt | le | lt | ne} entry-val entry [exit-comb {and | or}] exit-op {eq | ge | gt | le | lt | ne} exit-val exit exit-time time polling-interval interval

Example:

switch(config-applet)# event snmp oid
1.3.6.1.2.1.31.1.1.1.6 get-type next
entry-op lt 300 entry-val 0 exit-op eq 400
exit-time 30 polling-interval 300

Triggers an event if the SNMP OID crosses the entry threshold based on the entry operation. The event resets immediately, or optionally you can configure the event to reset after the counter passes the exit threshold. The OID is in dotted decimal notation.

The tag tag keyword-argument pair identifies this specific event when multiple events are included in the policy.

The entry and exit value ranges are from 0 to 18446744073709551615. The time, in seconds, is from 0 to 2147483647. The interval, in seconds, is from 1 to 2147483647.

event storm-control

Example:

switch(config-applet)# event storm-control

Triggers an event if traffic on a port exceeds the configured storm control threshold.

event syslog [occurs count] {pattern string | period time | priority level | tag tag}

Example:

switch(config-applet)# event syslog period
500

Triggers an event if the specified syslog threshold is exceeded. The range for the count is from 1 to 65000, and the range for the time is from 1 to 4294967295. The priority range is from 0 to 7.

The tag tag keyword-argument pair identifies this specific event when multiple events are included in the policy.

event sysmgr memory [module module-num] major major-percent minor minor-percent clear clear-percent

Example:

switch(config-applet)# event sysmgr memory
minor 80

Triggers an event if the specified system manager memory threshold is exceeded. The range for the percentage is from 1 to 99.

event sysmgr switchover count count time interval

Example:

switch(config-applet)# event sysmgr
switchover count 10 time 1000

Triggers an event if the specified switchover count is exceeded within the time interval specified. The switchover count is from 1 to 65000. The time interval is from 0 to 2147483647.

event temperature [module slot] [sensor-number] threshold {any | major | minor}

Example:

switch(config-applet)# event temperature
module 2 threshold any

Triggers an event if the temperature sensor exceeds the configured threshold. The sensor range is from 1 to 18.

event timer {absolute time time name name | countdown time time name name | cron cronentry string | tag tag | watchdog time time name name}

Example:

switch(config-applet)# event timer absolute
time 100 name abtimer

Triggers an event if the specified time is reached. The range for the time is from 1 to 4294967295.

  • absolute time—Triggers an event when the specified absolute time of day occurs.

  • countdown time—Triggers an event when when the specified time counts down to zero. The timer does not reset.

  • cron cronentry—Triggers an event when the CRON string specification matches the current time.

  • watchdog time—Triggers an event when the specified time counts down to zero. The timer automatically resets to the initial value and continues to count down.

The tag tag keyword-argument pair identifies this specific event when multiple events are included in the policy.

Note

 
To use this command, you must first enable the feature evmed command to enable generic event detectors.
event track [tag tag] object-number state {any | down | up}

Example:

switch(config-applet)# event track 1 state
down

Triggers an event if the tracked object is in the configured state.

The tag tag keyword-argument pair identifies this specific event when multiple events are included in the policy.

The object-number range is from 1 to 500.

Configuring Action Statements

Use the following commands in EEM configuration mode to configure action statements:

Command

Purpose

action number[.number2] cli command1 [command2...] [local]

Example:

switch(config-applet)# action 1.0 cli
show interface Ethernet 3/1

Runs the configured CLI commands. You can optionally run the commands on the module where the event occurred. The action label is in the format number1.number2.

number can be any number up to 16 digits. The range for number2 is from 0 to 9.

action number[.number2] counter name counter value val op {dec | inc | nop | set}

Example:

switch(config-applet)# action 2.0 counter
name mycounter value 20 op inc

Modifies the counter by the configured value and operation. The action label is in the format number1.number2.

number can be any number up to 16 digits. The range for number2 is from 0 to 9.

The counter name can be any case-sensitive, alphanumeric string up to 28 characters. The val can be an integer from 0 to 2147483647 or a substituted parameter.

action number[.number2] event-default

Example:

switch(config-applet)# action 1.0 event-default

Executes the default action for the associated event. The action label is in the format number1.number2.

number can be any number up to 16 digits. The range for number2 is from 0 to 9.

action number[.number2] forceshut [module slot | xbar xbar-number] reset-reason seconds

Example:

switch(config-applet)# action 1.0 forceshut 
module 2 reset-reason “flapping links”

Forces a module, crossbar, or the entire system to shut down. The action label is in the format number1.number2.

number can be any number up to 16 digits. The range for number2 is from 0 to 9.

The reset reason is a quoted alphanumeric string up to 80 characters.

action number[.number2] overbudgetshut [module slot[-slot]]

Example:

switch(config-applet)# action 1.0
overbudgetshut module 3-5

Forces one or more modules or the entire system to shut down because of a power overbudget issue.

number can be any number up to 16 digits. The range for number2 is from 0 to 9.

action number[.number2] policy-default

Example:

switch(config-applet)# action 1.0 policy-default

Executes the default action for the policy that you are overriding. The action label is in the format number1.number2.

number can be any number up to 16 digits. The range for number2 is from 0 to 9.

action number[.number2] publish-event

Example:

switch(config-applet)# action 1.0 publish-event

Forces the publication of an application-specific event. The action label is in the format number1.number2.

number can be any number up to 16 digits. The range for number2 is from 0 to 9.

action number[.number2] reload [module slot[-slot]]

Example:

switch(config-applet)# action 1.0 reload
module 3-5

Forces one or more modules or the entire system to reload.

number can be any number up to 16 digits. The range for number2 is from 0 to 9.

action number[.number2] snmp-trap {[intdata1 data [intdata2 data]] [strdata string]}

Example:

switch(config-applet)# action 1.0 snmp-trap
strdata “temperature problem”

Sends an SNMP trap with the configured data. number can be any number up to 16 digits. The range for number2 is from 0 to 9.

The data arguments can by any number up to 80 digits. The string can be any alphanumeric string up to 80 characters.

action number[.number2] syslog [priority prio-val] msg error-message

Example:

switch(config-applet)# action 1.0 syslog
priority notifications msg “cpu high”

Sends a customized syslog message at the configured priority. number can be any number up to 16 digits. The range for number2 is from 0 to 9.

The error-message can be any quoted alphanumeric string up to 80 characters.


Note


If you want to allow the triggered event to process any default actions, you must configure the EEM policy to allow the default action. For example, if you match a CLI command in a match statement, you must add the event-default action statement to the EEM policy or EEM will not allow the CLI command to execute. You can use the terminal event-manager bypass command to allow all EEM policies with CLI matches to execute the CLI command.

Defining a Policy Using a VSH Script

You can define a policy using a VSH script.

Before you begin

Ensure that you are logged in with administrator privileges.

Ensure that your script name is the same name as the script filename.

Procedure


Step 1

In a text editor, list the commands that define the policy.

Step 2

Name the text file and save it.

Step 3

Copy the file to the following system directory: bootflash://eem/user_script_policies.


Registering and Activating a VSH Script Policy

You can register and activate a policy defined in a VSH script.

Procedure

  Command or Action Purpose

Step 1

configure terminal

Example:

switch# configure terminal
switch(config)#

Enters global configuration mode.

Step 2

event manager policy policy-script

Example:

switch(config)# event manager policy moduleScript

Registers and activates an EEM script policy. The policy-script can be any case-sensitive alphanumeric string up to 29 characters.

Step 3

(Optional) copy running-config startup-config

Example:

switch(config)# copy running-config startup-config
(Optional)

Copies the running configuration to the startup configuration.

Overriding a Policy

You can override a system policy.

Procedure

  Command or Action Purpose

Step 1

configure terminal

Example:

switch# configure terminal
switch(config)#

Enters global configuration mode.

Step 2

(Optional) show event manager policy-state system-policy

Example:

switch(config-applet)# show event manager policy-state __ethpm_link_flap 
Policy __ethpm_link_flap
Cfg count : 5
Cfg time interval : 10.000000 (seconds)
Hash default, Count 0
(Optional)

Displays information about the system policy that you want to override, including thresholds. Use the show event manager system-policy command to find the system policy names. For information about system policies, see Embedded Event Manager System Events and Configuration Examples.

Step 3

event manager applet applet-name override system-policy

Example:

switch(config)# event manager applet ethport override __ethpm_link_flap
switch(config-applet)#

Overrides a system policy and enters applet configuration mode. The applet-name can be any case-sensitive alphanumeric string up to 29 characters. The system-policy must be one of the existing system policies.

Step 4

(Optional) description policy-description

Example:

description “Overrides link flap policy.”
(Optional)

Configures a descriptive string for the policy. The string can be any alphanumeric string up to 80 characters. Enclose the string in quotation marks.

Step 5

[no] event event-statement

Example:

switch(config-applet)# event policy-default count 2 time 1000

Configures the event statement for the policy.

The no form of this command removes the configuration.

Step 6

action number action-statement

Example:

switch(config-applet)# action 1.0 syslog priority warnings msg “Link is flapping.”

Configures an action statement for the policy.

Repeat this step for multiple action statements.

Step 7

(Optional) show event manager policy-state name

Example:

switch(config-applet)# show event manager policy-state ethport
(Optional)

Displays information about the configured policy.

Step 8

(Optional) copy running-config startup-config

Example:

switch(config)# copy running-config startup-config
(Optional)

Copies the running configuration to the startup configuration.

Configuring Memory Thresholds

You can set the memory thresholds that are used to trigger events and set whether the operating system should kill processes if it cannot allocate memory.

Before you begin

Ensure that you are logged in with administrator privileges.

Procedure

  Command or Action Purpose

Step 1

configure terminal

Example:

switch# configure terminal
switch(config)#

Enters global configuration mode.

Step 2

system memory-thresholds minor minor severe severe critical critical

Example:

switch(config)# system memory-thresholds minor 60 severe 70 critical 80

Configures the system memory thresholds that generate EEM memory events. The default values are as follows:

  • Minor-85

  • Severe-90

  • Critical-95

When these memory thresholds are exceeded, the system generates the following syslogs:

  • 2013 May 7 17:06:30 switch %$ %PLATFORM-2-MEMORY_ALERT: Memory Status Alert : MINOR

  • 2013 May 7 17:06:30 switch %$ %PLATFORM-2-MEMORY_ALERT: Memory Status Alert : SEVERE

  • 2013 May 7 17:06:30 switch %$ %PLATFORM-2-MEMORY_ALERT: Memory Status Alert : CRITICAL

  • 2013 May 7 17:06:35 switch %$ %PLATFORM-2-MEMORY_ALERT: Memory Status Alert : MINOR ALERT RECOVERED

  • 2013 May 7 17:06:35 switch %$ %PLATFORM-2-MEMORY_ALERT: Memory Status Alert : SEVERE ALERT RECOVERED

  • 2013 May 7 17:06:35 switch %$ %PLATFORM-2-MEMORY_ALERT: Memory Status Alert : CRITICAL ALERT RECOVERED

Step 3

(Optional) system memory-thresholds threshold critical no-process-kill

Example:

switch(config)# system memory-thresholds threshold critical no-process-kill
(Optional)

Configures the system to not kill processes when the memory cannot be allocated. The default value is to allow the system to kill processes, starting with the one that consumes the most memory.

Step 4

(Optional) show running-config | include "system memory"

Example:

switch(config-applet)# show running-config | include “system memory”
(Optional)

Displays information about the system memory configuration.

Step 5

(Optional) copy running-config startup-config

Example:

switch(config)# copy running-config startup-config
(Optional)

Copies the running configuration to the startup configuration.

Configuring Syslog as EEM Publisher

You can monitor syslog messages from the switch.


Note


The maximum number of searchable strings to monitor syslog messages is 10.

Before you begin

EEM should be available for registration by syslog.

The syslog daemon must be configured and executed.

Procedure

  Command or Action Purpose

Step 1

configure terminal

Example:

switch# configure terminal
switch(config)#

Enters global configuration mode.

Step 2

event manager applet applet-name

Example:

switch(config)# event manager applet abc
switch(config-applet)#

Registers an applet with EEM and enters applet configuration mode.

Step 3

event syslog [tag tag] {occurs number | period seconds | pattern msg-text | priority priority}

Example:

switch(config-applet)# event syslog occurs 10

Monitors syslog messages and invokes the policy based on the search string in the policy.

  • The tag tag keyword-argument pair identifies this specific event when multiple events are included in the policy.

  • The occurs number keyword-argument pair specifies the number of occurrences. The range is from 1 to 65000.

  • The period seconds keyword-argument pair specifies the interval during which the event occurs. The range is from 1 to 4294967295.

  • The pattern msg-text keyword-argument pair specifies the matching regular expression. The pattern can contain character text, an environment variable, or a combination of the two. If the string contains embedded blanks, it is enclosed in quotation marks.

  • The priority priority keyword-argument pair specifies the priority of the syslog messages. If this keyword is not selected, all syslog messages are set at the informational priority level.

Step 4

(Optional) copy running-config startup-config

Example:

switch(config)# copy running-config startup-config
(Optional)

Copies the running configuration to the startup configuration.

Verifying the EEM Configuration

To display EEM configuration information, perform one of the following tasks:

Command Purpose

show event manager environment [variable-name | all]

Displays information about the event manager environment variables.

show event manager event-types [event | all | module slot]

Displays information about the event manager event types.

show event manager history events [detail] [maximum num-events] [severity {catastrophic | minor | moderate | severe}]

Displays the history of events for all policies.

show event manager policy-state policy-name

Displays information about the policy state, including thresholds.

show event manager script system [policy-name | all]

Displays information about the script policies.

show event manager system-policy [all]

Displays information about the predefined system policies.

show running-config eem

Displays information about the running configuration for EEM.

show startup-config eem

Displays information about the startup configuration for EEM.

Configuration Examples for EEM

This example shows how to override the __lcm_module_failure system policy by changing the threshold for just module 3 hitless upgrade failures. This example also sends a syslog message. The settings in the system policy, __lcm_module_failure, apply in all other cases.

event manager applet example2 override __lcm_module_failure
event module-failure type hitless-upgrade-failure module 3 count 2
action 1 syslog priority errors msg module 3 “upgrade is not a hitless upgrade!”
action 2 policy-default

This example shows how to override the __ethpm_link_flap system policy and shuts down the interface:

event manager applet ethport override __ethpm_link_flap
event policy-default count 2 time 1000
action 1 cli conf t
action 2 cli int et1/1
action 3 cli no shut

This example creates an EEM policy that allows the CLI command to execute but triggers an SNMP notification when a user enters configuration mode on the device:

event manager applet TEST
event cli match "conf t"
action 1.0 snmp-trap strdata "Configuration change"
action 2.0 event-default


Note


You must add the event-default action statement to the EEM policy or EEM will not allow the CLI command to execute.

This example shows how to correlate multiple events in an EEM policy and execute the policy based on a combination of the event triggers. In this example, the EEM policy is triggered if one of the specified syslog patterns occurs within 120 seconds.

event manager applet eem-correlate
event syslog tag one pattern "copy bootflash:.* running-config.*”
event syslog tag two pattern “copy run start”
event syslog tag three pattern “hello”
tag one or two or three happens 1 in 120
action 1.0 reload module 1

Upon reaching a maximum failure threshold, the AsicMemory, FpgaRegTest, and L2ACLRedirect system policies force a reload of the switch. This example shows how to override the default action for one of these policies and issue a syslog instead:

event manager applet gold override __fpgareg
action 1 syslog priority emergencies msg FpgaRegTest_override

This example shows how to override a default policy but still enact the default action:

event manager applet gold_fpga_ovrd override __fpgareg
  action 1 policy-default
  action 2 syslog priority emergencies msg FpgaRegTest_override


Note


For additional EEM configuration examples, see Embedded Event Manager System Events and Configuration Examples.

Event Log Auto-Collection and Backup

Automatically collected event logs are stored locally on switch memory. Event log file storage is a temporary buffer that stores files for a fixed amount of time. Once the time period has elapsed, a roll-over of the buffer makes room for the next files. The roll-over uses a first-in-first-out method.

Beginning with Cisco NX-OS Release 9.3(3), EEM uses the following methods of collection and backup:

  • Extended Log File Retention

  • Trigger-Based Event Log Auto-Collection

Extended Log File Retention

Beginning with Cisco NX-OS release 9.3(3), all Cisco Nexus platform switches, with at least 8Gb of system memory, support the extended retention of event logging files. Storing the log files locally on the switch or remotely through an external container, reduces the loss of event logs due to rollover.

Enabling Extended Log File Retention For All Services

Extended Log File Retention is enabled by default for all services running on a switch. If the switch doesn't have the log file retention feature enabled (no bloggerd log-dump is configured), use the following procedure to enable it.

Procedure
  Command or Action Purpose

Step 1

configure terminal

Example:
switch# configure terminal
switch(config)#

Enters global configuration mode.

Step 2

bloggerd log-dump all

Example:
switch(config)# bloggerd log-dump all
switch(config)#

Enables the log file retention feature for all services.

Example
switch# configure terminal
switch(config)# bloggerd log-dump all
Sending Enable Request to Bloggerd
Bloggerd Log Dump Successfully enabled
switch(config)#

Disabling Extended Log File Retention For All Services

Extended Log File Retention is enabled by default for all services on the switch. If the switch has the log file retention feature enabled for all services and you want to disable it, use the following procedure.

Procedure
  Command or Action Purpose

Step 1

configure terminal

Example:
switch# configure terminal
switch(config)#

Enters global configuration mode.

Step 2

no bloggerd log-dump all

Example:
switch(config)# no bloggerd log-dump all
switch(config)#

Disables the log file retention feature for all services on the switch.

Example
switch# configure terminal
switch(config)# no bloggerd log-dump all
Sending Disable Request to Bloggerd
Bloggerd Log Dump Successfully disabled
switch(config)#

Enabling Extended Log File Retention For a Single Service

Extended Log File Retention is enabled by default for all services running on a switch. If the switch doesn't have the log file retention feature enabled (no bloggerd log-dump is configured), use the following procedure to enable it for a single service.

Procedure
  Command or Action Purpose

Step 1

show system internal sysmgr service name service-type

Example:
switch# show system internal sysmgr service name aclmgr

Displays information about the ACL Manager including the service SAP number.

Step 2

configure terminal

Example:
switch# configure terminal
switch(config)#

Enters global configuration mode.

Step 3

bloggerd log-dump sap number

Example:
switch(config)# bloggerd log-dump sap 351

Enables the log file retention feature for the ACL Manager service.

Step 4

show system internal bloggerd info log-dump-info

Example:

switch(config)# show system internal bloggerd info log-dump-info

Displays information about the log file retention feature on the switch.

Example
switch# show system internal sysmgr service name aclmgr
Service "aclmgr" ("aclmgr", 80):
        UUID = 0x182, PID = 653, SAP = 351
        State: SRV_STATE_HANDSHAKED (entered at time Mon Nov  4 11:10:41 2019).
        Restart count: 1
        Time of last restart: Mon Nov  4 11:10:39 2019.
        The service never crashed since the last reboot.
        Tag = N/A
        Plugin ID: 0
switch(config)# configure terminal
switch(config)# bloggerd log-dump sap 351
Sending Enable Request to Bloggerd
Bloggerd Log Dump Successfully enabled
switch(config)# show system internal bloggerd info log-dump-info 
-------------------------------------------------------------
Log Dump config is READY
Log Dump is DISABLED for ALL application services in the switch
Exceptions to the above rule (if any) are as follows: 
-------------------------------------------------------------
Module     | VDC        | SAP                       | Enabled?  
-------------------------------------------------------------
1          | 1          | 351 (MTS_SAP_ACLMGR     ) | Enabled  
-------------------------------------------------------------
-------------------------------------------------------------
Log Dump Throttle Switch-Wide Config:
-------------------------------------
Log Dump Throttle                                      : ENABLED
Minimum buffer rollover count (before throttling)      : 5
Maximum allowed rollover count per minute              : 1
-------------------------------------------------------------

switch(config)# 

Displaying Extended Log Files

Use this task to display the event log files currently stored on the switch.

Procedure
Command or Action Purpose

dir debug:log-dump/

Example:
switch# dir debug:log-dump/

Displays the event log files currently stored on the switch.

Example
switch# dir debug:log-dump/

3676160 Dec 05 02:43:01 2019 20191205023755_evtlog_archive.tar
3553280 Dec 05 06:05:06 2019 20191205060005_evtlog_archive.tar

Usage for debug://sup-local
913408 bytes used
4329472 bytes free
5242880 bytes total

Disabling Extended Log File Retention For a Single Service

Extended Log File Retention is enabled by default for all services on the switch. If the switch has the log file retention feature enabled for a single service or all services (by default in Cisco NX-OS Release 9.3(5)), and you want to disable a specific service or services, use the following procedure.

Procedure
  Command or Action Purpose

Step 1

show system internal sysmgr service name service-type

Example:
switch# show system internal sysmgr service name aclmgr

Displays information about the ACL Manager including the service SAP number.

Step 2

configure terminal

Example:
switch# configure terminal
switch(config)#

Enters global configuration mode.

Step 3

no bloggerd log-dump sap number

Example:
switch(config)# no bloggerd log-dump sap 351

Disables the log file retention feature for the ACL Manager service.

Step 4

show system internal bloggerd info log-dump-info

Example:

switch(config)# show system internal bloggerd info log-dump-info

Displays information about the log file retention feature on the switch.

Example

The following example shows how to disable extended log file retention for a service named "aclmgr":

switch# show system internal sysmgr service name aclmgr
Service "aclmgr" ("aclmgr", 80):
        UUID = 0x182, PID = 653, SAP = 351
        State: SRV_STATE_HANDSHAKED (entered at time Mon Nov  4 11:10:41 2019).
        Restart count: 1
        Time of last restart: Mon Nov  4 11:10:39 2019.
        The service never crashed since the last reboot.
        Tag = N/A
        Plugin ID: 0
switch(config)# configure terminal
switch(config)# no bloggerd log-dump sap 351
Sending Disable Request to Bloggerd
Bloggerd Log Dump Successfully disabled
switch(config)# show system internal bloggerd info log-dump-info 
-------------------------------------------------------------
Log Dump config is READY
Log Dump is DISABLED for ALL application services in the switch
Exceptions to the above rule (if any) are as follows: 
-------------------------------------------------------------
Module     | VDC        | SAP                       | Enabled?  
-------------------------------------------------------------
1          | 1          | 351 (MTS_SAP_ACLMGR     ) | Disabled  
-------------------------------------------------------------
-------------------------------------------------------------
Log Dump Throttle Switch-Wide Config:
-------------------------------------
Log Dump Throttle                                      : ENABLED
Minimum buffer rollover count (before throttling)      : 5
Maximum allowed rollover count per minute              : 1
-------------------------------------------------------------

switch(config)# 

Trigger-Based Event Log Auto-Collection

Trigger-based log collection capabilities:

  • Automatically collect relevant data when issues occur.

  • No impact on control plane

  • Customizable configuration:

    • Defaults populated by Cisco

    • Selectively override what-to-collect by network administrator or by Cisco TAC.

    • Automatically update new triggers on image upgrades.

  • Store logs locally on the switch or remotely on an external server.

  • Supports severity 0, 1, and 2 syslogs

  • Custom syslogs for ad-hoc events (auto-collection commands attached to the syslogs)

Enabling Trigger-Based Log File Auto-Collection

To enable trigger-based automatic creation of log files, you must create an override policy for the __syslog_trigger_default system policy with a custom YAML file and define the specific logs for which information will be collected.

For more information on creating a custom YAML file to enable log file auto-collection, see Configuring the Auto-Collection YAML File.

Auto-Collection YAML File

The Auto-Collection YAML file that is specified in the action command in the EEM function, defines actions for different system or feature components. This file is located in the switch directory: /bootflash/scripts. In addition to the default YAML file, you can create component-specific YAML files and place them in the same directory. The naming convention for component-specific YAML files is component-name.yaml. If a component-specific file is present in the same directory, it takes precedence over the file that is specified in the action command. For example, if the action file, bootflash/scripts/platform.yaml is in the /bootflash/scripts directory with the default action file, bootflash/scripts/test.yaml, then the instructions defined in platform.yaml file take precedence over the instructions for the platform component present in the default test.yaml file.

Examples of components are, ARP, BGP, IS-IS, and so on. If you are not familiar with all the component names, contact Cisco Customer Support for assistance in defining the YAML file for component-specific actions (and for the default test.yaml file as well).

Example:

event manager applet test_1 override __syslog_trigger_default
  action 1.0 collect test.yaml $_syslog_msg
Configuring the Auto-Collection YAML File

The contents of a YAML file determines the data collected during trigger-based auto-collection. There must be only one YAML file on the switch but it can contain auto-collection meta-data for any number of switch components and messages.

Locate the YAML file in the following directory on the switch:

/bootflash/scripts

Invoke the YAML file for trigger-based collection by using the following example. The example shows the minimum required configuration for trigger-based collection to work with a user-defined YAML file.

switch# show running-config eem
!Command: show running-config eem
!Running configuration last done at: Mon Sep 30 19:34:54 2019
!Time: Mon Sep 30 22:24:55 2019
version 9.3(3) Bios:version 07.59
event manager applet test_1 override __syslog_trigger_default
  action 1.0 collect test.yaml $_syslog_msg

In the preceding example, "test_1" is the name of the applet and "test.yaml" is the name of the user-configured YAML file present in the /bootflash/scripts directory.

Example YAML File

The following is an example of a basic YAML file supporting the trigger-based event log auto-collection feature. The definitions for the keys/values in the file are in the table that follows.


Note


Make sure that the YAML file has proper indentation. As a best practice, run it through any "online YAML validator" before using it on a switch.


bash-4.3$ cat /bootflash/scripts/test.yaml
version: 1
components:
   securityd:
        default:
            tech-sup: port
            commands: show module
   platform:
        default:
            tech-sup: port
            commands: show module

Key: Value

Description

version: 1

Set to 1. Any other number creates an incompatibility for the auto collect script.

components:

Keyword specifying that what follows are switch components.

securityd:

Name of the syslog component (securityd is a facility name in syslog).

default:

Identifies all messages belonging to the component.

tech-sup: port

Collect tech support of the port module for the securityd syslog component.

commands: show module

Collect show module command output for the securityd syslog component.

platform:

Name of the syslog component (platform is a facility name in syslog).

tech-sup: port

Collect tech support of the port module for the platform syslog component.

commands: show module

Collect show module command output for the platform syslog component.

Use the following example to associate auto-collect metadata only for a specific log. For example, SECURITYD-2-FEATURE_ENABLE_DISABLE

securityd:
                feature_enable_disable:
                        tech-sup: security
                        commands: show module

Key: Value

Description

securityd:

Name of the syslog component (securityd is a facility name in syslog).

feature_enable_disable:

Message ID of the syslog message.

tech-sup: security

Collect tech support of the security module for the securityd syslog component.

commands: show module

Collect show module command output for the security syslog component.

Example syslog output for the above YAML entry:

2019 Dec 4 12:41:01 n9k-c93108tc-fx %SECURITYD-2-FEATURE_ENABLE_DISABLE: User 
has enabled the feature bash-shell

Use the following example to specify multiple values.

version: 1
components:
   securityd:
        default:
            commands: show module;show version;show module
            tech-sup: port;lldp

Note


Use semicolons to separate multiple show commands and tech support key values (see the preceding example).


Limiting the Amount of Auto-Collections Per Component

For auto-collection, the limit of the number of bundles per component event is set to three (3) by default. If more than the default events occur for a component, then the events are dropped with the status message EVENTLOGLIMITREACHED. The auto-collection of the component event restarts when the event log has rolled over.

Example:

switch# show system internal event-logs auto-collect history 
DateTime              Snapshot ID  Syslog                   Status/Secs/Logsize(Bytes)
2020-Jun-27 07:20:03  1140276903   ACLMGR-0-TEST_SYSLOG     EVENTLOGLIMITREACHED
2020-Jun-27 07:15:14  1026359228   ACLMGR-0-TEST_SYSLOG     RATELIMITED
2020-Jun-27 07:15:09  384952880    ACLMGR-0-TEST_SYSLOG     RATELIMITED
2020-Jun-27 07:13:55  1679333688   ACLMGR-0-TEST_SYSLOG     PROCESSED:2:9332278
2020-Jun-27 07:13:52  1679333688   ACLMGR-0-TEST_SYSLOG     PROCESSING
2020-Jun-27 07:12:55  502545693    ACLMGR-0-TEST_SYSLOG     RATELIMITED
2020-Jun-27 07:12:25  1718497217   ACLMGR-0-TEST_SYSLOG     RATELIMITED
2020-Jun-27 07:08:25  1432687513   ACLMGR-0-TEST_SYSLOG     PROCESSED:2:10453823
2020-Jun-27 07:08:22  1432687513   ACLMGR-0-TEST_SYSLOG     PROCESSING
2020-Jun-27 07:06:16  90042807     ACLMGR-0-TEST_SYSLOG     RATELIMITED
2020-Jun-27 07:03:26  1737578642   ACLMGR-0-TEST_SYSLOG     RATELIMITED
2020-Jun-27 07:02:56  40101277     ACLMGR-0-TEST_SYSLOG     PROCESSED:3:10542045
2020-Jun-27 07:02:52  40101277     ACLMGR-0-TEST_SYSLOG     PROCESSING
 

Auto-Collection Log Files

About Auto-Collection Log Files

The configuration in a YAML file determines the contents of an auto-collected log file. You can't configure the amount of memory used for collected log files. You can configure the frequency of when the stored files get purged.

Autocollected log files get saved in the following directory:

switch# dir bootflash:eem_snapshots
   44205843    Sep 25 11:08:04 2019  1480625546_SECURITYD_2_FEATURE_ENABLE_DISABLE_eem_snapshot.tar.gz
  Usage for bootflash://sup-local
 6940545024 bytes used
44829761536 bytes free
51770306560 bytes total
Accessing the Log Files

Locate the logs by using the command keyword "debug":

switch# dir debug:///
...
       26    Oct 22 10:46:31 2019  log-dump
       24    Oct 22 10:46:31 2019  log-snapshot-auto
       26    Oct 22 10:46:31 2019  log-snapshot-user

The following table describes the log locations and the log types stored.

Location

Description

log-dump

This folder stores Event logs on log rollover.

log-snapshot-auto

This folder contains the auto-collected logs for syslog events 0, 1, 2.

log-snapshot-user

This folder stores the collected logs when you run the bloggerd log-snapshot <> command.

Use the following example to view the log files generated on log rollover:

switch# dir debug:log-dump/
debug:log-dump/20191022104656_evtlog_archive.tar
debug:log-dump/20191022111241_evtlog_archive.tar
debug:log-dump/20191022111841_evtlog_archive.tar
debug:log-dump/20191022112431_evtlog_archive.tar
debug:log-dump/20191022113042_evtlog_archive.tar
debug:log-dump/20191022113603_evtlog_archive.tar
Parsing the Log tar Files

Use the following example to parse the logs in the tar files:

switch# show system internal event-logs parse debug:log-dump/20191022104656_evtlog_archive.tar
--------LOGS:/tmp/BLOGGERD0.991453012199/tmp/1-191022104658-191022110741-device_test-M27-V1-I1:0-P884.gz--------
2019 Oct 22 11:07:41.597864 E_DEBUG Oct 22 11:07:41 2019(diag_test_start):Data Space Limits(bytes): Soft: -1  Ha rd: -1
2019 Oct 22 11:07:41.597857 E_DEBUG Oct 22 11:07:41 2019(diag_test_start):Stack Space Limits(bytes): Soft: 500000  Hard: 500000
2019 Oct 22 11:07:41.597850 E_DEBUG Oct 22 11:07:41 2019(diag_test_start):AS: 1005952076 -1
2019 Oct 22 11:07:41.597406 E_DEBUG Oct 22 11:07:41 2019(device_test_process_events):Sdwrap msg unknown
2019 Oct 22 11:07:41.597398 E_DEBUG Oct 22 11:07:41 2019(diag_test_start):Going back to select
2019 Oct 22 11:07:41.597395 E_DEBUG Oct 22 11:07:41 2019(nvram_test):TestNvram examine 27 blocks
2019 Oct 22 11:07:41.597371 E_DEBUG Oct 22 11:07:41 2019(diag_test_start):Parent: Thread created test index:4 thread_id:-707265728
2019 Oct 22 11:07:41.597333 E_DEBUG Oct 22 11:07:41 2019(diag_test_start):Node inserted
2019 Oct 22 11:07:41.597328 E_DEBUG Oct 22 11:07:41 2019(diag_test_start):The test index in diag is 4
2019 Oct 22 11:07:41.597322 E_DEBUG Oct 22 11:07:41 2019(diag_test_start):result severity level
2019 Oct 22 11:07:41.597316 E_DEBUG Oct 22 11:07:41 2019(diag_test_start):callhome alert level

The following table describes the additional keywords available for parsing the specific tar file:

Keyword

Description

component

Decode logs belonging to the component identified by process name.

from-datetime

Decode logs from a specific date and time in yy[mm[dd[HH[MM[SS]]]]] format.

instance

List of SDWRAP buffer instances to be decoded (comma separated).

module

Decode logs from modules such as SUP and LC (using module IDs).

to-datetime

Decode logs up to a specific date and time in yy[mm[dd[HH[MM[SS]]]]] format.

Copying Logs to a Different Location

Use the following example to copy logs to a different location such as a remote server:

switch# copy debug:log-dump/20191022104656_evtlog_archive.tar scp://<ip-adress>/nobackup/<user> vrf management  use-kstack 
Enter username: user@<ip-address>'s password: 
20191022104656_evtlog_archive.tar                                             100%  130KB 130.0KB/s   00:00    
Copy complete, now saving to disk (please wait)...
Copy complete.
Purging Auto-Collection Log Files

There are two types of generated trigger-based auto-collection logs: EventHistory and EventBundle.

Purge Logic for EventHistory Logs

For event history, purging occurs in the /var/sysmgr/srv_logs/xport folder. 250MB of partitioned RAM is mounted at /var/sysmgr/srv_logs directory.

If the /var/sysmgr/srv_logs memory usage is under 65% of the 250MB allocated, no files get purged. When the memory utilization reaches the 65% limit level, the oldest files get purged until there's enough memory available to continue saving new logs.

Purge Logic for EventBundle Logs

For event bundles, the purge logic occurs in the /bootflash/eem_snapshots folder. For storing the auto-collected snapshots, the EEM auto-collect script allocates 5% of the bootflash storage. The logs get purged once the 5% bootflash capacity is used.

When a new auto-collected log is available but there's no space to save it in bootflash (already at 5% capacity), the system checks the following:

  1. If there are existing auto-collected files that are more than 12 hours old, the system deletes the files and the new logs get copied.

  2. If the existing auto collected files are less than 12 hours old, the system discards the newly collected logs without saving them.

You can modify the 12-hour default purge time by using the following commands. The time specified in the command is in minutes.

switch(config)# event manager applet test override __syslog_trigger_default
switch(config-applet)# action 1.0 collect test.yaml purge-time 300 $_syslog_msg

event manager command: test is an example name for the policy. __syslog_trigger_default is the name of the system policy that you want to override. This name must begin with a double underscore ( __ ).

action command: 1.0 is an example number for the order in which the action is executed. collect indicates that data is collected using the YAML file. test.yaml is an example name of the YAML file. $_syslog_msg is the name of the component.


Note


At any given time, there can be only one trigger-based auto-collection event in progress. If another new log event is attempting to be stored when auto-collection is already occurring, the new log event is discarded.


By default, there's only one trigger-based bundle collected every five minutes (300 sec). This rate limiting is also configurable by the following commands. The time specified in the command is in seconds.

switch(config)# event manager applet test override __syslog_trigger_default
switch(config-applet)# action 1.0 collect test.yaml rate-limit 600 $_syslog_msg

event manager command: test is an example name for the policy. __syslog_trigger_default is an example name of the system policy to override. This name must begin with a double underscore ( __ ).

action command: 1.0 is an example number for the order in which the action is executed. collect indicates that data is collected using the YAML file. test.yaml is an example name of the YAML file. $_syslog_msg is the name of the component.

Auto-Collection Statistics and History

The following example shows trigger-based collection statistics:

switch# show system internal event-logs auto-collect statistics
---------------------EEM Auto Collection Statistics--------------------
Syslog Parse Successful :88 Syslog Parse Failure :0
Syslog Ratelimited :0 Rate Limit Check Failed :0
Syslog Dropped(Last Action In Prog) :53 Storage Limit Reached :0
User Yaml Action File Unavailable :0 User Yaml Parse Successful :35
User Yaml Parse Error :0 Sys Yaml Action File Unavailable :11
Sys Yaml Parse Successful :3 Sys Yaml Parse Error :0
Yaml Action Not Defined :0 Syslog Processing Initiated :24
Log Collection Failed :0 Tar Creation Error :0
Signal Interrupt :0 Script Exception :0
Syslog Processed Successfully :24 Logfiles Purged :0

The following example shows trigger-based collection history (the processed syslogs, process time, size of the data collected) obtained using a CLI command:

switch# show system internal event-logs auto-collect history
DateTime Snapshot ID Syslog Status/Secs/Logsize(Bytes)
2019-Dec-04 05:30:32 1310232084 VPC-0-TEST_SYSLOG PROCESSED:9:22312929
2019-Dec-04 05:30:22 1310232084 VPC-0-TEST_SYSLOG PROCESSING
2019-Dec-04 04:30:13 1618762270 ACLMGR-0-TEST_SYSLOG PROCESSED:173:33194665
2019-Dec-04 04:28:47 897805674 SYSLOG-1-SYSTEM_MSG DROPPED-LASTACTIONINPROG
2019-Dec-04 04:28:47 947981421 SYSLOG-1-SYSTEM_MSG DROPPED-LASTACTIONINPROG
2019-Dec-04 04:27:19 1618762270 ACLMGR-0-TEST_SYSLOG PROCESSING
2019-Dec-04 02:17:16 1957148102 CARDCLIENT-2-FPGA_BOOT_GOLDEN NOYAMLFILEFOUND

Verifying Trigger-Based Log Collection

Verify that the trigger-based log collection feature is enabled by entering the show event manager system-policy | i trigger command as in this example:

switch# show event manager system-policy | i trigger n 2
           Name : __syslog_trigger_default
    Description : Default policy for trigger based logging
    Overridable : Yes
     Event type : 0x2101

Checking Trigger-Based Log File Generation

You can check to see if the trigger-based auto-collection feature has generated any event log files. Enter one of the commands in the following examples:

switch# dir bootflash:eem_snapshots
9162547 Nov 12 22:33:15 2019 1006309316_SECURITYD_2_FEATURE_ENABLE_DISABLE_eem_snapshot.tar.gz

Usage for bootflash://sup-local
8911929344 bytes used
3555950592 bytes free
12467879936 bytes total
switch# dir debug:log-snapshot-auto/
63435992 Dec 03 06:28:52 2019 20191203062841_1394408030_PLATFORM_2_MOD_PWRDN_eem_snapshot.tar.gz

Usage for debug://sup-local
544768 bytes used
4698112 bytes free
5242880 bytes total

Local Log File Storage

Local log file storage capabilities:

  • Amount of local data storage time depends on the scale, and type, of deployment. For both modular and nonmodular switches, the storage time is from 15 minutes to several hours of data. To be able to collect relevant logs that span a longer period:

  • Compressed logs are stored in RAM.

  • 250MB memory is reserved for log file storage.

  • Log files are optimized in tar format (one file for every five minutes or 10MB, whichever occurs first).

  • Allow snap-shot collection.

Generating a Local Copy of Recent Log Files

Extended Log File Retention is enabled by default for all services running on a switch. Log files are stored locally on flash memory. Use the following procedure to generate a file of up to ten of the most recent event log files.

Procedure
Command or Action Purpose

bloggerd log-snapshot [ file-name ] [ bootflash: file-path | logflash: file-path | usb1: ] [ size file-size ] [ time minutes ]

Example:
switch# bloggerd log-snapshot snapshot1

Creates a snapshot bundle file of the last ten event logs stored on the switch. Default storage for this operation is logflash .

file-name : The filename of the generated snapshot log file bundle. Use a maximum of 64 characters for file-name .

Note


This variable is optional. If it is not configured, the system applies a timestamp and "_snapshot_bundle.tar" as the filename. Example:

20200605161704_snapshot_bundle.tar

bootflash: file-path : The file path where the snapshot log file bundle is being stored on the bootflash. Choose one of the following initial paths:

  • bootflash:///

  • bootflash://module-1/

  • bootflash://sup-1/

  • bootflash://sup-active/

  • bootflash://sup-local/

logflash: file-path : The file path where the snapshot log file bundle is being stored on the logflash. Choose one of the following initial paths:

  • logflash:///

  • logflash://module-1/

  • logflash://sup-1/

  • logflash://sup-active/

  • logflash://sup-local/

usb1: : The file path where the snapshot log file bundle is being stored on the USB device.

size file-size : The snapshot log file bundle based on size in megabytes (MB). Range is from 5MB through 250MB.

time minutes : The snapshot log file bundle based on the last x amount of time (minutes). Range is from 1 minute through 30 minutes.

Example
switch# bloggerd log-snapshot snapshot1
Snapshot generated at logflash:evt_log_snapshot/snapshot1_snapshot_bundle.tar Please cleanup once done.
switch#
switch# dir logflash:evt_log_snapshot
159098880 Dec 05 06:40:24 2019 snapshot1_snapshot_bundle.tar
159354880 Dec 05 06:40:40 2019 snapshot2_snapshot_bundle.tar

Usage for logflash://sup-local
759865344 bytes used
5697142784 bytes free
6457008128 bytes total

Display the same files using the command in this example:

switch# dir debug:log-snapshot-user/
159098880 Dec 05 06:40:24 2019 snapshot1_snapshot_bundle.tar
159354880 Dec 05 06:40:40 2019 snapshot2_snapshot_bundle.tar

Usage for debug://sup-local
929792 bytes used
4313088 bytes free
5242880 bytes total

Note


Note the filename at the end of the example. Each individual log file is also identified by the date and time it was generated.


External Log File Storage

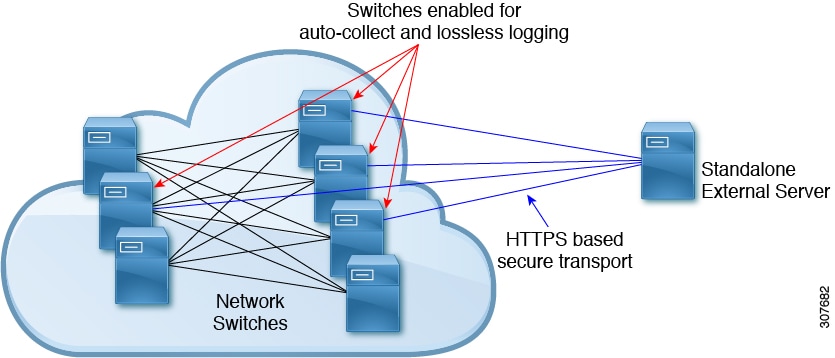
An external server solution provides the capability to store logs off-switch in a secure manner.


Note


To create the external storage capability, contact Cisco Technical Assistance Center(TAC) to help deploy the external server solution.


Te following are external log file storage capabilities:

  • Enabled on-demand

  • HTTPS-based transport

  • Storage requirements:

    • Nonmodular switches: 300MB

    • Modular switches: 12GB (per day, per switch)

  • An external server generally stores logs for 10 switches. However, there's no firm limit to the number of switches supported by an external server.

The external server solution has the following characteristics:

  • Controller-less environment

  • Manual management of security certificates

  • Three supported use-cases:

    • Continuous collection of logs from selected switches

    • TAC-assisted effort to deploy and upload logs to Cisco servers.

    • Limited on-premise processing


Note


Contact Cisco TAC for information regarding the setup and collection of log files in an external server.