Cisco Secure Workload User Guide SaaS, Release 3.9
Bias-Free Language
The documentation set for this product strives to use bias-free language. For the purposes of this documentation set, bias-free is defined as language that does not imply discrimination based on age, disability, gender, racial identity, ethnic identity, sexual orientation, socioeconomic status, and intersectionality. Exceptions may be present in the documentation due to language that is hardcoded in the user interfaces of the product software, language used based on RFP documentation, or language that is used by a referenced third-party product. Learn more about how Cisco is using Inclusive Language.
This chapter outlines the roles necessary for accessing monitoring options, emphasizing that Site Admins and Customer Support
can view detailed agent information, while scope owners can see inventory and agents. The document introduces the concept
of agent monitoring, detailing the types of agents available: Deep Visibility agents, which provide comprehensive flow data
and process visibility, and Policy agents, which add firewall rule enforcement capabilities. Additionally, it describes AnyConnect
and Identity Services Engine (ISE) agents, the latter of which leverages Cisco ISE for metadata collection and endpoint registration.
Transitioning to agent status and statistics, the chapter highlights the importance of monitoring agent health through various
charts, such as CPU and bandwidth overhead, to ensure optimal performance. It explains that the CPU and Bandwidth Overhead
charts offer insights into the resource utilization of Deep Visibility and Enforcement agents. Additionally, the Agent Health
chart is crucial for identifying active versus inactive agents, based on their regular check-ins with the configuration server.
Monitoring software updates and packet loss is emphasized, as these metrics indicate the agent's ability to upgrade and inspect
traffic efficiently.
The chapter also covers the visualization of software versions and operating systems across agents, aiding in understanding
the deployment landscape. Users must monitor enforcement status for cloud connectors, such as AWS or Azure, and provides steps
for addressing policy enforcement issues, therefore ensuring robust security and compliance across networked resources.
The Monitoring options available to you vary depending on your role.
Attention
Due to recent GUI updates, some of the images or screenshots used in the user guide may not fully reflect the current design
of the product. We recommend using this guide in conjunction with the latest version of the software for the most accurate
visual reference.
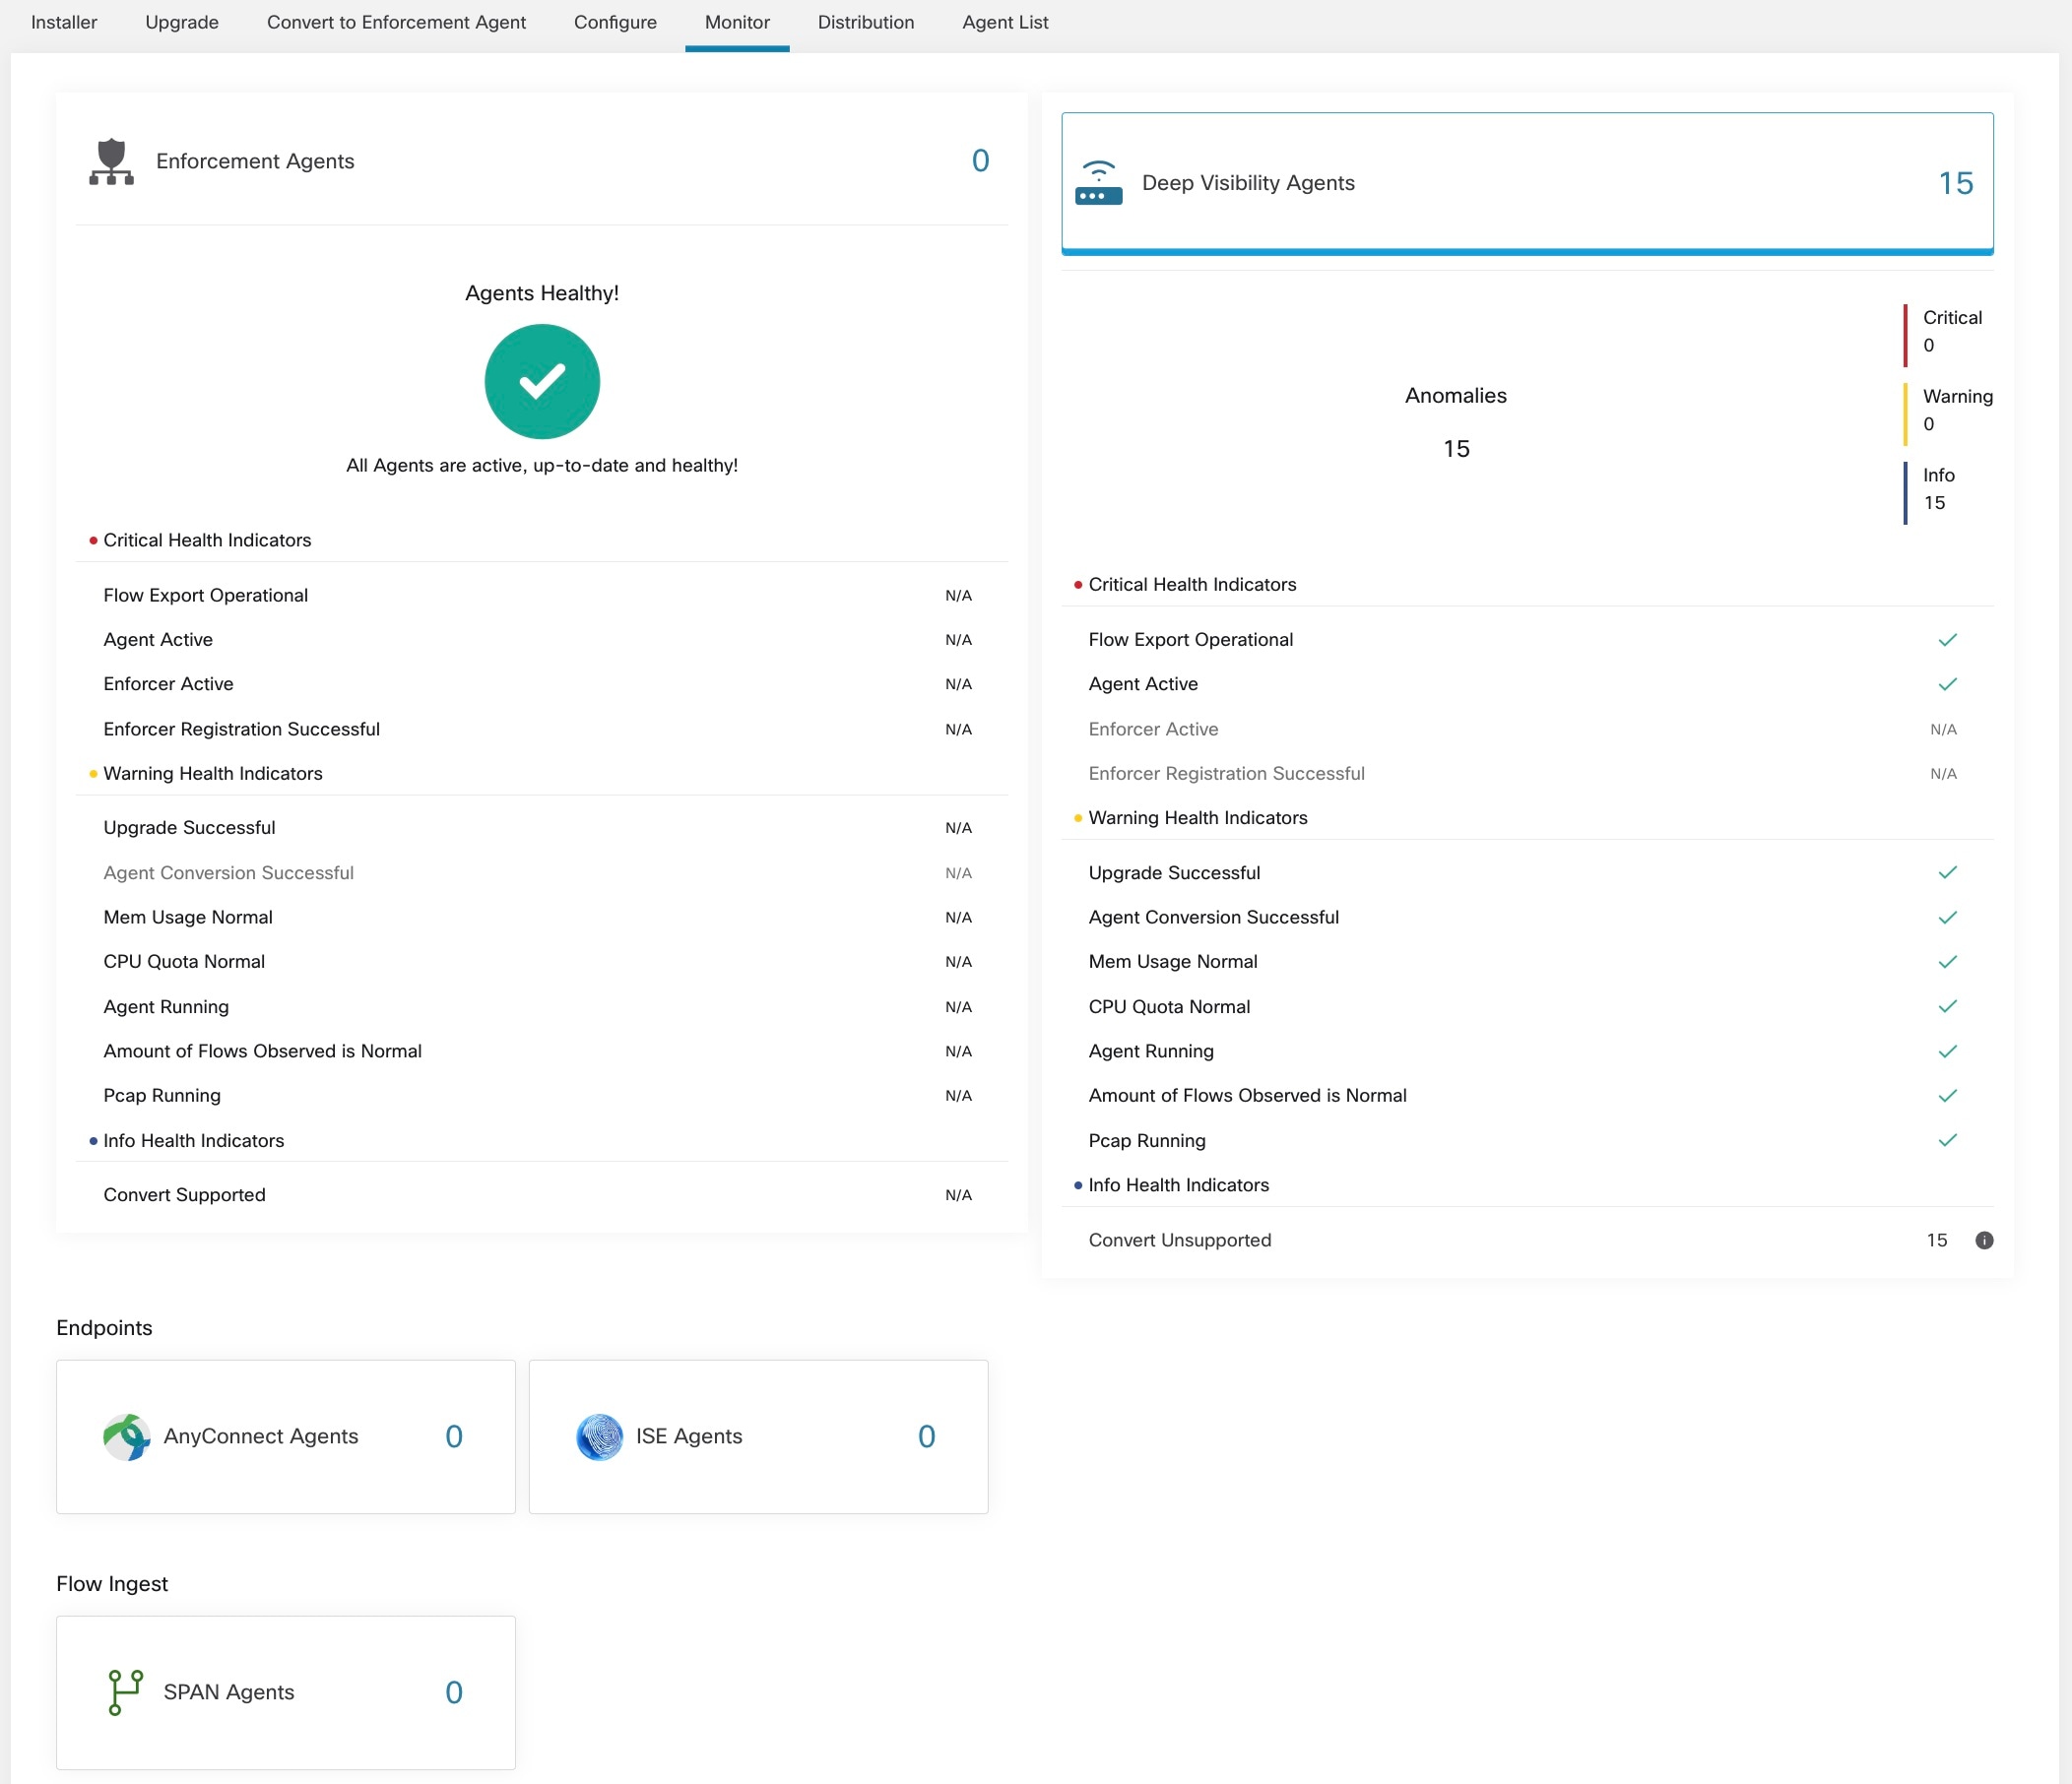
Agent Monitoring
The page displays the count of all monitored agents in a cluster based on the currently selected root scope.
Note
Total Inventory count is the summation of all inventory observed on the network after applying collection rules.
Agent Monitoring Type
To monitor agents, click Manage > Agents in the left navigation bar, then click the Monitor tab.
This page is only available for users that have Site Admin and Customer Support roles. Scope owners can see Inventory, Deep Visibility Agents, and Enforcement Agents.
Figure 1. Total Number of Installed Agents
The following table shows the differences between each agent type.
Agent Type
Description
Deep Visibility
Provides highest fidelity in terms of time series flow data, processes running on a host. Most Linux and Windows platforms
are supported. See sw_agents_deployment-label
Enforcement
Provides all capabilities available in Deep Visibility Agents. In addition, Enforcement agents are capable of setting firewall
rules on the installed host.
AnyConnect
Provides time series flow data on endpoints running AnyConnect Secure Mobility Agent with Network Visibility Module (NVM)
without requiring any Cisco Secure Workload agent installation. IPFIX records generated by NVM are sent to Secure Workload AnyConnect Proxy connector. Windows, Mac, and certain smartphone platforms are supported.
ISE
Provides metadata about endpoints registered with Cisco ISE. Through ISE pxGrid, ISE connector collects the metadata, registers
the ISE endpoints on Secure Workload as ISE agents pushes labels based on the attributes fetched from ISE appliance and LDAP attributes for the users logged in
to the endpoints.
The following table provides a brief summary of various appliance agents provided by Cisco Secure Workload.
Appliance Agents
Description
SPAN
Provides the flow analysis without requiring any per-host agent installation. It runs in the Secure Workload ERSPAN VM appliance. It consumes ERSPAN packets sourced by any Cisco switch.
Note
Appliance agents such as NetFlow, NetScaler, F5, AWS, and AnyConnect Proxy are now supported as connectors. For more information
on connectors, see What are Connectors.
Any non-zero agent type button allows further drill-down into the distribution of each agent type.
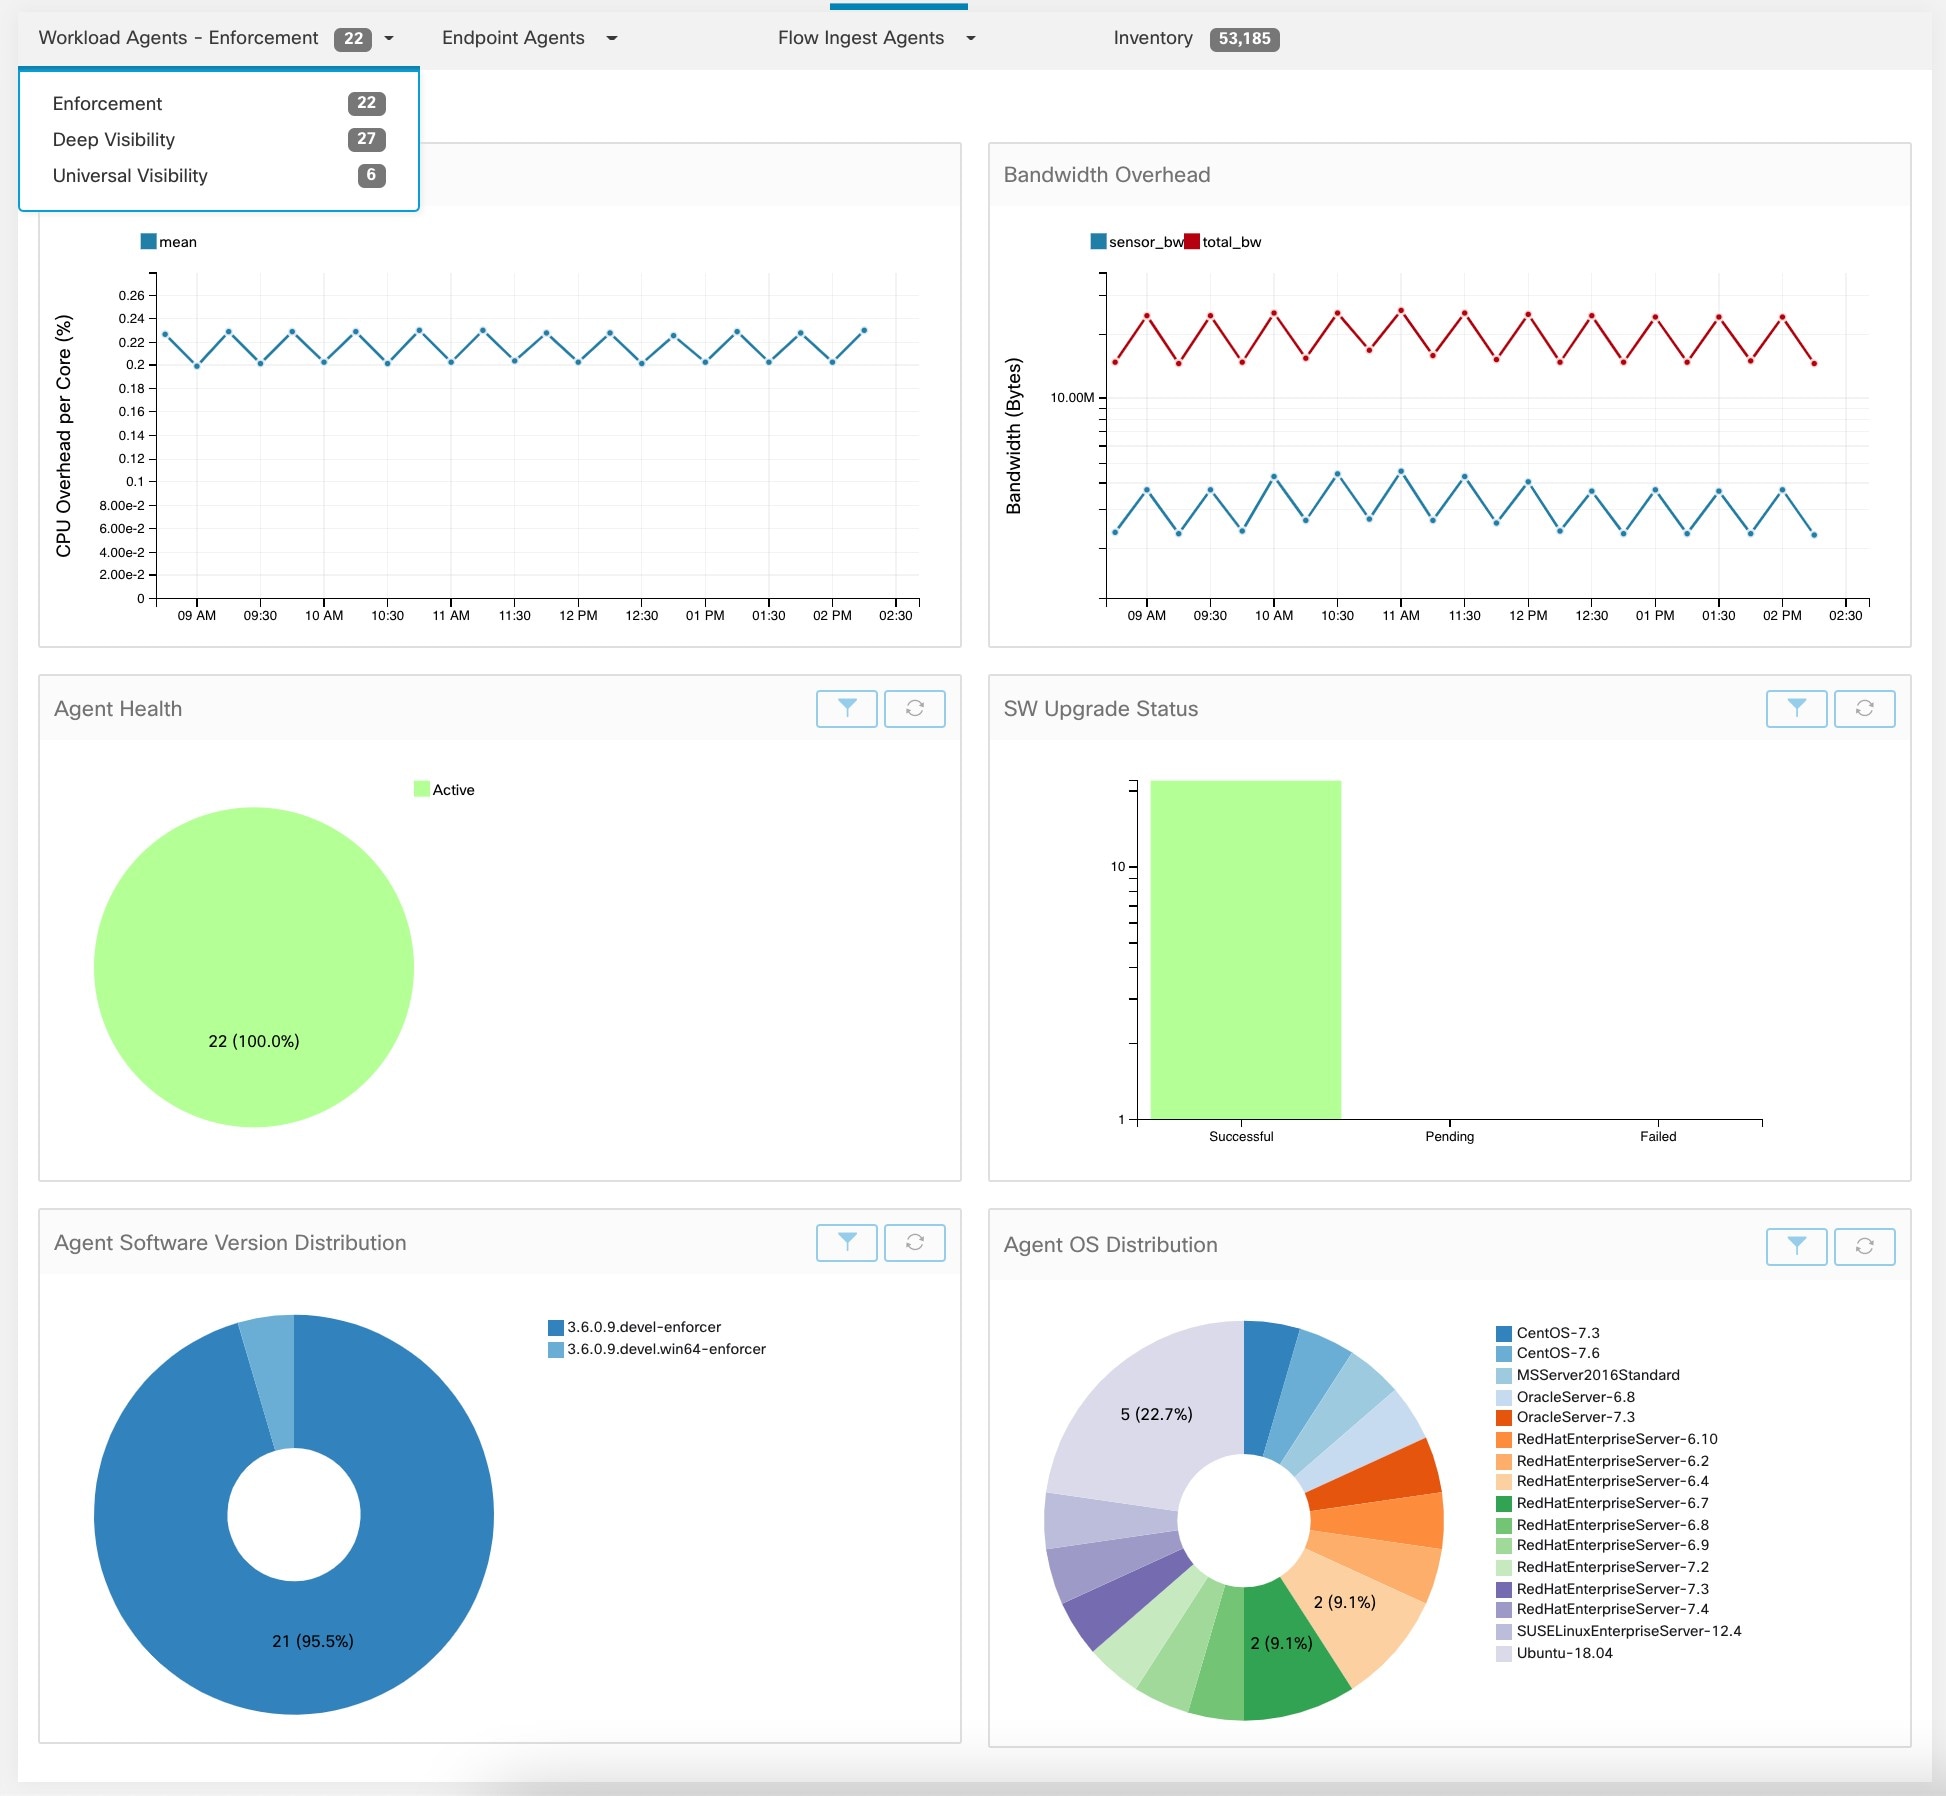
Agent Status and Statistics
To view the charts described in this topic, choose Manage > Agents, then click the Distribution tab.
The following charts are available for both Deep Visibility and Enforcement Agent types.
Figure 2. Agents Distribution
For each agent type, this page provides an overview and the health of registered agents including overall CPU overhead, bandwidth
overhead, missed packets, OS/version distribution and agent upgrade status.
CPU Overhead Chart
The CPU Overhead chart provides an aggregated view of CPU overhead per core from all agents. Per-agent CPU Overhead is provided
as part of the Workload Profile. This chart is only available for Deep Visibility and Enforcement Agent Types.
Bandwidth Overhead Chart
The Bandwidth Overhead chart provides aggregated stats of total bandwidth and bandwidth used by agents. Per-agent bandwidth
overhead is provided as part of the Workload Profile. This chart is only available for Deep Visibility and Enforcement Agent Types.
Agent Health Chart
The Agent Health chart provides the number of active or inactive agents. Active agents are the ones checking in with config
server for upgrade on regular intervals. The checking interval is 30 minutes. If we see that an agent has missed more than
two check-in periods from an agent, it would be declared as an inactive agent.
Software Agent Updates to Latest Revision Chart
Every time an agent checks in with the config server, the agent would also provide its current RPM version. If an agent is
configured to a specific version and is not able to update after 2 check-in periods, the agent would be declared as not able
to upgrade to the latest version.
Agent Packet Missed Chart
In rare occasions when the traffic volume traversing a host is greater than the rate at which the agent is able to inspect,
some packets are skipped from being analyzed. The number of missed packets and the corresponding agent name are displayed
in this chart.
Agent Software Version and OS Distribution Charts
These charts show the agent version distribution and parent OS platform of all agents registered with the Secure Workload cluster.
Enforcement Status
To view enforcement status, click Defend > Enforcement Status in the navigation bar at the left side of the window.
This page is available for site admin/customer support users and scope owners to get an overview of the current status of
all the enforcement agents, including the cloud connectors that are enforcing a policy.
If any of the charts shows red or orange, see the applicable topic:
This situation is generally temporary and typically doesn’t require any action. It occurs because a Secure Workload deployment based on labels updates inventory and policies dynamically.
However, if this situation persists for any individual workloads, contact Cisco TAC.
Agent Concrete Policies
Skipped
This indicates that policies weren’t pushed to some agents.
Tip
To view status for individual scopes or for the entire tenant, use the Filter by Scope option at the top-left side of the page.
If the charts indicate a problem, identify which workloads have the problem by clicking the relevant part of a chart.
The table displays the affected workloads.
Alternatively, to see filtering options, click the (i) button in the Filter box below the charts.
To view a wealth of additional details, click the IP address link in the filtered list of workloads to display the Workload
Profile page.
The following table describes the fields shown in the enforcement status table.
Field
Description
Host Name
Host name of the workload.
Address
IP addresses of all the interfaces on the workload.
Enforcement Enabled
Indicates whether enforcement is enabled or not on the agent.
Concrete Policies in Sync
This indicates whether the desired version of concrete policies are currently enforced on the agent.
Concrete Policies
If this value shows Skipped for any host, this means the limit on policies is reached for the agent on that host. (See Limits Related to Policies.)
Policy Count
The number of concrete policies on the agent.
Status
The status of the latest policy config enforcement. If the status is CONFIG_SUCCESS, it indicates that current version is enforced without any issue.
Enforcement Status for Cloud Connectors
If you have set up AWS or Azure cloud connectors:
All interfaces enforcement status are displayed on the enforcement status page. If the policies are applied successfully,
the policies are in sync else the corresponding error messages are displayed.
Policy count in the enforcement status page is Secure Workload accounting but not AWS or Azure rule accounting.
(AWS only) The hostname field on this page is derived from public DNS. If the public DNS is not enabled on the given VPC,
the hostname field is empty.
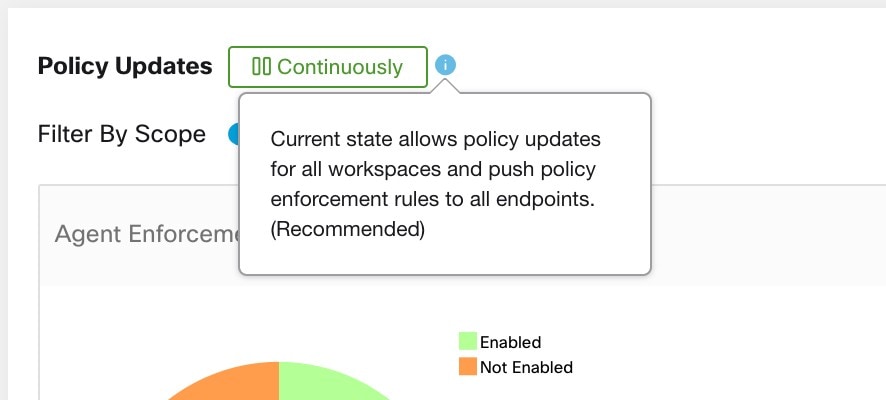
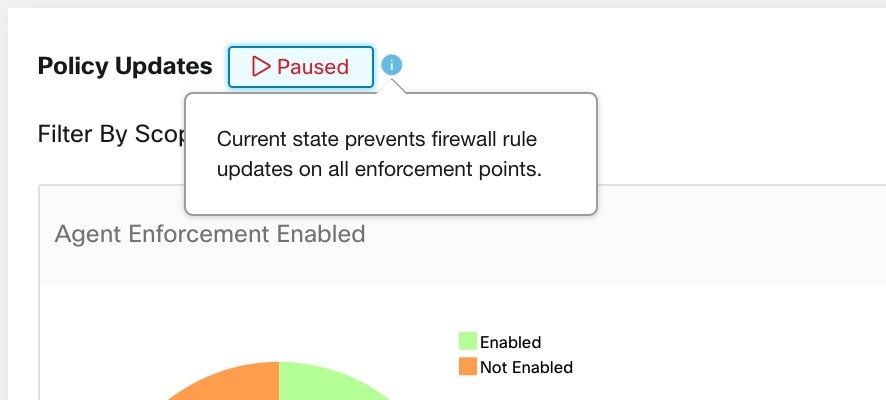
Pause Policy Updates
Caution
This option pauses policy updates for ALL workloads in ALL scopes.
This feature requires site admin or customer support privileges.
To pause rule updates for all enforcement endpoints in all scopes:
From the navigation pane, choose Defend > Enforcement.
Click the status beside Policy Updates.
Read and accept the caution.
Figure 3. Firewall Rules are being Updated Continuously
Figure 4. Firewall Rule Updates are Paused


 Feedback