Configure Alerts

This chapter focuses on configuring alerts within Secure Workload to enhance proactive security measures by notifying administrators of significant events and anomalies. It discusses how to configure and monitor forensic events within Secure Workload, providing insights into security incidents for thorough investigations. Customizing alert parameters based on organizational needs enhances the relevance and effectiveness of notifications.

Alerts in Secure Workload help you monitor workload security and respond to potential threats. The various components of alerts work together to provide visibility, alert sources and configuration, and the ability to send alerts from publishers. You can configure alerts, view alerts trigger rules, and choose publishers to send alerts. Alerts that are displayed on the configuration page vary depending on the user's role. Alert publishers can be either Alerts or Notifiers.


Attention


Due to recent GUI updates, some of the images or screenshots used in the user guide may not fully reflect the current design of the product. We recommend using this guide in conjunction with the latest version of the software for the most accurate visual reference.


Table 1. Feature Information

Feature Name

Release

Feature Description

Where to Find

Alert Enhancements

3.9

On the Investigate > Alerts page. Other enhancements include:

  • Introduction of Alert Name field: A new field, Alert Name, is introduced to facilitate a structured approach to alert management, allowing you to assign unique names to alerts.

  • Introduction of drop-down for Alert Type: A new drop-down, Alert Type, is introduced in the Alerts – Configs page to facilitate quick filtering.

  • Icon Update: The configuration of alerts can now be initiated by selecting the new + icon on the Alerts – Configs page.

Alert Configuration Modal

Multisearch capabilities with enhanced filtering options for alerts.

Current Alerts


Note


From the Secure Workload 3.0 release, the Secure WorkloadApp Store does not support alerts and compliance apps. You can configure alerts and the compliance alerts on this page without creating an Alert Application instance or Compliance Application instance.


Alert Types and Publishers

Alerts in Secure Workload categorizes alerts into various types, including critical system alerts, policy violations, and anomalies detected in workload behavior. Each type serves a specific purpose in maintaining security integrity. Processes are defined for setting up Alerts, from defining alert criteria to specifying notification methods (for example, email or SMS). Alerts are integrated with existing monitoring solutions to provide a comprehensive view of the security landscape.

Alerts in Secure Workload consist of the following components:

  • Alert Visibility

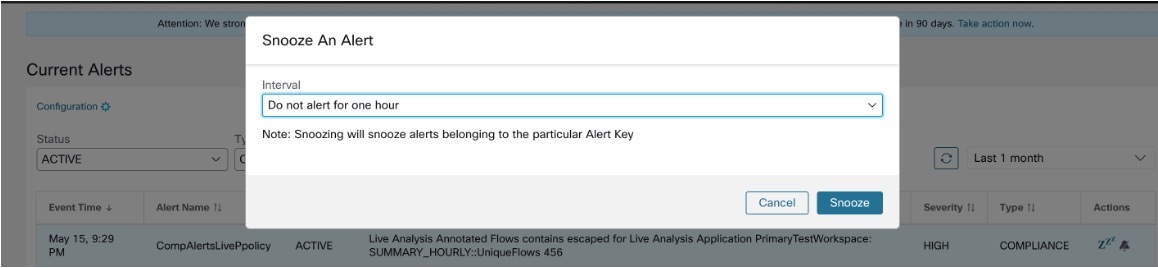
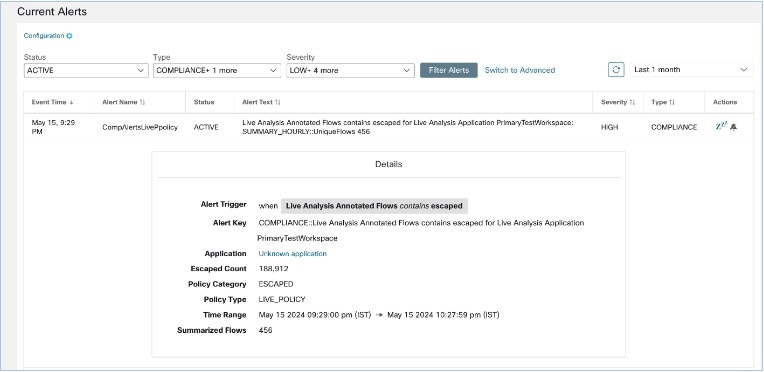
    • Current Alerts: From the navigation pane, choose Investigate > Alerts. Preview of alerts is sent to a Data Tap.

    Figure 1. Current Alerts
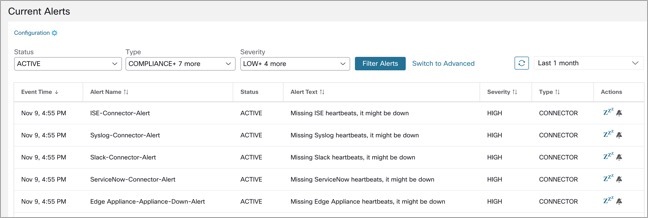
  • Alert Sources and Configuration:

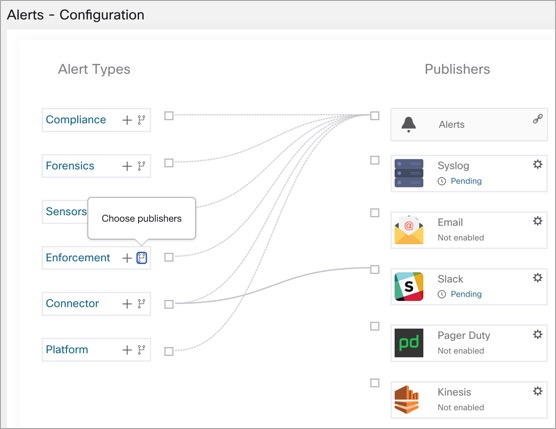
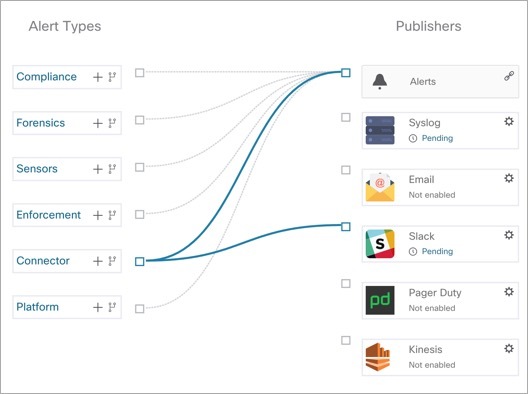
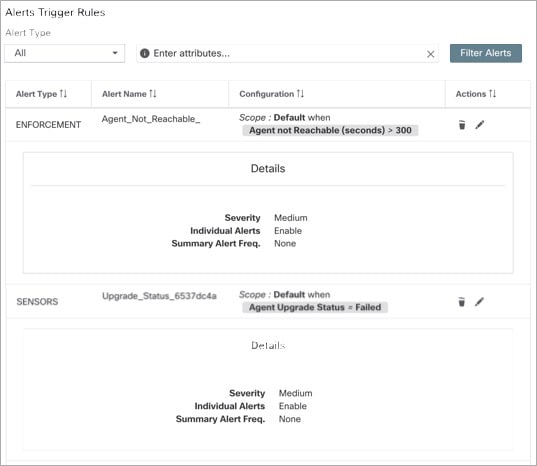
    • Alerts - Configuration: From the navigation pane, choose Manage > Workloads > Alert Configs. Both alert configurations that are configured using the common modal and alert publisher, and notifier settings are displayed.

    Figure 2. Alerts - Configuration
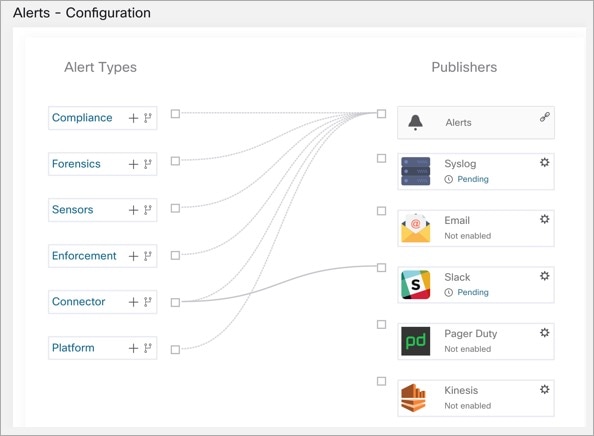
  • Send Alerts:

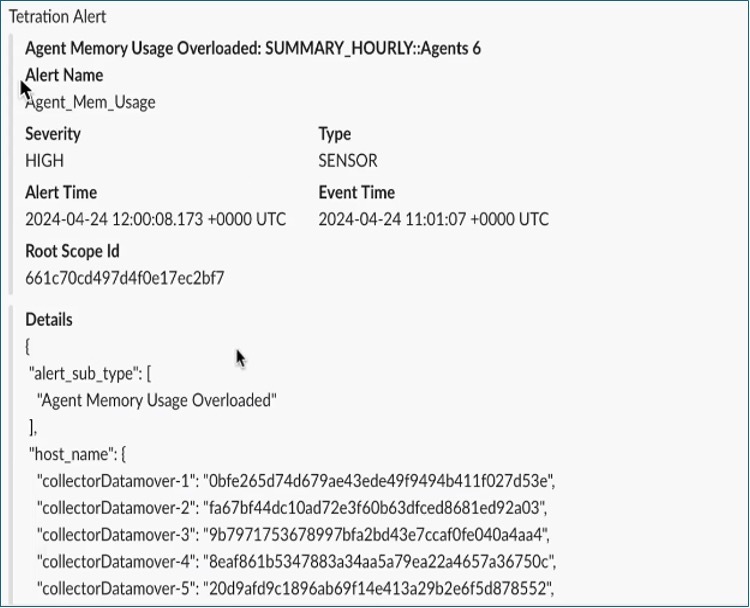
    • Alerts App: An implicit Secure Workload app that sends generated alerts to a configured Data Tap. The Alerts App handles features such as Snooze and Mute.

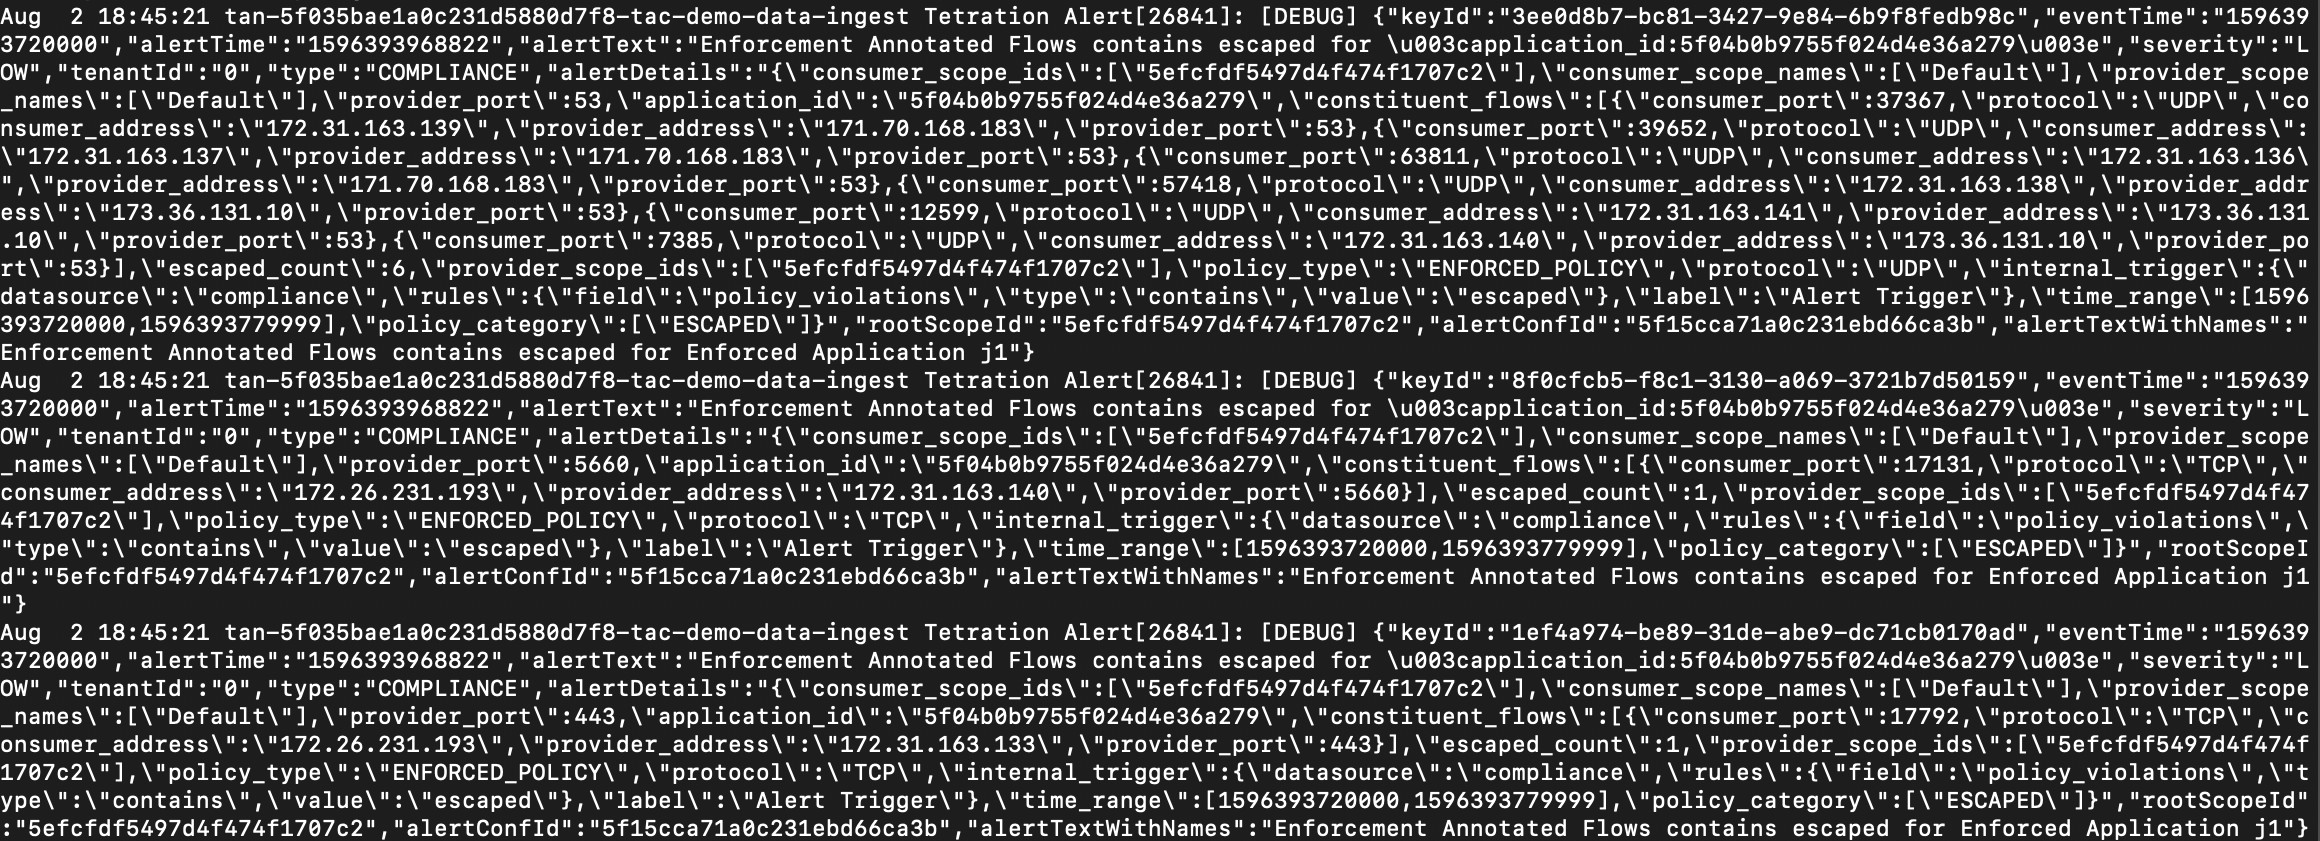
    • Alerts Publisher: Limits the number of alerts that are displayed and pushes alerts to Kafka (MDT or DataTap) for external consumption.

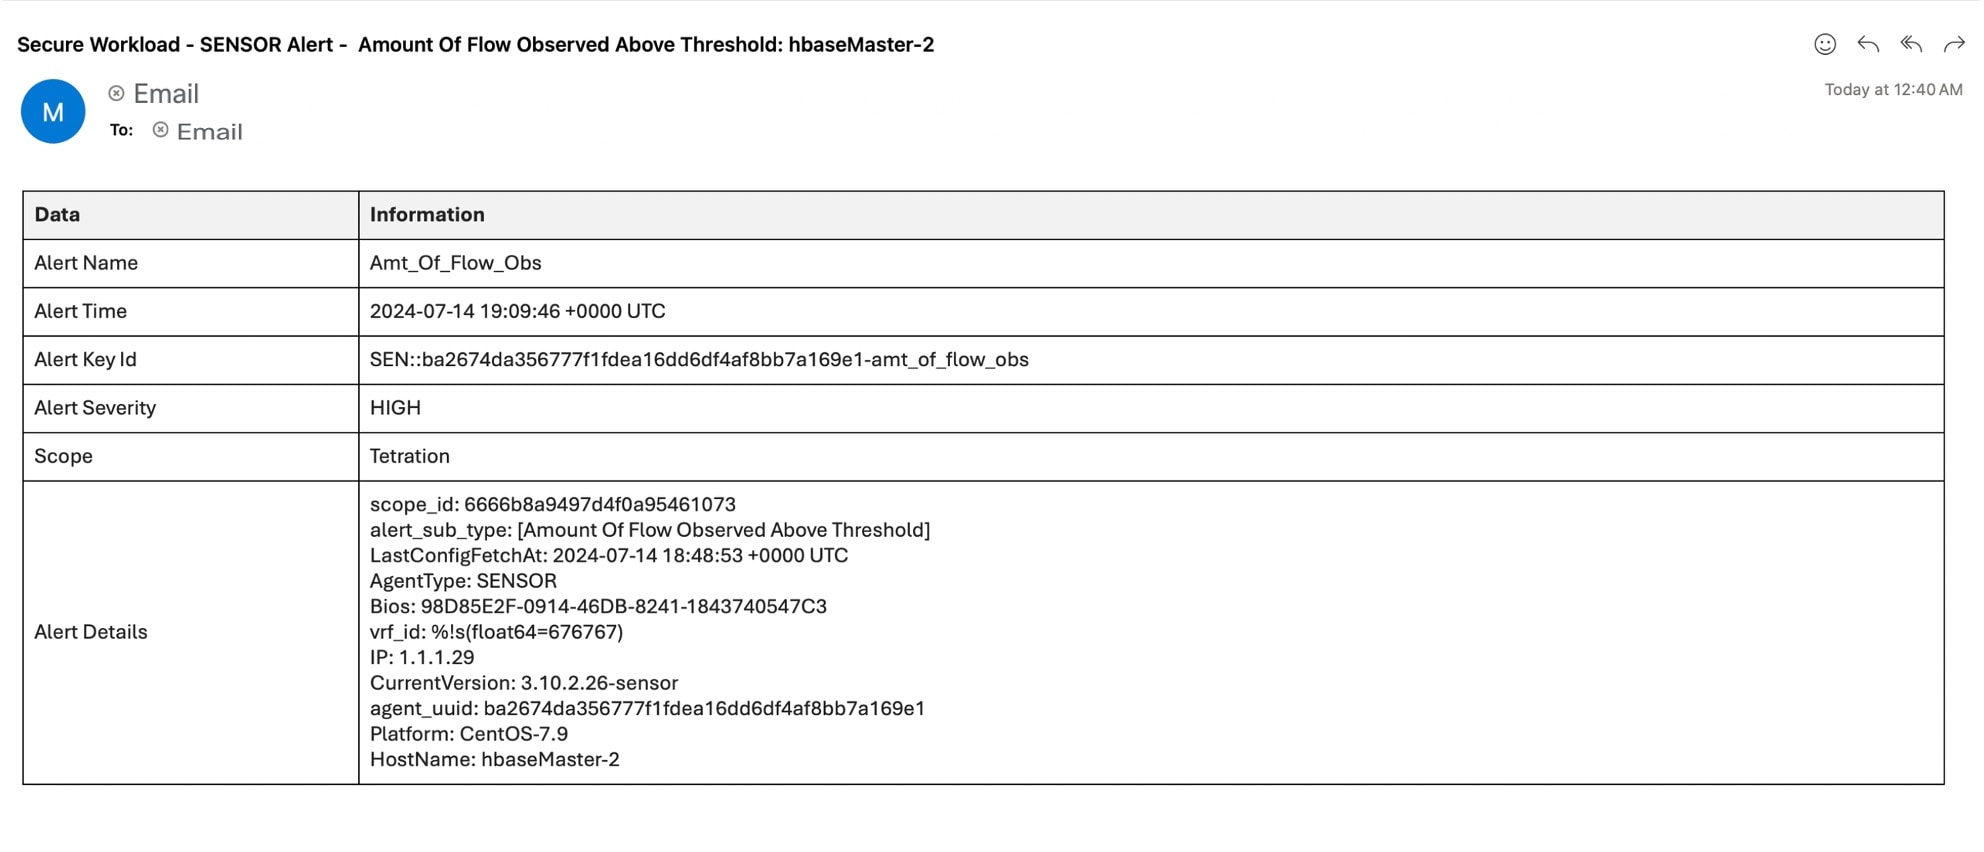
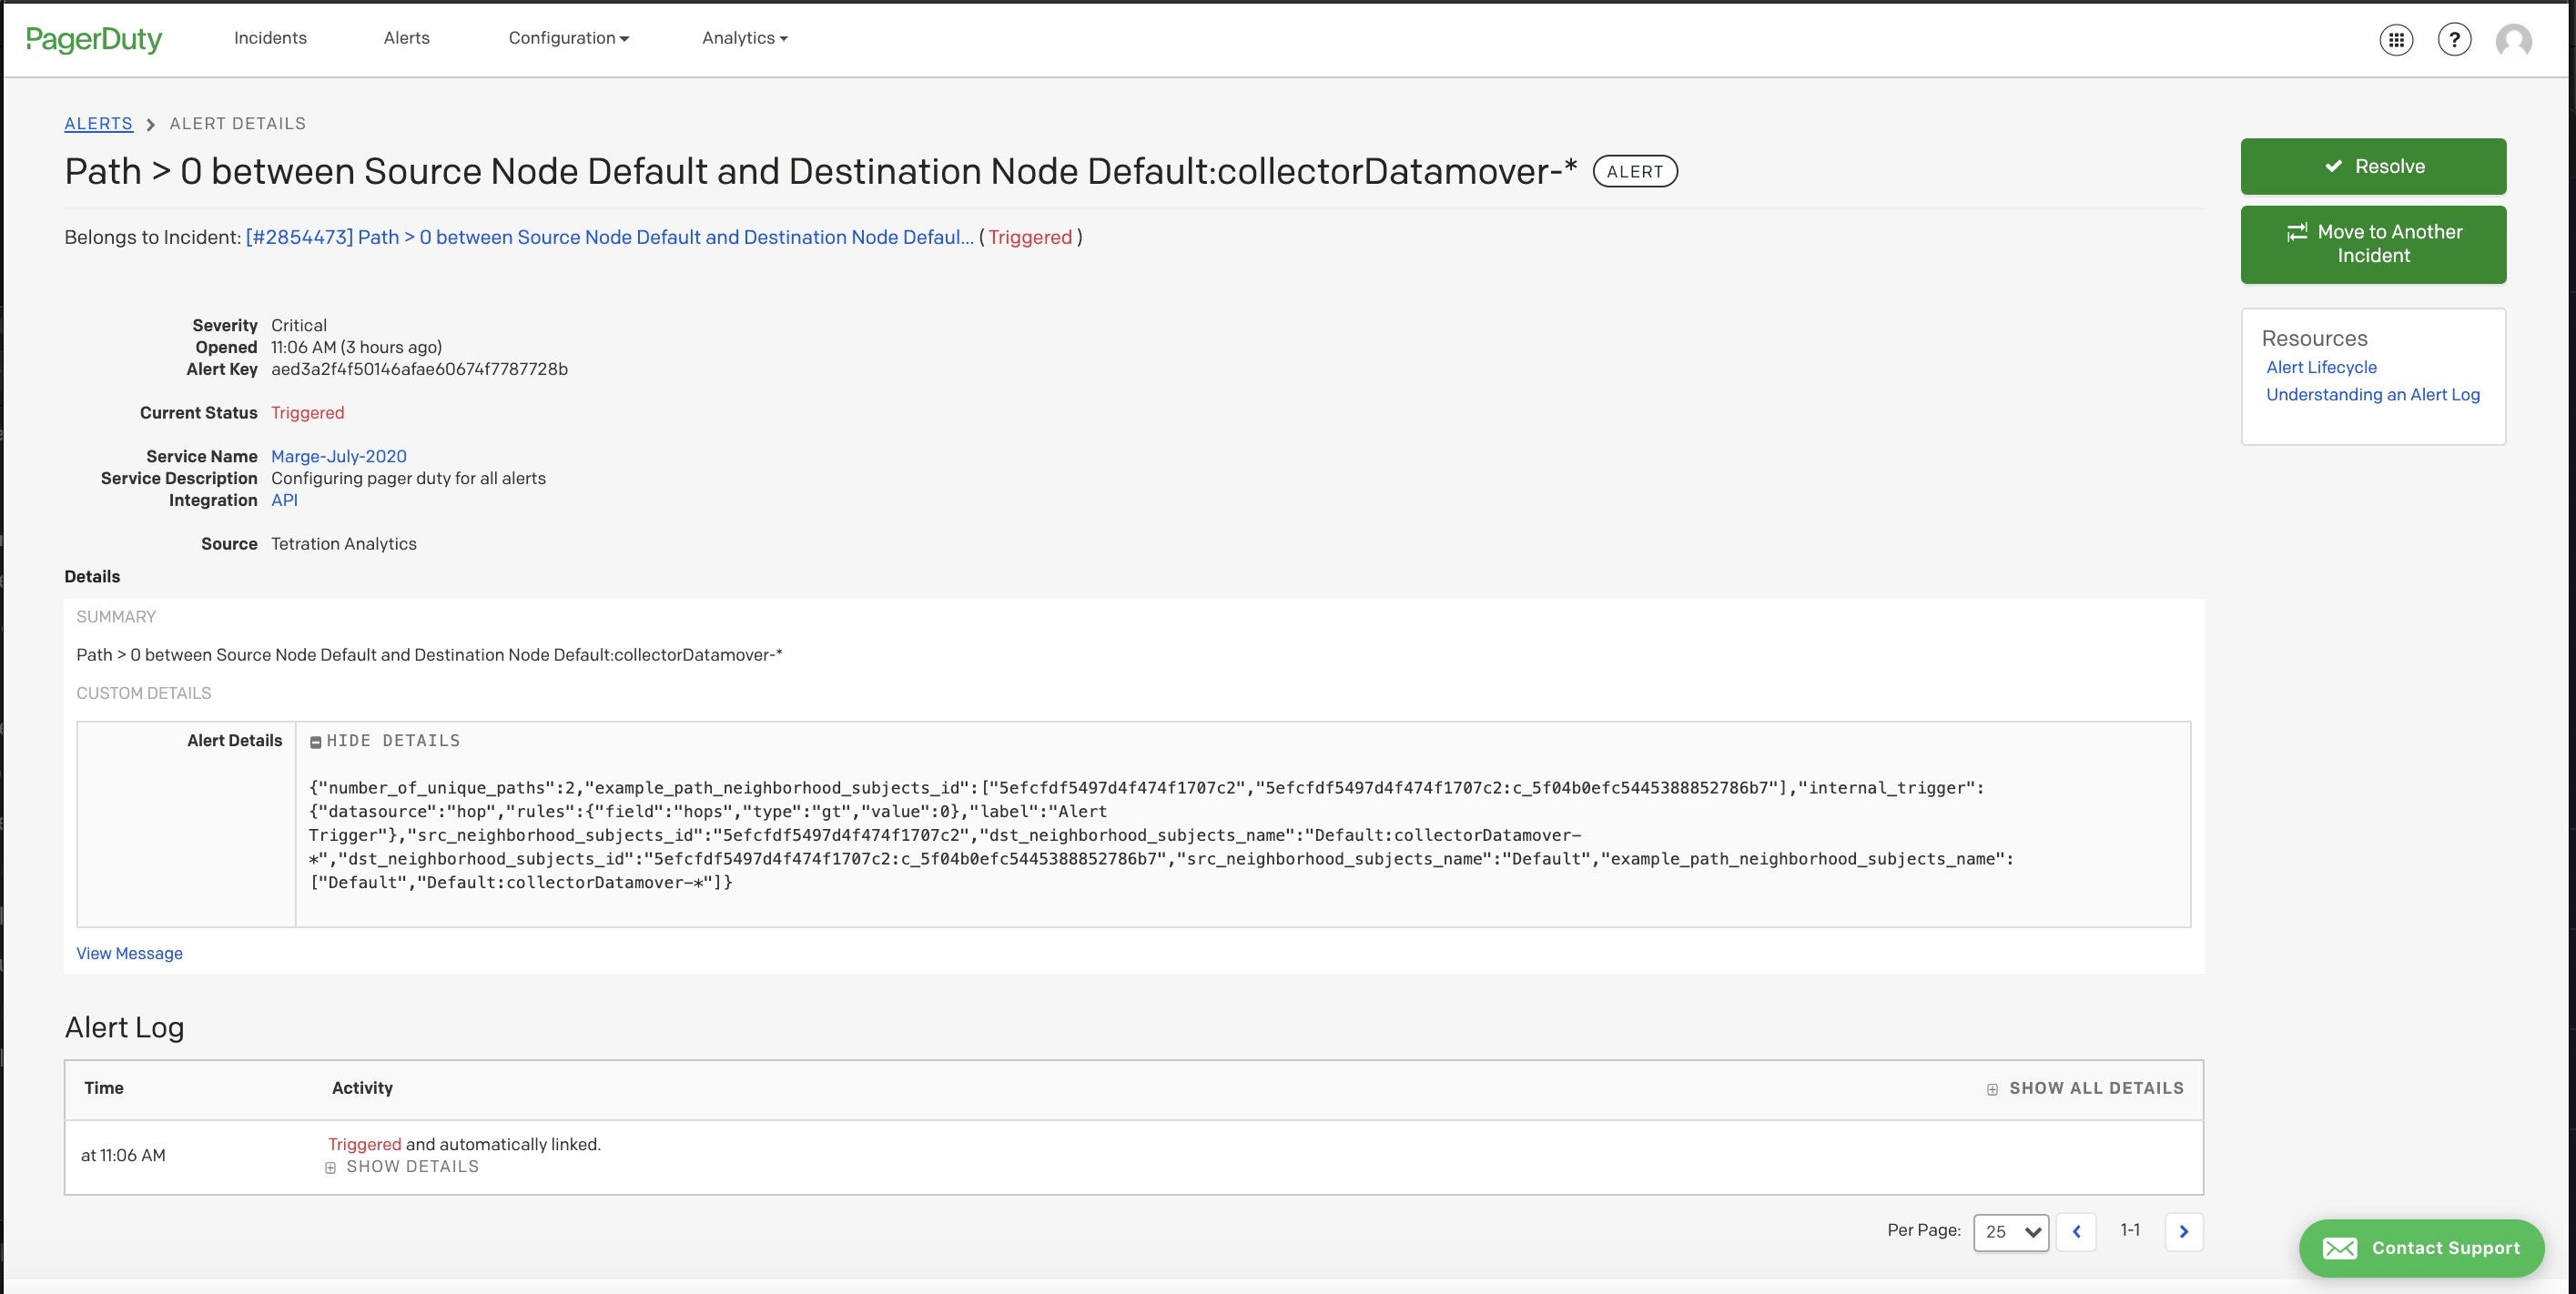
    • Edge Appliance: Pushes alerts to other systems such as Slack, PagerDuty, Email, and so on.

Create Alerts

From the navigation pane, choose Alerts > Configuration to configure the following alert types:

Figure 3. Create Alert or Trigger Rules
  • Enforcement Alerts

    • Agent Reachability

    • Workload Firewall

    • Workload Policy

  • Sensor Alerts

    • Agent Upgrade

    • Agent Flow Export

    • Agent Check In

    • Agent Memory Usage

    • Agent CPU Quota

    • Amount Of Flow Observations

    • New Agent Registered

    • Pcap Status

    • Agent Uninstalled

    • Not Recommended Cipher

    • Deprecated TLS Version

    • Agent Auto Removal

  • Compliance Alerts

    • Enforcement Policy

    • Live Analysis Policy


Note


  • Alert trigger rules are enforced on the currently selected root scope for the Enforcement and Sensors alert types.

  • You must have an enforced capability on the currently selected scope to create an alert trigger rule for the Compliance alert type.


The following Alert Types do not have a configuration modal:

  • Forensics

  • Connectors

  • Traffic

Traffic Alerts

You can create Traffic alerts to notify you when workloads communicate with known malicious IPv4 addresses.

By default, the option to detect malicious addresses are disabled. To enable the option, see Visibility of Well-Known Malicious IPv4 Addresses section.

The available alert conditions are as follows:

  • Malicious flows are Observed: Indicates that communication with the known malicious IPv4 addresses has been observed.

  • Malicious flows are Permitted: After policy analysis and enforcement, this condition notifies you about malicious flows that have been permitted.

  • Malicious flows are Rejected: After policy analysis and enforcement, this condition notifies you about the malicious flows that have been rejected.

Alert Configuration Modal

The Alert configuration modal consists of the following sections:

  • Alert Name: Alert names facilitate a structured approach to alert management, allowing you to assign unique names to alerts.

  • Alert Types: The different types of alerts categorized under Compliance, Forensics, Enforcement, Connector, Platform, and Traffic.

  • Subject: The Subject of an alert depends on the app, and may be prepopulated when the alert modal is contextual.

  • Alert Condition: The condition of the alert on which an alert is triggered. Hover over the info icon to view a list of available conditions.


    Note


    If there are several alerts that are generated, alerts with higher Severity are displayed preferentially over alerts with lower severity.


  • For more configuration options, click Show Advanced Settings.


    Note


    • After the upgrade is complete, all existing alert configuration rules in the current tenants are assigned with an Alert Name, which is based on the predefined format. In instances where the Alert Name is absent, the format to be employed is Alert_SubType_{DatabaseID}. For example,
      Workload_Firewall_64bf9b8493dfc94ca0095718
      .
    • Following deployment or upgrade of the clusters, all default alert configuration rules, those created during the inception of a new tenant, are assigned with an Alert Name in the predefined format: Alert_SubType. For example,
      Upgrade_Status
      .

Figure 4. Configure Alerts

Summary Alerts

Summary Alerts are available only for some applications, and some configuration options that depend on the application.

  • Individual Alerts are generated over non-aggregated or minimally aggregated information and are likely to have a time range of one minute. Note that this does not necessarily mean the alerts are actually generated and sent at a minute interval; the individual alerts can also be generated at the App Frequency interval.

  • Summary Alerts are generated for all agents based on the alert rule that is configured, either for an hourly or a daily basis. For example, sensor and enforcement alerts are summarized for agents, and compliance alerts are summarized on all flows for the alert rule that is configured.

App

App Frequency1

Individual Alerts

Hourly Alerts

Daily Alerts

Compliance

Minute

At App frequency

Summary of Individual Alerts

Summary of Individual Alerts

Enforcement

Minute

At App frequency

Summary of Individual Alerts

Summary of Individual Alerts

Sensors

Minute

At App frequency

Summary of Individual Alerts

Summary of Individual Alerts

Traffic

Minute

At App frequency

Summary of Individual Alerts

Summary of Individual Alerts


Note


The Event Time of Summary Alerts represents the first occurrence of the same alert type over the past hour or a specified interval.


Snooze and Mute Alerts

The Alerts app allows alerts categorized under an alert key to be snoozed for a chosen duration of time.


Note


Currently, you cannot snooze or mute the user app-created alerts.


To snooze an alert:

  1. Under Actions, click the Snooze icon.

  2. From the Interval drop-down list, choose an appropriate interval.

  3. Click Snooze.

Figure 5. Current Alerts
Figure 6. Snooze an Alert

To mute an alert, perform the following:

Use the Mute option to stop receiving alerts:

  1. Under Actions, click the Mute icon.

  2. To confirm, click Yes.

  3. (optional)To unmute the alerts, remove the alert from the muted list. (Use the Status filter drop-down list to view all the MUTED alerts.)

  4. To unmute the alerts, remove the alert from the muted list. Use the Status filter drop-down to view all MUTED alerts and unmute the required alter.


Note


You can view up to 5000 muted or snoozed alerts in a scope.


Admiral Alerts

Admiral is an integrated alerting system, that replaces Bosun from earlier releases. For more information, see Admiral Alerts.

Summarization Versus Snoozing

Summarization of alerts applies to all hosts based on the alert configuration, while snoozing applies to a specific alert.

Here're a few differences between the two:

  • For example, compliance configuration depends on the application workspace, and the type of violation an alert should be generated for. Thus, summarization is applicable to all the hosts based on an alert rule, for example an escaped condition, while snoozingis applicable to a very specfic consumer scope, provider scope, provider port, protocol, and escaped condition.

  • A summary alert is generated at the specified frequency with the alerts that are generated within that interval. Summary alerts provide a count of the number of alerts triggered within the specified frequency interval, along with a summarization of all the agents in that scope.

  • Snoozing alert only results in an alert being sent when a new alert is generated after the snooze interval has passed. Additionally, a platform alert that is configured on a path between source scope and destination scope with a hop count less than some amount, will generate a very specific alert.

Secure Workload Alerts Notifier (TAN)


Note


Starting Secure Workload Release 3.3.1.x, TAN is moving to Secure Workload Edge Appliance.


Alert Notifiers provide capabilities to send alerts through various tools such as Amazon Kinesis, Email, Syslog, and Slack in the currently selected scope. As a Scope Owner or Site Admin, each notifier can be configured with required credentials and other information specific to the notifier application.

Configure Notifiers

To configure notifiers, you must configure the alert-related connectors. The connectors can only be configured after a Secure Workload Edge Appliance is deployed. For more information on deploying Secure Workload Edge appliance, see Virtual Appliances for Connectors.

After the Secure Workload Edge appliance is set up, you can configure each notifier with its specific required input. After the Secure Workload Edge appliance is set up, you will be able to see dashed lines connecting Alert Types to Alerts publisher. This is because the notifier is built on the Alerts publisher.

After the Secure Workload Edge appliance is set up, you can configure each notifier with the required input. After the Secure Workload Edge appliance is set up, you are able to view the dashed lines connecting Alert Types to Publisher. This is due the fact that notifier is built on the Publisher.

App Frequency is approximately how often the application runs and generates alerts. For example, Compliance has a flexible run frequency, and may actually compute alerts over a couple minutes together.

Choose Alert Publishers

Scope Owners and Site Admins can choose Publishers to Send alerts. Publishers include Kafka (Data Tap) and Notifiers.

All the available Publishers are displayed in the Alerts - Configuration window, including the Alerts and Active Notifiers. You can toggle the Send icon to choose the Publishers for the alert type. Minimum Alert Severity refers to the severity level an alert must reach to be sent through the Publishers.

Figure 7. Choose Alert Publishers

Note


TaaS clusters have a maximum number of alerts that can be processed of up to 14000 alerts per minute batch. This could also be reduced by choosing external data taps.


External Syslog Tunneling Moves to TAN


Note


Starting the 3.1.1.x release, the syslog tunneling feature moves to TAN. To configure syslog for getting platform level syslog events, you must configure TAN on the Secure Workload Edge appliance on default rootscope. When the Secure Workload Edge appliance is configured on the default rootscope, you can set up the syslog server. To enable platform alerts, enable syslog notifications for Platform. This can be done by enabling Platform Syslog connection.


For details about how to configure syslog, see Syslog Connector.

Connection Chart

The connection chart displays the connections between Alert Types and Publishers. After you choose a publisher for an alert type, a blue line is established between the alert type and publisher. Note that the line pointing to the Internal Kafka (Data Tap) is always a line created using dashes as it represents an internal mechanism of how alert notifications are built upon.

Figure 8. Connection Chart

View Alerts Trigger Rules

You can view a list of all the configured Alerts Trigger Rules on the Alerts - Configuration page. You can also perform the following tasks:

  • You can filter the rules by Alert Type and other properties.

  • In the Actions column, click the pencil icon to modify the details such as Alert Name, Alert Types, Alert Condition, Severity and so on.

  • Click See All Configured [alert type] Alerts to view all the alerts of the selected Alert Type in a new tab.

Figure 9. View Alerts Trigger Rules

The Alerts Trigger Rules window is used to filter alerts trigger rules by Alert Type and trigger condition.


Note


Alert trigger condition is an exact match condition.


Alerts Trigger Rules Details

Click a row in the Alerts Trigger Rules section to view the configuration details.

  1. Alert Type: Type of the alert.

  2. Alert Name: Name of the alert.

  3. Configuration: The condition when an alert is triggered in a particular scope.

You can also view other details such as Severity, Individual Alerts, and Summary Alert Frequency.

Figure 10. Alert Configuration Details

Generate Test Alerts

The primary usage of generating a test alert is to verify the connectivity with the publisher. You can configure a test alert to send alerts based on the alert type and linked publisher in the alert configuration.


Note


  • Generating test alerts is not from the actual sources and is generated for test purpose only.

  • Test alerts can be generated for alert types which are linked to at least one publisher.


To generate a test alert, follow the steps below:

Procedure


Step 1

From the navigation pane, choose Manage > Workloads > Alerts Config.

Step 2

To configure a test alert, click Test Alert.

Figure 11. Test Alert Configuration

Step 3

Under the Keys tab, enter the value for Alert Key and choose the values for Event Time, Alert Time, Alert Severity and Alert Type.

Step 4

Under the Scope tab, the values of Scope ID and Tenant ID are autogenerated based on the current scope.

Note


If the Tenant ID is the same as Tenant ID VRF, then the system automatically checks the Tenant ID VRF check box.

Step 5

Under the Details tab, enter the values for Alert Text, Event Notes, Alert Details, and Alert Configuration ID.

Note


Alert Details can be string or data in JSON format.

Options for JSON content are:

  1. Containing fields expected by that type of alert.

  2. Any sample JSON data, if that alert type does not expect default json fields.

    Sample JSON:
    {"alert_name ":"sample","alert_category":{"severity": "dummy"}}

Step 6

Under the Configuration tab, choose the value for Individual Alert, Alert Frequency, and Summary Alert Frequency.

For individual alerts, choose ENABLE or DISABLE from the drop-down.

Alert frequency is autoselected with frequency as INDIVIDUAL.

Note


It supports only individual alerts and does not consider summarization.

Summary alert is autoselected to NONE.

Step 7

To generate the test alert, click TEST.

Note


A test alert is generated and sent to the configured publisher.


Current Alerts

Navigate to the Investigate > Alerts page to view the list of all active alerts. You can filter the alerts by Status, Type, Severity, and Time Range.

Only alerts with severity set to IMMEDIATE_ACTION, CRITICAL, HIGH, MEDIUM, or LOW are displayed on the Current Alerts page. All alerts irrespective to the severity values are sent to the configured Kafka broker.

Figure 12. Current Alerts

Filter Alerts by Time Range

  1. Choose a range from the drop-down list. The default value is 1 month.

  2. Click Custom and fill in the From and To dates to configure a custom range. Click Apply. Note that when a custom time range is selected, the Refresh button is disabled.

Advanced Filtering

  1. Click Switch to Advanced.

  2. Enter the attributes to filter. Hover over the info icon to view the properties to filter.

    The alert filters are not retained when you switch back to the basic options.

View Additional Alert Details

You can view more details about an alert by clicking the corresponding alert.

Figure 13. Alert Details
  • Only 60 alerts per minute per root scope are displayed.

  • A higher volume of alerts results in an alert type called Summary Alerts, with the count of alerts that are not displayed .

  • There is a maximum limit on the number of alerts that are displayed at any point in time; older alerts are dropped as new alerts come in.

    For more information, see Limits.

Alert Details

Common Alert Structure

All alerts follow an overall common structure. The structure corresponds to the json message structure available through Kafka DataTaps.

Field

Format

About

root_scope_id

string

Scope Id corresponding to top scope in scope hierarchy.

key_id

string

id field used for determining ‘similar’ alerts. Identical key_id’s can be snoozed.

type

string

Type of the alert. Fixed set of string values: COMPLIANCE, USERAPP, FORENSICS, ENFORCEMENT, SENSOR, PLATFORM, FEDERATION, CONNECTOR

event_time

long

timestamp of when the event triggered (or if event spanned a range, then the beginning of the range). This timestamp is in epoch milliseconds (UTC).

alert_time

long

Timestamp of when the alert was first attempted to be sent. This will be after the timerange of the event. This timestamp is in epoch milliseconds (UTC).

alert_text

string

Title of the alert.

alert_text_with_names

string

Same content as alert_text but with any id fields replaced by corresponding name. This field may not exist for all alerts.

severity

string

Fixed set of string values: LOW, MEDIUM, HIGH, CRITICAL, IMMEDIATE_ACTION.This is the severity of the alert. For some types of alerts these values are configurable.

alert_notes

string

Usually not set. May exist in some special cases for passing additional information through Kafka DataTap.

alert_conf_id

string

id of the alert configuration that triggered this alert. May not exist for all alerts.

alert_details

string

Structured data. Stringified json. See feature details for specific alert type, since the exact structure of this field varies based on the type of alert.

alert_details_json

json

Same content of alert_details, but not stringified. Only present for compliance alerts, and only available through Kafka.

tenant_id

string

May contain vrf corresponding to root_scope_id. Or may contain 0 as the default value. Or may not be present at all.

alert_id

string

Internal generated temporary id. Best ignored.

alert_name

string

Name of the alert.

  • Federation: federation-alert-details

  • Platform: Alert Details

General Alert Format by Notifier

The following are the examples of how alerts display across various notifier types.


Note


Starting Secure Workload 3.9, notifier details include Alert Name.


Kafka (DataTaps)

Kafka (DataTap) messages are in JSON format. Example below; see above alert_details for some additional examples.

{
"_id" : ObjectId("66969d9b89f8901091b54f29"),
"key_id" : "SEN::6c12d5738f083632ad99acb1ba7a6dc4968938be-amt_of_flow_obs",
"event_time" : NumberLong("1721146728000"),
"alert_time" : NumberLong("1721146779640"),
"alert_text" : "Amount Of Flow Observed Above Threshold: collectorDatamover-2",
"alert_text_with_names" : "Amount Of Flow Observed Above Threshold: collectorDatamover-2",
"severity" : "HIGH",
"tenant_id" : "676767",
"root_scope_id" : "6666b8a9497d4f0a95461073",
"type" : "SENSOR",
"alert_details" : "{\"details\":{\"AgentType\":\"SENSOR\",\"Bios\":\"819FAC8D-39DE-
4C56-8CF4-7EEE25CF3510\",\"CurrentVersion\":\"3.10.2.26-
sensor\",\"DesiredVersion\":\"3.10.2.26-sensor\",\"HostName\":\"collectorDatamover-
2\",\"IP\":\"1.1.1.36\",\"LastConfigFetchAt\":\"2024-07-16 15:49:50 +0000
 UTC\",\"Platform\":\"CentOS-
7.9\"},\"agent_uuid\":\"6c12d5738f083632ad99acb1ba7a6dc4968938be\",\"scope_na
me\":\"Tetration\",\"scope_id\":\"6666b8a9497d4f0a95461073\",\"vrf_id\":676767,\"h
ost_name\":{\"collectorDatamover-
2\":\"6c12d5738f083632ad99acb1ba7a6dc4968938be\"},\"alert_sub_type\":[\"Amount 
Of Flow Observed Above Threshold\"]}",
"alert_name" : "Amt_Of_Flow_Obs"
}

Email

Information about configuring Email alerts: Email Connector

Figure 14. Example of a Secure Workload Sensor Alert
Example of a Cisco Secure Workload alert when configured to send to email

PagerDuty

Information about configuring PagerDuty alerts: PagerDuty Connector

Figure 15. Example of a Secure Workload Alert in PagerDuty
Example of a Secure Workload alert in PagerDuty

Alerts sent to PagerDuty is a re-trigger of the same alert based on the key_id.

Severity is mapped to PagerDuty severity as follows:

Secure Workload Severity

PagerDuty Severity

IMMEDIATE_ACTION

critical

CRITICAL

critical

HIGH

error

MEDIUM

warning

LOW

info

Syslog

Information about configuring Syslog alerts, and adjusting severity mapping: Syslog Connector

Figure 16. Sample of Secure Workload Alerts Sent to Syslog
Example of several Secure Workload alerts sent to syslog

Slack

Information about configuring Slack alerts: Slack Connector

Figure 17. Example of a Secure Workload Alert Sent to Slack Channel
Example of a Secure Workload alert sent to slack channel

Kinesis

Information about configuring Kinesis alerts: Kinesis Connector

Kinesis alerts are similar to Kafka alerts, as these are both message queues.