Cisco Cyber Vision New UI Administration Guide, Release 5.6.0

PDF

Cisco Cyber Vision New UI Administration Guide, Release 5.6.0

Assets

Want to summarize with AI?

Log in

Outlines the definition, categorization, and management of assets in Cisco Cyber Vision, including modular asset structures, feature enhancements such as summary views and custom properties, asset search capabilities, CSV export improvements, and details on interface identification and visualization.


An asset is a network entity that

  • serves as a core physical component within an industrial network, such as a programmable logic controller (PLC), a switch, a controller, or a server,

  • may represent one or more modules with distinct identifiers, which may include serial number, reference, or type, even when MAC and IP addresses overlap; and

  • is defined, categorized, and managed according to established rules in Cisco Cyber Vision to ensure effective asset inventory and operations.

Modular assets: If an asset is modular, such as a chassis with multiple modules, its summary shows details including slot, model name, type, firmware version, and serial number. Each module, such as a CPU, communication module, or I/O module, appears as a separate block in the chassis view.

Table 1. Feature History Table

Feature

Release Information

Feature Description

Assets page enhancement

Release 5.6.x

The Assets page includes the following tabs for each asset: Summary, Alerts, Vulnerabilities, Communications, Behaviors, Services, Properties, and Interfaces

The cards on the Summary page provide high-level information about an asset before you open a related details tab.

Custom properties

Release 5.5.x

Add custom properties to Cisco Cyber Vision assets. You can view, add, and edit these properties, with strict validation rules enforced to maintain data integrity.

Search bar

Release 5.3.x

New UI contains a search bar in the global top banner. You can search for an asset by name, IP address, or MAC address.

Asset list CSV enhancements

Release 5.3.x

The CSV that you download from Cyber Vision Center includes a column that lists the sensors that have detected assets.


Asset data management

The table presents the main functions available for managing asset data in the Assets page. It describes the specific capabilities and behavior of each function.

Function

Description

Use widgets to filter assets table

The widgets at the top of the Assets page allow you to filter data in the asset table. You can select any of these widgets to display the corresponding data:

  • Active Alerts

  • Vulnerabilities

  • Discovered in last 7 days

  • Discovered in last 30 days

Delete assets

By default, the system deletes assets removed from the production line after 30 days.

You can manually delete assets detected due to misconfiguration. If sensors detect the assets again, the system may re-add them to the inventory.

Search for assets

Enter at least three characters from an asset’s name, IP address, or MAC address in the search bar to quickly locate details.

Export

Export all asset data to a CSV file. The export includes asset IDs so you can distinguish assets with the same name.

Manage asset table view

On the Assets page, you can switch among the predefined table views:

  • Security (default view)

  • Network

  • Inventory

The system saves your most recently selected view and restores it when you reopen the Assets page in a new session.

Several new columns have been added to the asset table view to display additional asset properties, such as Asset Group, OS, Firmware, Model, Behaviors, and Services. Use the table Settings menu to show or hide columns as needed.


Asset summary

An asset summary provides a quick view of the security information available for the asset.

The Summary tab includes asset metadata, and the available summary cards provide high-level information about an asset before you open a related details tab. The Summary tab includes these cards:

  • Alerts

  • Vulnerabilities

  • Behaviors

  • Services

  • Communications

  • Rack Slot

Information in asset summary cards

This table depicts the available cards on the Summary page. The cards and values that appear depend on the asset data and the features available in your deployment.

Table 2. Information in asset summary cards

Card

Information shown

Alerts

The card shows the number of active alerts. The card’s visual indicator reflects the highest criticality among those alerts.

Vulnerabilities

Vulnerability information such as the total count and indicators for confirmed vulnerabilities, known exploits, a network attack vector, or the highest Common Vulnerability Scoring System (CVSS) value.

Behaviors

The card shows the number of unique behaviors observed for the asset, along with tags for the most recently observed behaviors.

Services

The service count shown for the asset.

Communications

The card shows the number of internal and external peers that communicate with the asset, when available.

Rack Slot

Available only for modular PLCs (Programmable Logic Controllers) assets. The card provides a quick inventory view of the PLC’s installed modules details such as the model name, slot type, firmware version, and serial number.


View asset summary

Use the Summary tab of an asset to view essential metadata and summary cards, such as alerts, vulnerabilities, behaviors, Services, and communications. This allows you to identify the asset's status and select summary cards for more detailed analysis.

Follow these steps to view the asset's Summary page.

Procedure

  1. From the main menu, select Assets.

    The Assets page lists all available assets.

  2. Select an asset to open its details.

    The Summary tab opens by default.

  3. Review the asset metadata and summary cards to assess its overall status.

  4. Select a summary card, such as Alerts, Vulnerabilities, Behaviors, Services, or Communications to view related details.


View asset alerts

Assets may generate multiple types of alerts. Reviewing and organizing these alerts helps users identify current issues and prioritize investigation.

The Alerts card depicts the total count of active alerts on the asset. The card also provide count of each alert category and the last alert detected data.

Use the asset's Alerts tab to review all alerts associated with an asset without opening alert instances individually.

Follow these steps to view alerts for an asset.

Procedure

  1. From the main menu, select Assets.

  2. Select an asset to open its details page.

    The Summary tab displays asset metadata and summary cards. The Alert card shows the total number of active alerts and the alert counts by category.

  3. On the Alerts card, select an alert category, such as Communication, Intrusion Detection, Property, or Vulnerability.

    The Alerts tab opens and displays alerts associated with the selected asset.

    Note

    In the alert table, the Alert Type column identifies the type of alert. The Context column identifies the related entity for the alert. Refer the context-related values in Alert triggers and instances in assets.

  4. On the Alerts tab, perform any of the following actions:

    1. Review alert count widgets by Category or Severity. Category is selected by default.
      • Category - Communication, Intrusion Detection, Property, and Vulnerability

      • Severity - Critical, High, Medium, and Low

    2. Select a widget to filter the alert table by that category or severity.
    3. Sort the alert table by selecting a column header: Alert Category, Alert Type, Severity, or Last detected.
    4. Click Details for an alert to view additional information about that alert instance.

      The Alerts page opens with the alert details. If the asset is an alert instance, the page is filtered by the asset name. If the asset triggered the alert, the page displays additional information about the alert instance. For additional details, refer to Alert triggers and instances in assets.


Alert triggers and instances in assets

An alert trigger is the condition that causes an alert. An alert instance represents an affected entity; depending on the alert type, it is usually an asset but can be another entity.

An alert can have one trigger and multiple instances. Grouping related instances under a trigger reduces the number of alert entries that you need to review.

  • Depending on the alert type, the selected asset can be an alert instance or the alert trigger.

  • On the Alerts tab of an asset, the Context column identifies the other entity: the trigger when the selected asset is an instance, or the instance when the selected asset is the trigger.

  • The Details button on the Alerts page opens the related alert instance page. When the selected asset is an instance, the page can open with the asset filter applied; when it is the trigger, the page can open without an asset filter.

Note

The Details button is available only when you have the appropriate permission.

Table 3. Alert instance page destination by alert type

Alert type

Context value

Alert instance page destination

Severe vulnerabilities in monitored entities

CVE ID and CVE title

Opens the alert instance page filtered by the asset.

Prohibited vendors

Vendor name

Opens the alert instance page filtered by the asset.

Assets with unexpected external communications

Number of remote domains or addresses

Opens the alert instance page without an asset filter.

Inactive assets

Alert rule name

Opens the alert instance page filtered by the asset.

Intrusion detection

Snort rule ID and Snort rule

Opens the alert instance page filtered by the source asset.

Network Scanner

Number of scan events

Opens the alert instance page without an asset filter.

Assets with unexpected behavior

Asset name

Opens the alert instance page.


View asset vulnerabilities

Review vulnerabilities associated with a chosen asset in Cisco Cyber Vision to help prioritize remediation efforts.

Cisco Cyber Vision uses an internal knowledge database to match asset properties with recognized vulnerabilities, icons, and threats. For additional details on vulnerabilities, refer to the Vulnerabilities section.

Before you begin

Ensure you have access to the Assets and Vulnerabilities dashboards in Cyber Vision Center. You may need to check your permissions under Configuration > Users > Role Management.

Follow these steps to view asset vulnerabilities details.

Procedure

  1. From the main menu, select Assets.

    The Assets page lists all available assets.

  2. Select the asset that you want to review.

    The Summary tab opens and displays asset details and summary cards. The Vulnerabilities card shows confirmed and potential vulnerability counts, the highest CVSS score, network attack vector count, and known-exploit count.

  3. Click the Vulnerabilities card.

    The Vulnerabilities tab opens and displays the vulnerabilities identified for the selected asset.

  4. On the Vulnerabilities tab, perform any of the following actions as needed:

    1. Select Cisco Security Risk Score or CVSS Score, and then select a widget to apply its associated score filter to the vulnerability table.
    2. Sort the table by columns such as Alert, Vulnerability ID, Name, Risk Score, or Status.
    3. Optionally, enable Show Acknowledged to include acknowledged vulnerabilities.
    4. If required, Acknowledge or Unacknowledge vulnerabilities. For detailed steps, refer to the following topics:
    5. Click Export to download the vulnerability list as a CSV file.

The vulnerability list for the selected asset is displayed. Applied filters help you identify and prioritize critical vulnerabilities.


View asset communications

Use the Communication card to investigate communication patterns for a selected asset.

Use the Communications tab to examine internal and external interactions of the asset, and review communication details for monitoring or auditing purposes. For additional information on Communication tab, refer to Communication maps.

Follow these steps to view asset communications.

Procedure

  1. From the main menu, select Assets.

    The Assets page lists all assets.

  2. Select the asset you want to view.

    The Summary tab opens and displays asset metadata and summary cards. The Communications card shows the number of internal assets, network interfaces, external resources, ASN organization information for external communications, and last unicast days.

    Note

    Investigate any external communication count greater than zero.

  3. Click the Communications card to open the Communication tab.

  4. On the Communications tab, perform the following actions as needed.

    1. Use the Map or List view to review internal and external communication patterns.
    2. Apply filters, such as time, protocol, communication type, or focus filters (Asset, Network, or Country), to narrow the results.
    3. Use search to find and investigate specific remote assets.
    4. If external communications exist, use the ASN Info toggle in the Map view to review details about the external traffic.

The communications map displays the selected asset’s network interactions based on the filters you apply.


Asset communication map features

The asset communication map shows all communications between a selected asset and other individual assets in your environment. It provides a detailed view of communication patterns, offers several useful filters, and supports multiple identification methods to help you analyze network communications easily.

Table 4. Features of the asset communication map

Feature

Description

Search

Lets you search for assets within the current map and view their communication details.

Time filter

  • Lets you focus on communications for specific time periods to analyze trends or activity.

  • The Last 7 days filter is enabled by default.

Group communications

  • Lets you group assets by Asset , Network, or Country to organize the map.

  • Group nodes show communications between assets from the same group. Individual links show details of communication between groups: observed protocols, data exchange volumes, and information about the asset source or destination.

  • If an asset communicates with another asset you did not include in the active view filter, the map displays the node and links for that asset as a dotted line.

  • Non-communicating groups appear in grid view on the map.

Communication type

Filters the map by external or internal communications.

When parent and sub-domains exist in external communications, click the parent domain node in Map view to display communications between sub-domains. Breadcrumbs show your current location.

Protocol filter

  • Lists all protocols used between assets.

  • All protocols appear by default, but Traffic-Heavy Protocols are deselected to improve clarity.

Assets identification

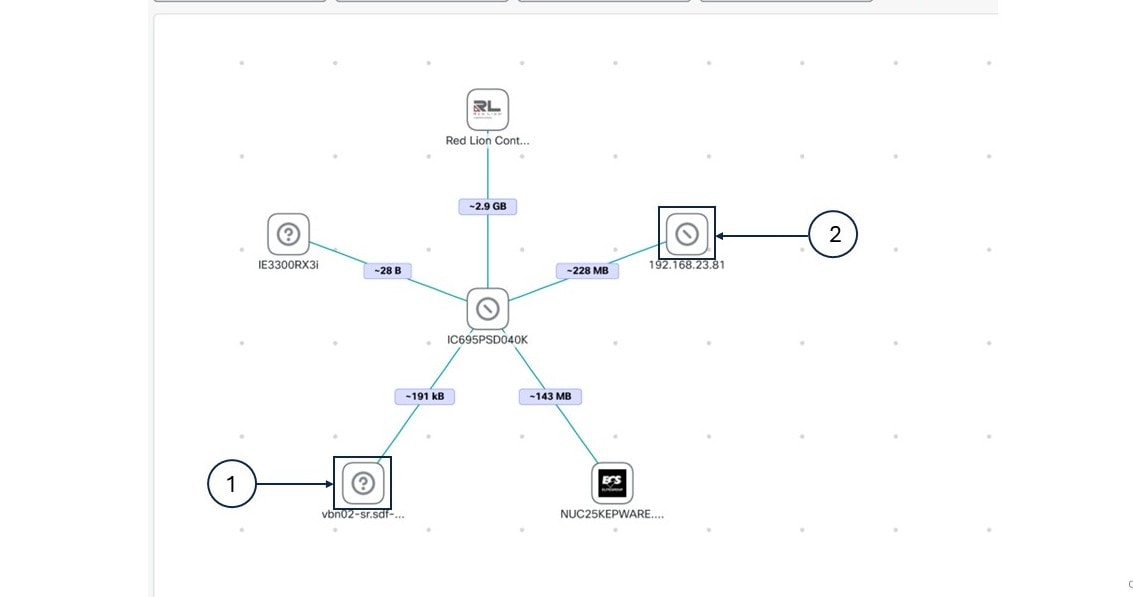
For each asset, the map shows the vendor icon and name. If this information is unavailable, you see the asset’s IP address or MAC address.

Figure 1. Icon descriptions

Icon

Description

(1)

This icon indicates that vendor information for the asset is unavailable.

(2)

This icon indicates that the vendor is known, but its icon is unavailable.


View behaviors for an asset

Use the Behaviors card to analyze the distinct behaviors associated with an asset for security and operational insights.

The Behaviors card shows a count of distinct observed behaviors and the most recently observed behavior, such as Program Upload, Start CPU, Stop CPU, Read Var, Write Var, Restart CPU, or Network Configuration.

The Behaviors tab provides a view of all behaviors observed for the asset. The Behaviors Timeline displays data with daily granularity, showing date-grouped entries with the behavior name, category, description, first or last seen, and related asset when applicable. Each behavior is color coded based on its importance.

Follow these steps to view asset behaviors.

Procedure

  1. From the main menu, select Assets.

    The Assets page displays a list of all assets.

  2. Select the asset that you want to review.

    The asset Summary tab opens. The Behavior card shows the most recently observed behavior and when it occurred.

  3. Click the Behavior card.

    The Behaviors tab opens and displays the asset's observed behaviors, grouped by date, along with a timeline.

    The Behaviors tab opens, displaying the list of behaviours observed for the asset grouped by date, and timeline of those behaviors.

    Note

    If you select a behavior badge on the card, the timeline is filtered to show only that behavior.

  4. On the Behaviors tab, use the available options as needed:

    1. Review timeline entries, including the behavior name, category, description, first- or last-seen time, and related asset, when applicable.
    2. Select a related asset link to open that asset's Summary page.
    3. Use the Search field to find a specific behavior.
    4. Select Daily, Weekly , or Monthly to change the timeline granularity.
      Note
      • Daily data is retained for 31 days.

      • Weekly data shows up to 31 days in 7-day windows.

      • Monthly records are retained for 13 months.

    5. Filter behaviors by Directions.
    6. Select a behavior from the drop-down list to view its details.

      Behavior entries are color-coded to indicate their importance.


View asset services

In Cisco Cyber Vision, a Service refers to an active program, network infrastructure, or specialized industrial application detected on a monitored asset. Cyber Vision uses Deep Packet Inspection (DPI) to identify and display detailed information about services on each asset.

On the asset's Summary page, the Services card provides the total count of services. The most recently detected services are listed as badges on the card, such as Windows, HTTP Server, DNS Server, SSH, and engineering software like Ignition or FactoryTalk.

Use the Services tab to review the services displayed for a selected asset.

Follow these steps to view asset services.

Procedure

  1. From the main menu, select Assets.

    The Assets page lists all available assets.

  2. Select the asset you want to review.

    The Summary tab opens. The Service card shows the number of detected services and may display recently detected services, such as Windows, HTTP Server, DNS Server, SSH, Ignition, or FactoryTalk.

  3. Click the Service card.

    The Service tab opens and lists the detected generic and port-based services, including when each service was first and last observed.

  4. On the Services tab, use the available controls as needed:

    1. Use Search to find a specific service.
    2. Use the Protocol drop-down list to filter services by protocol.
    3. Use the Service drop-down list to select services and view their details.

You can now review the services detected for the selected asset.


View asset properties

Use the Properties tab to review properties collected from the network for a selected asset. Reviewing asset properties ensures accurate asset identification and helps validate the information collected from the network.

Cisco Cyber Vision organizes the asset properties by protocol in the Properties tab.

Follow these steps to view asset properties.

Procedure

  1. From the main menu, select Assets.

    The Assets page lists all available assets.

  2. Select the asset you want to review.

    The Summary tab opens and displays asset metadata and summary information.

  3. Click the Properties tab.

  4. Review the property groups and the properties listed for each protocol.


View asset interfaces

Use the Interfaces tab to review the interfaces that Cisco Cyber Vision identifies for a selected asset.

Assets use different network interfaces to communicate within the network. Interfaces may include MAC addresses, IP addresses, VLAN IDs, or combinations of these. The system collects interface properties from network traffic. It selects one interface as the primary interface for visualizations.

The Interfaces tab shows all interfaces for the asset, including the primary and additional interfaces. If multiple interfaces are available, you can change which interface is designated as the primary interface.

Follow these steps to view asset interfaces.

Procedure

  1. From the main menu, select Assets.

    The Assets page lists all available assets.

  2. Select the asset you want to review.

    The Summary tab opens and shows the asset metadata in the left pane.

  3. In the left pane, review the Primary Interface details.

  4. To view every interface detected for the asset, select the View all < > interfaces link under Primary Interface .

    The Interface tab opens and lists the primary and additional interfaces.

  5. To designate a different primary interface, locate the Primary Interface column and select the interface you want to use.


Add custom properties to an asset

Custom properties feature allows you to add any custom property without content limitation on assets apart from current asset information.

Add custom properties such as:

  • owner name,

  • email, or

  • contact number

to individual assets for enhanced metadata management and operational efficiency.

Asset-level custom properties allow you to include information that is not inherited from the network, giving you granular control over asset metadata.

You cannot edit custom properties that you set for a network from the assets. Setting the custom property value at the network level overrides the value set at the asset level.

Before you begin

  • Ensure you have the Assets permission with read/write access.

Procedure

  1. From the main menu, click Assets.

  2. Click the asset that you want to add custom properites to.

  3. On Custom Properties, click Add/Edit.

  4. Enter a custom key and its corresponding value.

    Example:

    To add an owner name for an asset, set the key to "Owner" and the value to the owner's name.

    To add multiple custom properties, repeat this step for each key-value pair.

  5. Click Save.


External communications in the New UI

The system classifies and displays external communications in the New UI using specific criteria.

Criteria for classifying external communications

External communication appears in the New UI when:

  • The communication is to or from networks that are explicitly marked as External in the New UI.

  • If no external networks are defined (in the New UI under Configuration > Network Definition), any communication not assigned to an IT Internal or OT Internal network counts as external communication.


View external communications for an asset

Enable you to identify and analyze all external connections for a chosen asset.

Use this task to determine which external resources a specific asset interacts with, and to analyze communication details for monitoring or auditing.

Procedure

  1. From the main menu, select Assets.

  2. Click your asset that has external communications.

  3. Open the Communications tab for the selected asset..

  4. In the All Communications filter, select External to display only external communications in either map or list view.

All external communications associated with the selected asset are displayed, including details about each connection.


Filters and map indicators for monitoring external communications

Visualization and monitoring

When you visualize external communications, you can identify unexpected network paths that might expose your organization to external threats. Available filters for external connections include:

  • Country: Displays the country identified for the IP.

  • ASN: Displays unique ID assigned to a network or a group of networks managed by a single organization.

  • ASN Organization: Displays the origin organization that initiated the external communication.

Note
  • Country, ASN, and ASN Organization details are available only if your local center is enrolled in Cyber Vision Site Manager (CVSM) and an active cloud connection with Cisco exists.

  • In asset communications:

    • List view: The ASN and ASN Organization columns are disabled by default.

    • Map view: If external communications are available, the ASN Info field appears. It shows details for external communications (disabled by default).

Table 5. External communication indicators in map view

Visual indicators

Description

Single circle outside the node

Indicates one remote address communicating with your asset.

Multiple circles outside the node

Indicates that multiple remote addresses communicate with your asset.

Globe icon on the node

Indicates that IP to country mapping is unavailable or multiple countries are involved.

Node displays country's flag

Indicates that a single country has been identified.

Question mark icon in the node

Indicates an IP address without country mapping. The country column in list view shows Unknown. Some IPs cannot be resolved to a country based on available data feeds.