Cisco IoT Device Manager Installation and User Guide, Release 5.x
Bias-Free Language
The documentation set for this product strives to use bias-free language. For the purposes of this documentation set, bias-free is defined as language that does not imply discrimination based on age, disability, gender, racial identity, ethnic identity, sexual orientation, socioeconomic status, and intersectionality. Exceptions may be present in the documentation due to language that is hardcoded in the user interfaces of the product software, language used based on RFP documentation, or language that is used by a referenced third-party product. Learn more about how Cisco is using Inclusive Language.
This chapter explains how to use the Device Manager to perform tasks on the Cisco 500 WPAN Industrial Router (IR500).
Connecting to the IR500
You can use Device Manager in the following ways:
Operating with IoT-FND—When you have IoT-FND operating in the network, you can connect to that system with Device Manager
to download and update work orders. Work orders allow Device Manager to view status and perform tasks on the IR500. To operate
in conjunction with IoT-FND, follow the steps in Setting Up the IoT-FND Connection.
Operating without IoT-FND—When you do not have IoT-FND operating in the network or do not want to connect to that system,
use Device Manager to connect directly to an IR500 to view status.
Note
When connecting to the IR500 without a work order, you cannot change the device configuration or send data to IoT-FND.
Note
The laptop running Device Manager must be directly connected to the IR500.
Before connecting to the router with a work order, you should be familiar with the information in Managing Work Orders.
To connect to the router with a work order, select a work order from the list on the Device Manager opening page and click
Connect.
Connecting to the IR500 Without a Work Order
SUMMARY STEPS
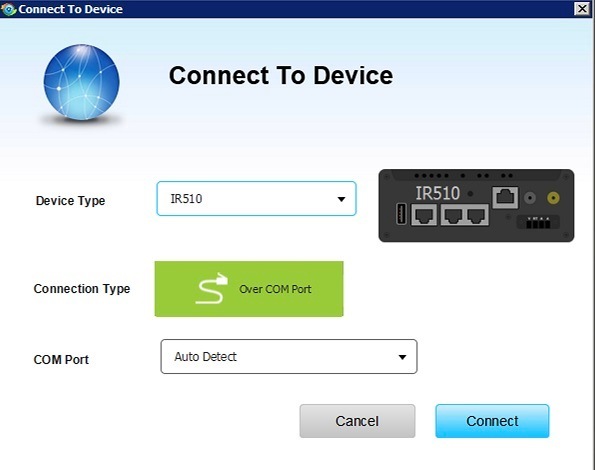
On the Device Manager opening page, click ConnectWithoutWorkOrder.
In the Connect to Device dialog box, select the Device Type: IR500.
Select the Over COM port or Over Ethernet.
Click Connect. The Device Manager main page appears.
DETAILED STEPS
Step 1
On the Device Manager opening page, click ConnectWithoutWorkOrder.
Step 2
In the Connect to Device dialog box, select the Device Type: IR500.
Step 3
Select the Over COM port or Over Ethernet.
Step 4
Click Connect. The Device Manager main page appears.
Viewing Settings and Status
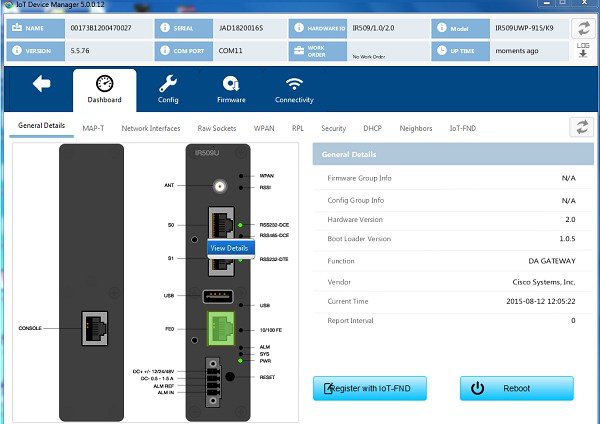
You can view details about IR500 settings and status from the subtabs of the Dashboard.
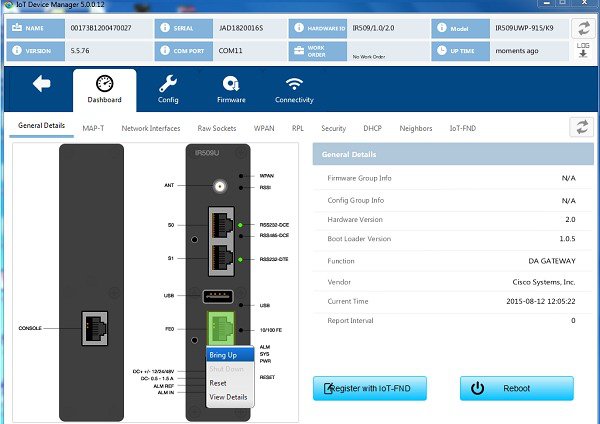
General Details
To view General Details:
SUMMARY STEPS
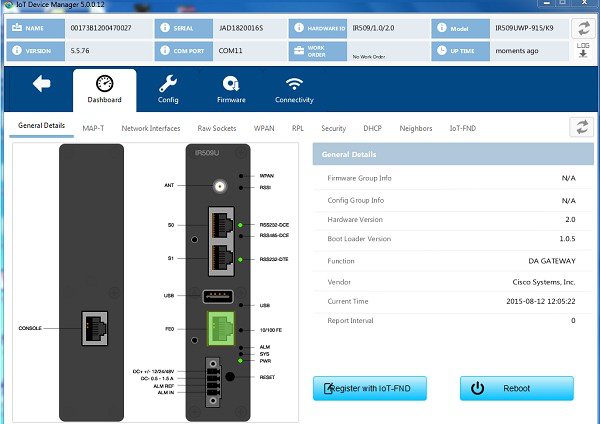
On the Device Manager main page (Dashboard), click the GeneralDetails sub-tab.
View the General Details:
DETAILED STEPS
Step 1
On the Device Manager main page (Dashboard), click the GeneralDetails sub-tab.
Step 2
View the General Details:
Firmware Group Info: The name of the firmware group that IoT-FND uses to upload and install firmware images on member devices.
Config Group Info: The configuration group that IoT-FND uses to manage devices in bulk. The default config group for the DA
Gateway is default-ir500.
Hardware Version: The hardware version of the device.
Boot Loader Version: The boot loader image version.
Function: The function of the device in the Resilient Mesh network. The function of the IR500 is DA Gateway.
Vendor: The manufacturer of this device.
Current Time: The current date and time. The IR500 has a real-time clock that maintains the current time.
Report Interval: The number of seconds between data updates. By default, Mesh Endpoints (MEs) send a new set of metrics to
IoT-FND every 28,800 seconds (8 hours).
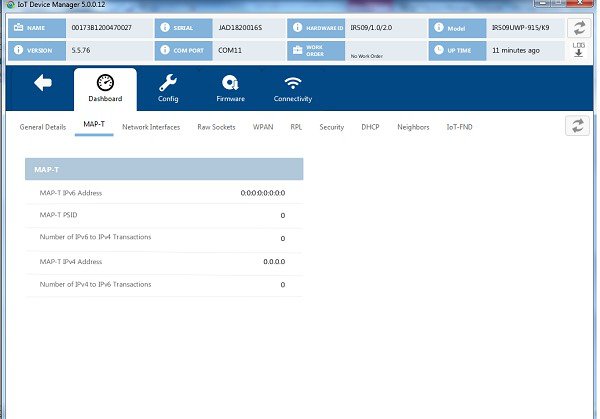
MAP-T
To view MAP-T information:
SUMMARY STEPS
On the Device Manager main page (Dashboard), click the MAP-T sub-tab.
View the MAP-T settings and statistics:
DETAILED STEPS
Step 1
On the Device Manager main page (Dashboard), click the MAP-T sub-tab.
Step 2
View the MAP-T settings and statistics:
MAP-T IPv6 Address: Contains the IPv4 address used by devices external to the MAP-T domain to communicate with the IR500 Raw
Socket over Serial and Ethernet ports.
MAP-T PSID: The port-set ID (PSID) that algorithmically identifies a set of ports exclusively assigned to the IR500.
Number of IPv6 to IPv4 Transactions: The number of IPv6 to IPv4 address translations.
MAP-T IPv4 Address: IPv4 address used by IPv4 devices and applications outside the MAP-T domain to communicate with Raw Socket
over Serial and Ethernet attached devices.
Number of IPv4 to IPv6 Transactions: The number of IPv4 to IPv6 address translations.
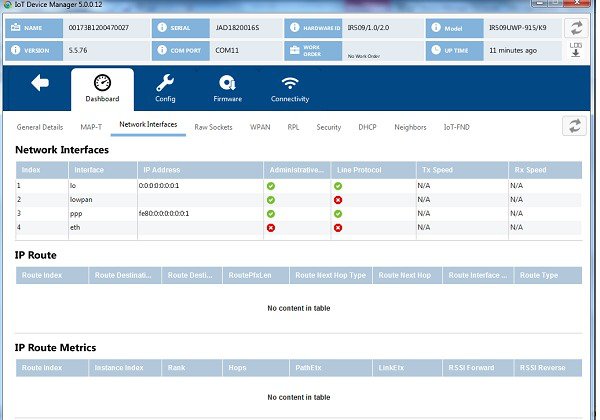
Network Interfaces
To view information for Network Interfaces:
SUMMARY STEPS
On the Device Manager main page (Dashboard), click the NetworkInterfacessub-tab.
In the Network Interfaces area, view the settings and status for the IR500 interfaces:
In the IP Route area, view the IP route information. This table describes a particular IP route (identified by the index)
attached to an interface.
In the IP Route Metrics area, view the IP Route IPv6 Routing Protocol for Low-Power and Lossy Networks (RPL) metrics. The
Route Index corresponds to the same index in the IP Route table.
DETAILED STEPS
Step 1
On the Device Manager main page (Dashboard), click the NetworkInterfacessub-tab.
Step 2
In the Network Interfaces area, view the settings and status for the IR500 interfaces:
Index: Identifies the interface.
Interface: Name of the IR500 interface.
IP Address: IP address assigned to the interface.
Administrative Status: When the administrative status for an interface is administratively up , the interface was brought up by the administrator. When the administrative status for an interface is down , the interface was taken down by the administrator.
Line Protocol: When the line protocol for an interface is up , the line protocol is currently active. When the line protocol for an interface is down , it means the line protocol is not active.
Tx Speed: Transmit speed.
Rx Speed: Receive speed.
Step 3
In the IP Route area, view the IP route information. This table describes a particular IP route (identified by the index)
attached to an interface.
Route Index
Route Destination Type
Route Destination
Route PfxLen: Route Prefix Length
Route Next Hop Type
Route Next Hop
Route Interface Index
Route Type
Route Proto
Route Age
Step 4
In the IP Route Metrics area, view the IP Route IPv6 Routing Protocol for Low-Power and Lossy Networks (RPL) metrics. The
Route Index corresponds to the same index in the IP Route table.
Route Index: Identifies the route.
Instance Index: Identifies the instance.
Rank: The node's individual position relative to other nodes with respect to a DODAG root. Rank is computed based on the Objective
Function (OF) of the Directed Acyclic Graph (DAG). The Rank may analogously track a simple topological distance, be calculated
as a function of link metrics, and consider other properties such as constraints. [rfc6550]
Hops: Hop count.
PathEtx: Expected transmission count of the path. [rfc6550 and rfc6719]
LinkEtx: Expected transmission count of the link. [rfc6550 and rfc6719]
RSSI Forward: Forward Received Signal Strength Indicator (RSSI) value.
RSSI Reverse: Reverse RSSI value.
LQI Forward: Forward Link Quality Indicator (LQI) value.
LQI Reverse: Reverse LQI value.
Dag Size: Size of the DAG. [rfc6550]
Phase: Electric power phase.
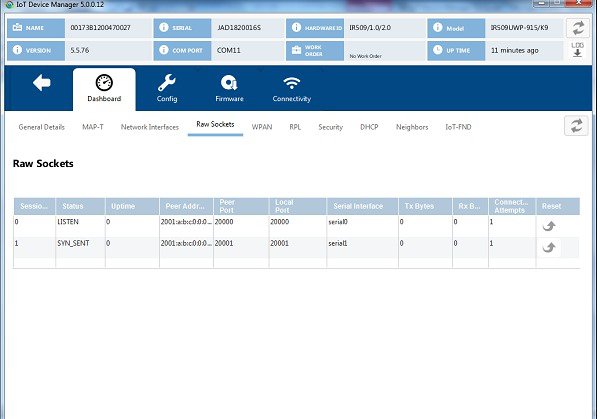
Raw Sockets
To view information about Raw Sockets:
SUMMARY STEPS
On the Device Manager main page (Dashboard), click the RawSocketssub-tab.
View the raw socket settings and statistics:
DETAILED STEPS
Step 1
On the Device Manager main page (Dashboard), click the RawSocketssub-tab.
Step 2
View the raw socket settings and statistics:
Session Index: Identifies the session.
Status: The status of the raw socket connection.
Uptime: The length of time that the connection has been up.
Peer Address: IP address of the host connected to the device.
Peer Port: The port number of the client/server connected to the device.
Local Port: The port that either the server listens to for connections (in Server Socket Mode), or to which the client binds
to initiate connections to the server (in Client Socket Mode).
Serial Interface: The name of the serial interface configured for raw socket encapsulation.
Tx Bytes: Number of bytes sent over the raw socket connection.
Rx Bytes: Number of bytes received over the raw socket connection.
Connection Attempts: Number of times that a raw socket client attempted a connection.
Click Reset to reset counters to zero.
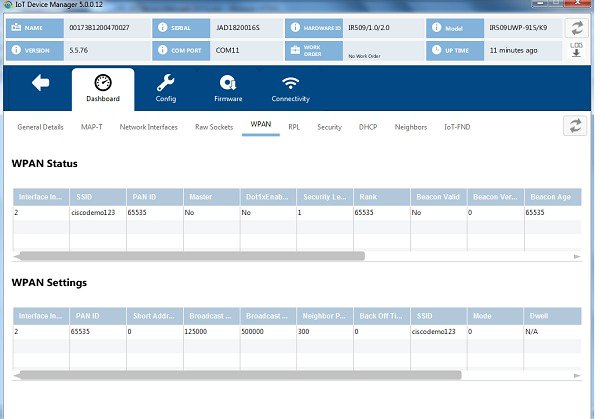
WPAN
To view information about WPAN:
SUMMARY STEPS
On the Device Manager main page (Dashboard), click the WPANsub-tab.
View the following information in the WPAN Status area:
View the following information in the WPAN Settings area:
DETAILED STEPS
Step 1
On the Device Manager main page (Dashboard), click the WPANsub-tab.
Step 2
View the following information in the WPAN Status area:
Interface Index: Identifies the WPAN interface.
SSID: Service Set Identifier (SSID) used to differentiate networks.
PAN ID: Personal Area Network Identifier (PAN ID) used to differentiate WPANs.
Master: Whether the endpoint is master (yes/no).
Dot1xEnabled: Whether the 802.1x protocol is enabled.
Security Level: Level of security corresponding to the protection offered (0–2).
Rank: The node's individual position relative to other nodes with respect to a DODAG root. Rank is computed based on the DAG's
Objective Function (OF). The Rank may analogously track a simple topological distance, be calculated as a function of link
metrics, and consider other properties such as constraints. [RFC6550]
Beacon Valid: The validity of the beacon according to the beacon's age.
Beacon Version: The beacon's version from the FAR.
Beacon Age: Parameter related to the time interval received beacon.
Tx Power: The device current transmission power.
Metric: The value calculated by rank / the weight value of the rank + size / the weight value of the PAN size.
Last Changed: The time (in hundredths of a second) since the device changed the PAN.
LastChangedReason: The reason that the device updated the PAN.
Demo Mode Enabled: Whether enable demo mode is enabled.
TxFec: Whether forward error correction (FEC) is enabled.
Step 3
View the following information in the WPAN Settings area:
Interface Index: Identifies the WPAN interface.
PAN ID: Personal Area Network Identifier (PAN ID) used to differentiate WPANs.
Short Address: 16-bit node identifier.
Broadcast Slot Size: Slot size of the broadcast.
Broadcast Period: Period of the broadcast.
Neighbor Probe Rate:
Back Off Timer: Timer for back off algorithm.
SSID: Service Set Identifier (SSID) used to differentiate networks.
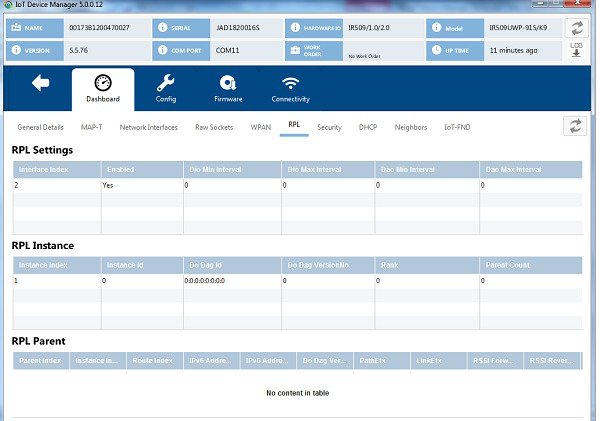
On the Device Manager main page (Dashboard), click the RPLsub-tab.
View the following information in the RPL Settings area:
View the following information in the RPL Instance area:
View the following information in the RPL Parent area:
DETAILED STEPS
Step 1
On the Device Manager main page (Dashboard), click the RPLsub-tab.
Step 2
View the following information in the RPL Settings area:
Interface Index: Identifies the interface.
Enabled: Whether the RPL protocol is enabled.
Dio Min Interval: Minimum DODAG Information Object (DIO) interval in RPL protocol.
Dio Max Interval: Maximum DIO interval in RPL protocol.
Dao Min Interval: Minimum Destination Advertisement Object (DAO) interval in RPL protocol.
Dao Max Interval: Maximum DAO interval in RPL protocol.
Step 3
View the following information in the RPL Instance area:
Instance Index: Identifies the RPL instance.
Instance Id: Identifies an RPL instance, which is a set of one or more DODAGS. [RFC6550]
Dodag Id: Identifies the DODAG root. The DODAGID is unique within the scope of a RPL instance in the LLN.
Dodag VersionNo: A sequential counter that is incremented by the root to form a new DODAG version.
Rank: The node's individual position relative to other nodes with respect to a DODAG root. Rank is computed based on the DAG's
Objective Function (OF). The Rank may analogously track a simple topological distance, be calculated as a function of link
metrics, and consider other properties such as constraints. [RFC6550]
Parent Count:
Step 4
View the following information in the RPL Parent area:
Parent Index: Identifies the parent.
Instance Index: Identifies the instance.
Route Index: Identifies the route.
IPv6 Address Local: Unique local IPv6 address of the parent.
IPv6 Address Global: IPv6 global unicast address of the parent.
Dodag VersionNo: A sequential counter that is incremented by the root to form a new DODAG version.
PathEtx: Expected transmission count of the path. [rfc6550]
LinkEtx: Expected transmission count of the link. [rfc6550]
RSSI Forward: Forward Received Signal Strength Indicator (RSSI) value.
RSSI Reverse: Reverse RSSI value.
LQI Forward: Forward Link Quality Indicator (LQI) value.
LQI Reverse: Reverse LQI value.
Hops: Hop count.
Security
To view information about IEEE 802.1x for WPAN authentication and encryption:
SUMMARY STEPS
On the Device Manager main page (Dashboard), click the Securitysub-tab.
View the information in the Ieee8021x Status area:
View the information in the Ieee8021x Settings area:
View the information in the Ieee80211i Status area:
DETAILED STEPS
Step 1
On the Device Manager main page (Dashboard), click the Securitysub-tab.
Step 2
View the information in the Ieee8021x Status area:
Index: Identifies the network.
Enabled: Whether 802.1x authentication is enabled.
Identity: Subject of the X.509 digital certificate.
State: Current state of Transport Layer Security (TLS).
PMK Id: Pairwise Master Key identifier.
Client Certificate:
CA Certificate: Certificate Authority (CA) certificate
Private Key: Encryption/decryption key.
Rly Pan Id: Reply PAN ID.
Rly Address: Reply address.
Rly Last Heard: Time of last heard reply.
Step 3
View the information in the Ieee8021x Settings area:
Index: Identifies the network.
SecMode: The security mode in use.
Minimum Auth Interval: The minimum authentication interval.
Maximum Auth Interval: The maximum authentication interval.
Immediate: Request authentication immediately.
Step 4
View the information in the Ieee80211i Status area:
Interface Index: Identifies the interface.
Enabled: Whether the 80211i protocol is enabled.
Pmk Id: Pairwise Master Key identifier.
Ptk Id: Pairwise Transient Key identifier.
Gtk Index: Identifies the Group Temporal Key.
Gtk Refresh:
Gtk List: Group Temporal Key list.
Gtk Lifetimes:
Auth Address: Authenticator server address.
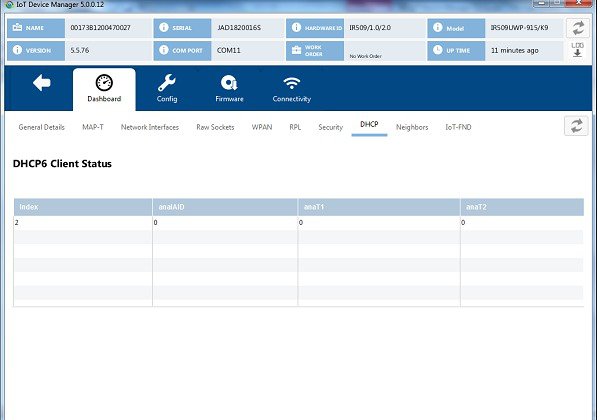
DHCP
To view information about DHCPv6 for IPv6 address allocation:
SUMMARY STEPS
On the Device Manager main page (Dashboard), click the DHCPsub-tab.
View the DHCP Client Status:
DETAILED STEPS
Step 1
On the Device Manager main page (Dashboard), click the DHCPsub-tab.
Step 2
View the DHCP Client Status:
Index: Identifies the network.
anaIAID: Interface Association Identifier.
anaT1: Preferred-lifetime.
anaT2: Valid-lifetime.
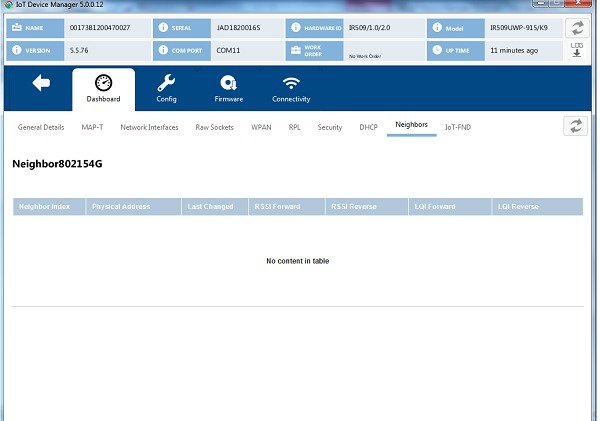
Neighbors
To view 802.15.4g neighbor information:
SUMMARY STEPS
On the Device Manager main page (Dashboard), click the Neighborssub-tab.
View the neighbors settings and statistics:
DETAILED STEPS
Step 1
On the Device Manager main page (Dashboard), click the Neighborssub-tab.
Step 2
View the neighbors settings and statistics:
Neighbor Index: Identifies the neighbor
Physical Address: The 64-bit Extended Unique Identifier (EUI-64) of the device.
Last Changed: The time (in hundredths of a second) since hearing from the neighbor.
RSSI Forward: Forward Received Signal Strength Indicator (RSSI) value.
RSSI Reverse: Reverse RSSI value.
LQI Forward: Forward Link Quality Indicator (LQI) value.
LQI Reverse: Reverse LQI value.
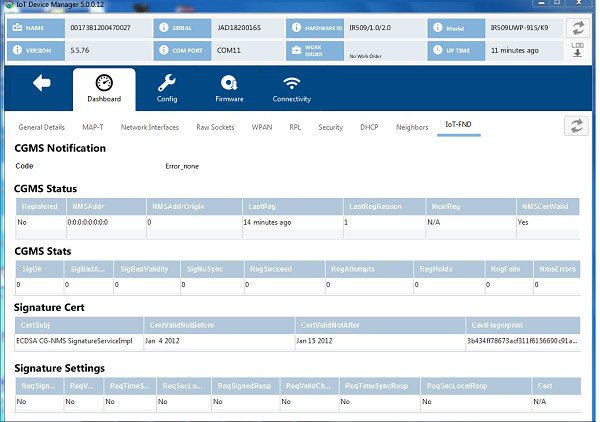
IoT-FND
To view information about IoT-FND:
SUMMARY STEPS
On the Device Manager main page (Dashboard), click the IoT-FNDsub-tab.
View the information in the CGMS notification area:
View CGMS Status information:
View CGMS Stats:
View Signature Cert information:
View the Signature Settings information:
DETAILED STEPS
Step 1
On the Device Manager main page (Dashboard), click the IoT-FNDsub-tab.
Step 2
View the information in the CGMS notification area:
Code Values:
1 = COAP Error
2 = Signature Error
3 = Registration Processing Error
Step 3
View CGMS Status information:
Registered: Whether the end point is registered with NMS.
NMSAddr: Address of NMS.
NMSAddrOrigin: Origin of NMS address.
LastReg: Last registration time.
LastRegReason: Reason for last registration.
NextReg: Time of next registration.
NMSCertValid: Whether the certificate is valid.
Step 4
View CGMS Stats:
SigOk: Count of verified signatures.
SigBadAuth: Count of bad authorized signatures.
SigBadValidity: Count of bad validity signatures.
SigNoSync: Count of signatures that are not synchronized.
RegSucceed: Count of successful registrations.
RegAttempts: Count of registration attempts.
RegHolds: Count of registration holds.
RegFails: Count of registration failures.
NmsErrors: Count of NMS errors.
Step 5
View Signature Cert information:
CertSubj: Certificate subject.
CertValidNotBefore: Certificate valid.
CertValidNotAfter: Certificate not valid.
CertFingerprint: Fingerprint of the certificate.
Step 6
View the Signature Settings information:
ReqSignedPost: Whether request signed post.
ReqValidCheckPost: Whether request valid check post.
ReqTimeSyncPost: Whether request time synchronization post.
ReqSecLocalPost: Whether request security local post.
ReqSignedResp: Whether request signed response.
ReqValidCheckResp: Whether valid check response.
ReqTimeSyncResp: Whether time synchronization response.
ReqSecLocalResp: Whether request security local response.
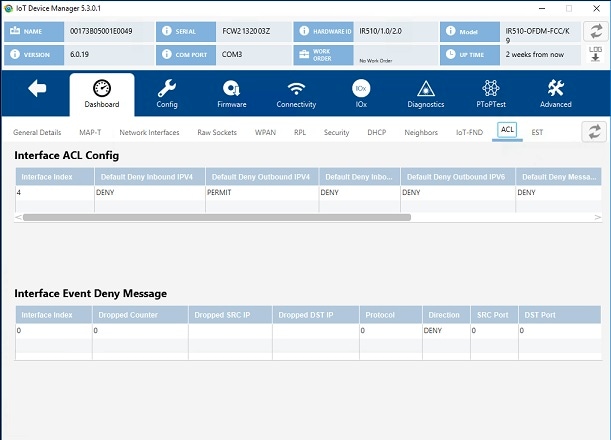
ACL
To view Access Control List (ACL) information:
SUMMARY STEPS
On the Device Manager main page (Dashboard), click the ACL sub-tab.
View the ACL settings and statistics:
DETAILED STEPS
Step 1
On the Device Manager main page (Dashboard), click the ACL sub-tab.
Step 2
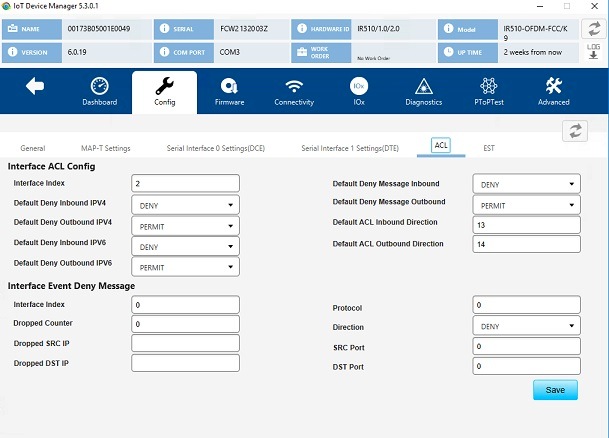
View the ACL settings and statistics:
Interface ACL Config
Interface Event Deny Message
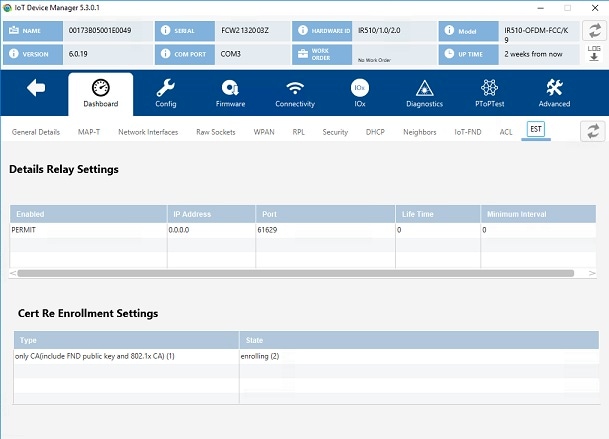
EST
To view Enrollment settings (EST) information:
SUMMARY STEPS
On the Device Manager main page (Dashboard), click the EST sub-tab.
View the EST settings and statistics:
DETAILED STEPS
Step 1
On the Device Manager main page (Dashboard), click the EST sub-tab.
Step 2
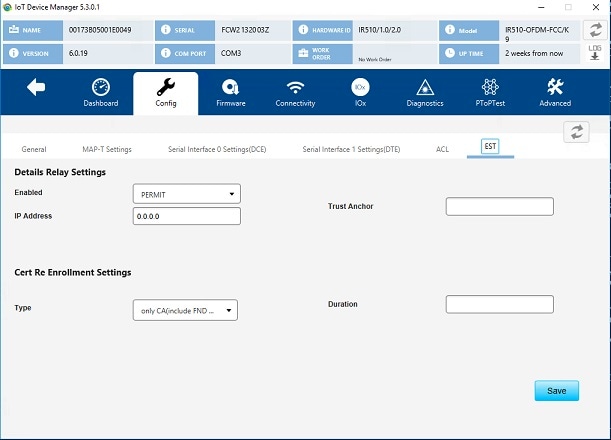
View the EST settings and statistics:
Details Relay Settings
Cert Re Enrollment Settings
Viewing Interface Details
You can view details for the Ethernet and the two serial interfaces from the Device Manager main page (Dashboard).
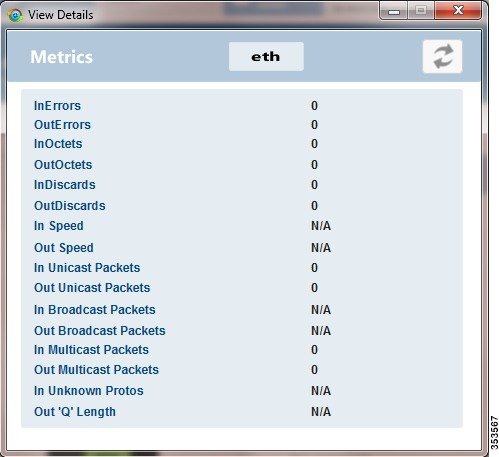
Ethernet Interface Details
To view details for the Ethernet interface:
SUMMARY STEPS
On the Device Manager main page, click the Ethernet port to display the popup menu and select ViewDetails.
To refresh the display, click the refresh icon in the upper right corner of the View Details window.
DETAILED STEPS
Step 1
On the Device Manager main page, click the Ethernet port to display the popup menu and select ViewDetails.
The View Details window displays the Ethernet metrics.
Step 2
To refresh the display, click the refresh icon in the upper right corner of the View Details window.
Serial Interface Details
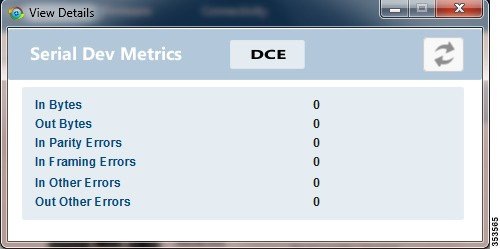
To view details for serial interface 0 (DCE) or serial interface 1 (DTE):
SUMMARY STEPS
On the On the Device Manager main page, click a serial port to display the popup menu and select ViewDetails.
To refresh the display, click the refresh icon in the upper right corner of the View Details window.
DETAILED STEPS
Step 1
On the On the Device Manager main page, click a serial port to display the popup menu and select ViewDetails.
The View Details window displays the DCE or DTE metrics.
Step 2
To refresh the display, click the refresh icon in the upper right corner of the View Details window.
Managing the Ethernet Interface
To bring up, shut down, or reset the Ethernet interface:
SUMMARY STEPS
On the Device Manager main page, click the Ethernet port to display the popup menu and select the operation you want to perform
on the interface: BringUp, ShutDown, or Reset.
In the confirmation dialog box that appears, click Yes to continue the operation.
DETAILED STEPS
Step 1
On the Device Manager main page, click the Ethernet port to display the popup menu and select the operation you want to perform
on the interface: BringUp, ShutDown, or Reset.
Step 2
In the confirmation dialog box that appears, click Yes to continue the operation.
Registering with IoT-FND
When you connect to the IR500 with a work order, the IR500 registers with IoT-FND. Registration notifies IoT-FND that the
device is on the network and provides a mechanism for pushing management configuration information to the device.
You can also manually cause the IR500 to re-register with IoT-FND for load balancing or delegation to specific sites. In this
case, IoT-FND redirects the IR500 to re-register with an alternate IoT-FND.
To register with IoT-FND, on the Device Manager main page (Dashboard), click RegisterwithIoT-FND. Device Manager displays messages to inform you of the redirection status.
Rebooting the IR500
To immediately reboot the IR500, on the Device Manager main page (Dashboard), click Reboot. Device Manager displays messages to inform you of the reboot status.
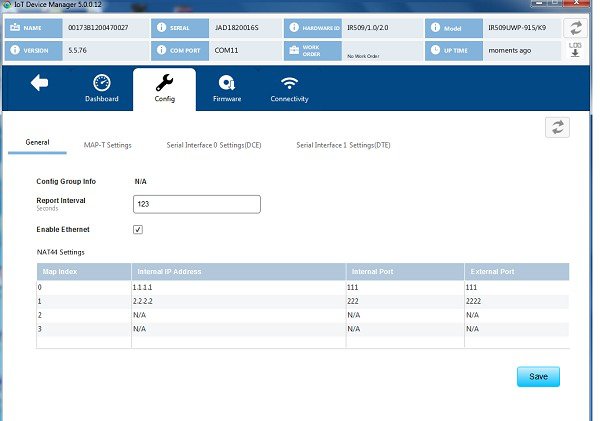
Changing the Configuration
You can view or change the following IR500 settings from the Config page:
To view or change general IR500 configuration settings:
SUMMARY STEPS
On the Device Manager main page, click the Config tab.
View or modify General settings:
Click Save.
DETAILED STEPS
Step 1
On the Device Manager main page, click the Config tab.
Step 2
View or modify General settings:
ConfigGroupInfo: The configuration group that IoT-FND uses to manage devices in bulk. The default config group for the DA Gateway is default-ir500.
ReportInterval: The number of seconds between data updates. By default, Mesh Endpoints (MEs) send a new set of metrics to IoT-FND every
28,800 seconds (8 hours).
EnableEthernet: Select this check box for IPv4 connectivity to devices and to enable NAT44 configuration.
NAT44Settings:
Map Index: Identifies the map.
Internal IP Address: The internal address of the NAT 44 configured device.
Internal Port: The internal port number of the NAT 44 configured device.
External Port: The external port number of the NAT 44 configured device.
Step 3
Click Save.
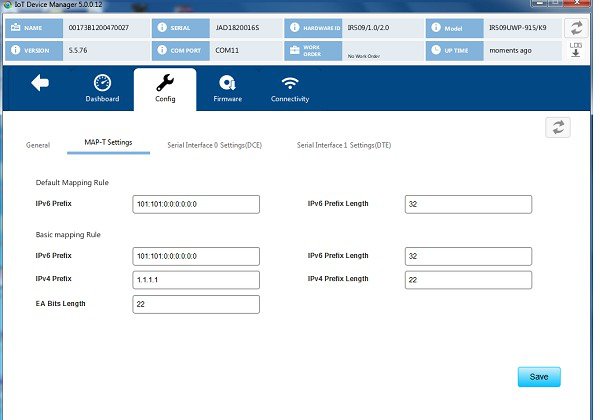
Changing MAP-T Settings
To view or change MAP-T configuration settings:
SUMMARY STEPS
On the Device Manager main page, click the Config tab.
Click MAP-TSettings and view or modify these settings:
Click Save.
DETAILED STEPS
Step 1
On the Device Manager main page, click the Config tab.
Step 2
Click MAP-TSettings and view or modify these settings:
Default Mapping Rule: These fields specify an IPv6 prefix used to address all destinations outside the MAP-T domain.
IPV6Prefix: IPv6 prefix used to embed any IPv4 addresses outside the MAP-T domain.
IPV6PrefixLength: Length of the IPv6 prefix used to embed any IPv4 addresses outside the MAP-T domain.
Basic Mapping Rule: These fields specify the IPv6 and IPv4 prefixes used to address MAP-T nodes inside the MAP-T domain.
IPV6Prefix: MAP-T IPv6 End-user prefix, which contains the MAP-T Basic Mapping Rule or MAP-T IPv6 prefix + the IPv4 suffix of the assigned
IPv4 address.
IPV4Prefix: IPv4 prefix that specifies the IPv4 subnet selected to address all IPv4 nodes in a MAP-T domain.
EABitsLength: Length of the IPv4 Embedded Address (EA) bits that indicates the length of the IPv4 suffix embedded in the MAP-T IPv6 End-user
IPv6 prefix.
IPV6PrefixLength: Length of the IPv6 prefix used to embed the IPv4 address of nodes inside the MAP-T domain.
IPV4PrefixLength: Length of the IPv4 prefix that specifies the IPv4 subnet selected to address all IPv4 nodes in a MAP-T domain.
Step 3
Click Save.
Changing Serial Interface 0 Settings (DCE)
To view or change the configuration for Serial Interface 0 (DCE):
SUMMARY STEPS
On the Device Manager main page, click the Config tab.
Click SerialInterface0Settings(DCE)and view or modify these settings:
View or modify settings for TCP Raw Socket Sessions:
Click Save.
DETAILED STEPS
Step 1
On the Device Manager main page, click the Config tab.
Step 2
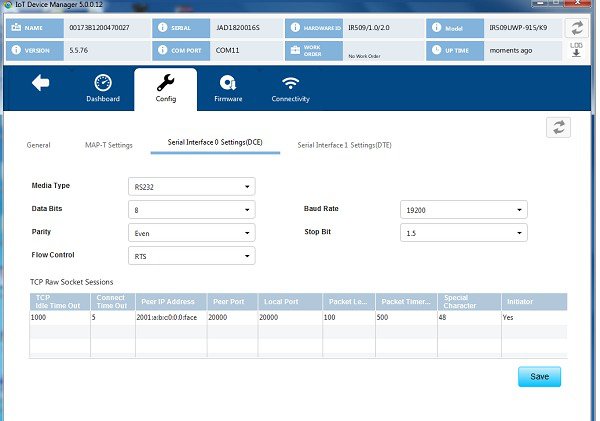
Click SerialInterface0Settings(DCE)and view or modify these settings:
MediaType: The serial interface type.
Disable
LoopBack
RS232
RS485 Full Duplex
RS485 Half Duplex
DataBits: Number of data bits per character. Default value is 8.
Parity: Odd or even parity for error detection. Default value is None.
FlowControl: The use of flow control on the line. Default value is None.
BaudRate: Data transmission rate in bits per second. Default value is 115200.
StopBit: The asynchronous line stop bit. Default value is 1.
Step 3
View or modify settings for TCP Raw Socket Sessions:
TCPIdleTimeOut: The time to maintain an idle connection.
ConnectTimeOut: TCP client connect timeout for Initiator DA Gateway devices.
PeerIPAddress: IP address of the host connected to the device.
PeerPort: Port number of the client/server connected to the device.
LocalPort: Port number of the device.
PacketLength: Maximum length of serial data to convert into the TCP packet.
PacketTimer(ms): The time interval between each TCP packet creation.
Special Character: The delimiter for TCP packet creation.
Initiator: Designates the device as the client/server.
Step 4
Click Save.
Changing Serial Interface 1 Settings (DTE)
To view or change the configuration for Serial Interface 1 (DTE):
SUMMARY STEPS
On the Device Manager main page, click the Config tab.
Click SerialInterface1Settings(DTE)and view or modify these settings:
View or modify settings for TCP Raw Socket Sessions.
Click Save.
DETAILED STEPS
Step 1
On the Device Manager main page, click the Config tab.
Step 2
Click SerialInterface1Settings(DTE)and view or modify these settings:
MedialType: The serial interface type.
Disable
LoopBack
RS232
RS485 Full Duplex
RS485 Half Duplex
Databits: The number of data bits per character. Default value is 8.
Parity: Odd or even parity for error detection. Default value is None.
FlowControl: The use of flow control on the line. Default value is None.
BaudRate: The data transmission rate in bits per second. Default value is 115200.
StopBit: The asynchronous line stop bit. Default value is 1.
Step 3
View or modify settings for TCP Raw Socket Sessions.
TCPIdleTimeOut: The time to maintain an idle connection.
ConnectTimeOut: TCP client connect timeout for Initiator DA Gateway devices.
PeerIPAddress: IP address of the host connected to the device.
PeerPort: Port number of the client/server connected to the device.
LocalPort: Port number of the device.
PacketLength: Maximum length of serial data to convert into the TCP packet.
PacketTimer(ms): The time interval between each TCP packet creation.
Special Character: The delimiter for TCP packet creation.
Initiator: Designates the device as the client/server.
Step 4
Click Save.
Changing ACL Settings
To view or change ACL configuration settings:
SUMMARY STEPS
On the Device Manager main page, click the Config tab.
Click the ACL tab and view or modify the settings.
Click Save.
DETAILED STEPS
Step 1
On the Device Manager main page, click the Config tab.
Step 2
Click the ACL tab and view or modify the settings.
Step 3
Click Save.
Changing EST Settings
To view or change EST settings:
SUMMARY STEPS
On the Device Manager main page, click the Config tab.
Click the EST tab and view or modify the settings.
Click Save.
DETAILED STEPS
Step 1
On the Device Manager main page, click the Config tab.
Step 2
Click the EST tab and view or modify the settings.
Step 3
Click Save.
Generating and Uploading Bootstrap Configuration
To generate and upload bootstrap configuration files, follow these steps:
Before you begin
From IoT Device Manager Release 5.5, you can generate and upload bootstrap configuration files to one or more IR510 devices
with Cisco Resilient Mesh Release 6.0 and later.
Procedure
Step 1
On the Device Manager main page, click the Config tab.
Step 2
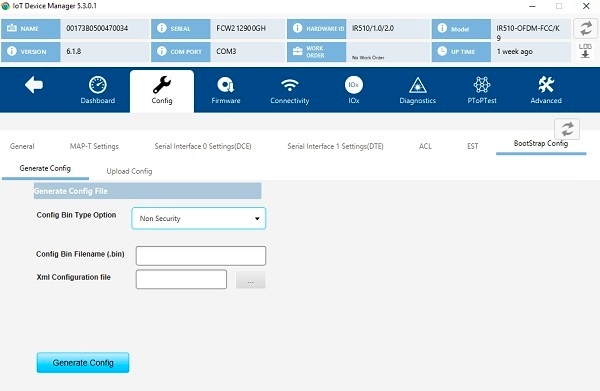
Click the BootStrap Config tab and then click the Generate Config subtab.
To generate non security bootstrap configurations, choose Non Security from the Config Bin Type Option drop-down list, enter the filename of the configuration bin to be generated, and browse to choose the XML configuration file
to be provided as input, as shown in the following figure.
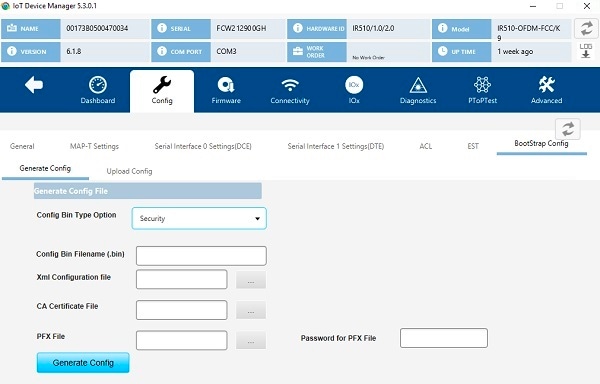
To generate security bootstrap configurations, choose Security from the Config Bin Type Option drop-down list, enter the filename of the configuration bin to be generated, browse to choose the XML configuration file
to be provided as input, the CA certificate file and PFX file, and enter the password for the PFX file, as shown in the following
figure.
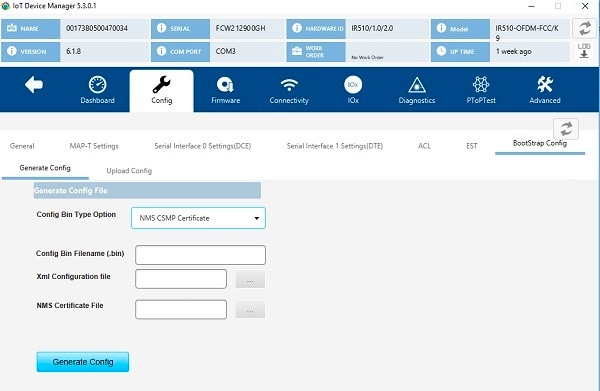
To generate bootstrap configuration with NMS CSMP certificate, choose NMS CSMP Certificate from the Config Bin Type Option drop-down list, enter the filename of the configuration bin to be generated, browse to choose the XML configuration file
to be provided as input and the NMS certificate file for connecting to FND, as shown in the following figure.
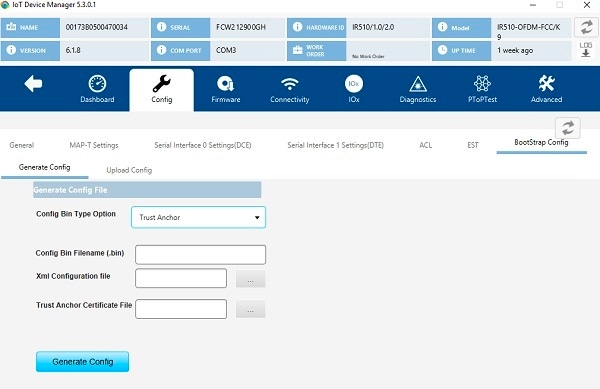
To generate bootstrap configuration with trustanchor for EST, choose Trust Anchor from the Config Bin Type Option drop-down list, enter the filename of the configuration bin to be generated, browse to choose the XML configuration file
to be provided as input and the Trust Anchor certificate file for EST, as shown in the following figure.
Step 3
Click the Generating Config button. The configuration bin file is created and a dialog box appears showing the location of
the created configuration bin file. If there are errors while creating the configuration bin file, the error is shown in the
dialog box.
Step 4
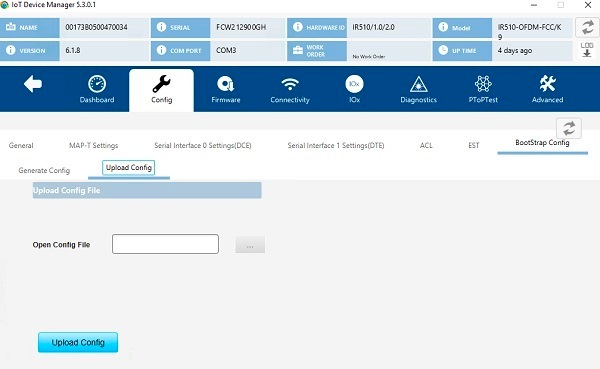
Click the Uplooad Config subtab.
Step 5
Browse to choose the location of the config bin file in the Open Config File field.
Step 6
Click the Upload Config button. The configuration bin file is executed in the device and a dialog box appears with a success
message. If there are any errors while executing the configuration bin file, the error is shown to in the dialog box.
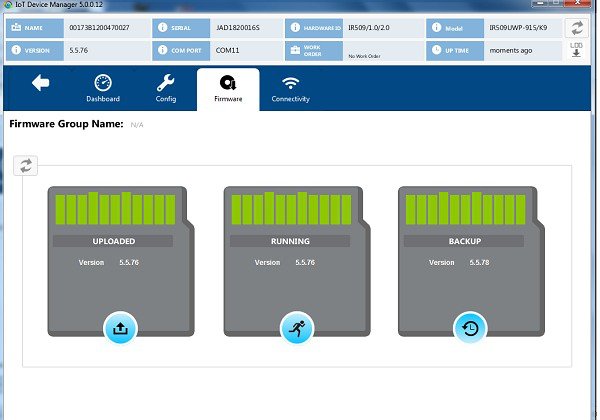
Updating the Firmware Image
Use the Firmware page to perform these tasks: upload an image, install an image, and set the backup.
Uploading an Image
To upload an image to the IR500:
SUMMARY STEPS
On the Device Manager main page, click the Firmwaretab.
On the left of the Firmware page, click the Upload icon and select an image to upload. The new image is stored on the IR500
until you are ready to install the image on the IR500. (See Installing an Image.)
In the dialog box that appears, click Yes to upload the selected image.
DETAILED STEPS
Step 1
On the Device Manager main page, click the Firmwaretab.
Step 2
On the left of the Firmware page, click the Upload icon and select an image to upload. The new image is stored on the IR500
until you are ready to install the image on the IR500. (See Installing an Image.)
Step 3
In the dialog box that appears, click Yes to upload the selected image.
Installing an Image
To install an uploaded image on the IR500:
SUMMARY STEPS
On the Device Manager main page, click the Firmwaretab.
In the middle of the Firmware page, click the Install icon.
In the dialog box that appears, click Yes to install the image on the IR500.
In the dialog box that appears after the installation is completed, click SaveResults or OK.
DETAILED STEPS
Step 1
On the Device Manager main page, click the Firmwaretab.
Step 2
In the middle of the Firmware page, click the Install icon.
Step 3
In the dialog box that appears, click Yes to install the image on the IR500.
If you did not previously upload an image to install, Device Manager displays the Upload to Device dialog box for you to upload
an image.
After you confirm the installation, the image installs automatically on the device. No manual reboot is required.
Step 4
In the dialog box that appears after the installation is completed, click SaveResults or OK.
Setting the Backup
To set the running image as the backup image:
SUMMARY STEPS
On the Device Manager main page, click the Firmwaretab.
On the right of the Firmware page, click the Set Backup icon.
In the dialog box that appears, click Yes.
DETAILED STEPS
Step 1
On the Device Manager main page, click the Firmwaretab.
Step 2
On the right of the Firmware page, click the Set Backup icon.
Step 3
In the dialog box that appears, click Yes.
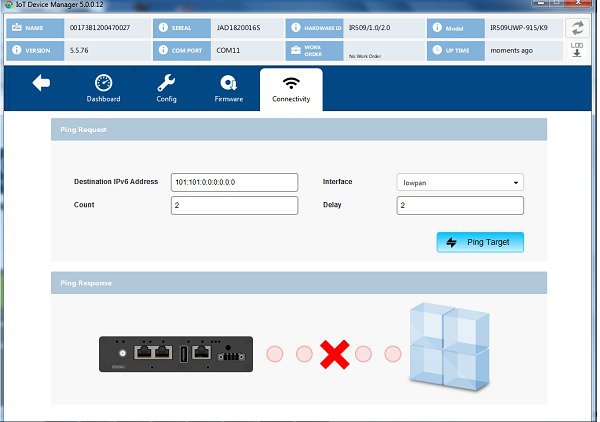
Testing Connectivity
Use the Connectivity page to test connectivity to a target with an IPv6 address. You can test connectivity of the Ethernet
or 6LoWPAN interface.
To test connectivity:
SUMMARY STEPS
On the Device Manager main page, click the Connectivitytab.
Configure the Ping Request settings:
Click PingTarget.
DETAILED STEPS
Step 1
On the Device Manager main page, click the Connectivitytab.
Step 2
Configure the Ping Request settings:
DestinationIPv6Address:IPv6 address of the ping target
Interface:
eth: Ethernet.
lowpan:6LoWPAN.
Count: Number of ping requests to send (0 to 9).
Delay: Number of seconds to wait between sending each request (0 to 9).
Step 3
Click PingTarget.
A dialog box appears indicating that the IR500 is attempting to ping the target IPv6 address. When the IR500 successfully
pings the target, the Ping Response area of the Connectivity page displays a green check mark. If the ping is unsuccessful,
the response area displays a red X.
To see the contents of the ping response message as a tooltip, hover over the icon for the target device.
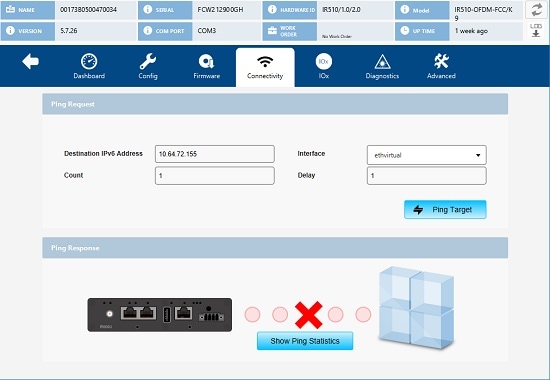
Ping Test Enhancement on IR510
Under Connectivity tab, Show Ping Statistics is supported for IR510. On clicking this button, a dialog box will be displayed to show the details of the ping operation
performed. This function is disabled by default. Once the Ping operation is completed, the Show Ping Statistics button will be enabled.
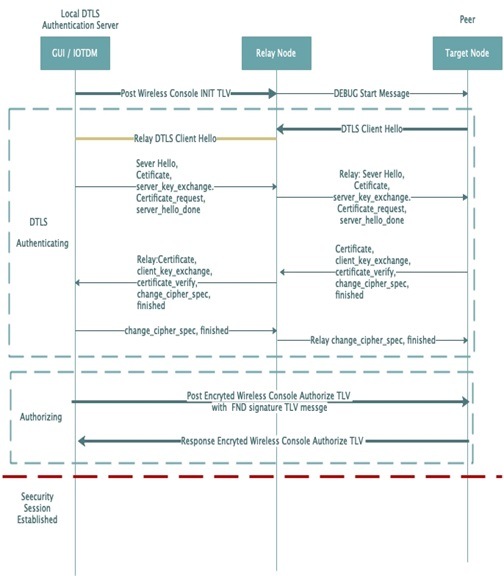
Offline Authorization—FTT Secured Wireless Console for IR510
In IoT-Device Manager Release 5.6, an authorization security procedure is introduced
between IoT-DM FTT wireless console and target node (IR510) by using wireless console
authorize TLV 342. Currently, FTT wireless console session with target nodes from IoT-DM
is validating the connection by following an authentication procedure through DTLS
certificates. However, DTLS channel is suspectable for various security attacks
(man-in-the-middle, Denial of Service attacks, and so on) as well as security
vulnerabilities. This feature will ensure the target node to connect and process the
request from a legible source. As part of this feature, IoT-DM will receive signed
authorization TLV 342 message byte array from FND through work order. IoT-DM will send
the authorization message to target after the successful post operation of TLV 341 to
the neighboring target node and DTLS secure channel establishment. Based on the
authorization response received from target node, IoT-DM will process the same and start
the wireless console session with supported authorized TLV's. This way the device node
will execute only the communicated authorize TLV commands.
Note
This feature cannot work when IR510 is connected to COM port or connected
without work order option.
IPV4 connectivity from IoT-DM to relay node is not supported.
Management command is not supported.
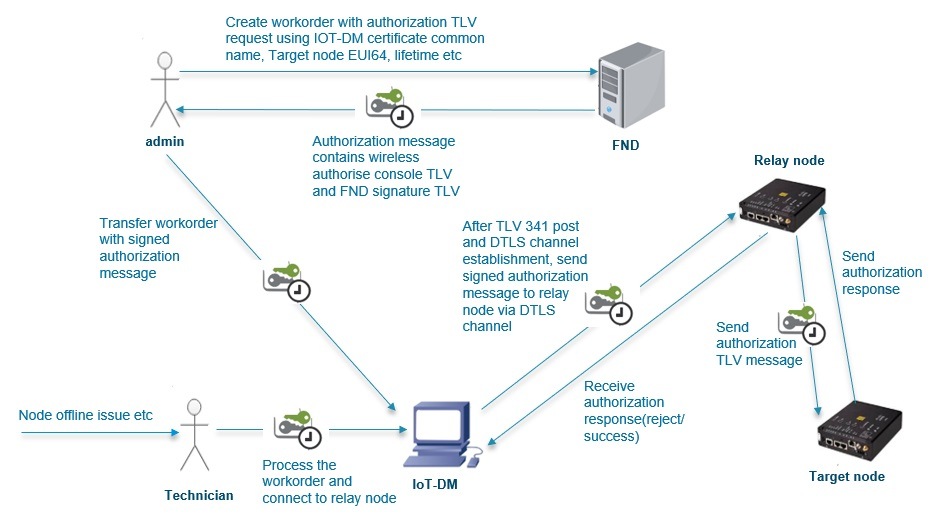
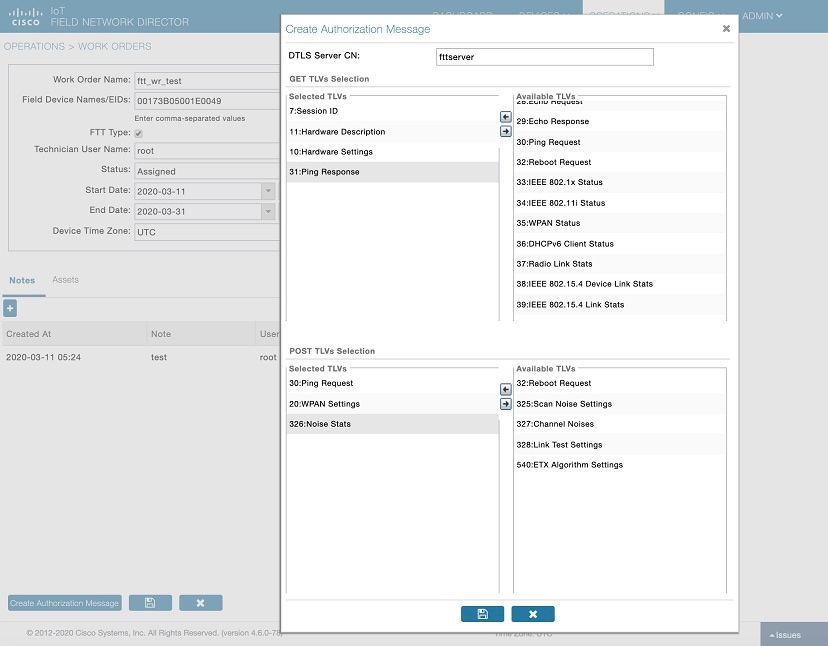
As shown in the following figures, the FND admin creates the work order with
authorization message which contains wireless authorize console TLV and FND signature
TLV and the same will be assigned to IoT-DM. You need to connect to the device through
the respective work order. While starting the wireless console, IoT-DM will transfer the
authorization message to the target after establishing the DTLS channel. Target node
validates the same and send the response to the IoT-DM and IoT-DM process the response.
If it is a successful response, IoT-DM will perform a get TLV 342 operation and based on
the get response TLV command execution session start with supported TLV's list received
as part of TLV 342 get request.
Figure 3. Authorization TLV Message Procedure
Figure 4. Authorization Message Request Procedure Between IoT-DM and Target Node
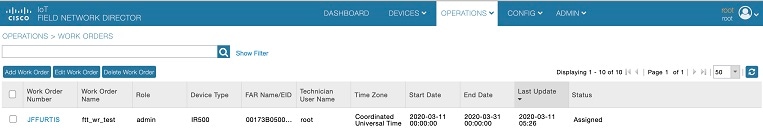
FND will send a work order with its type, whether it is FTT or Non-FTT work order. After
Sync up with FND, IoT-DM will list the work order with the type parameter in the work
order table. If you want to enable the FTT feature, you need to choose the respective
work order type.
Prerequisites
SSM[CSMP] service should be up and running in FND. You should be able to download
CSMP certificate from UI [Admin -> certificates -> certificate for CSMP].
Target node EID should be present in the FND endpoint.
Configure IPv6 address on relay node ethernet interface and then program it with
security mode enabled.
Sample Relay node configuration: decxu_sec.xml
Import FTT.keystore into IOT-DM which contains the following
three certificates with alias of ca_cert, server_cert, server.key:
1. root_ca_ec.crt—Root CA’s public key, for verifying the client certificate.
2. server_ec.crt—DTLS server’s certificate signed by root CA’s private key for
TLS handshake. Client will use the root CA’s public key to verify it.
3. server_pk8.key—DTLS server’s private key, for representing himself in TLS
handshake.
Program the Target node with following certificates, keys and config.xml:
1. root_ca_ec.der—Root CA’s public key. (Same Root CA certificate is used, but it
is converted in to der format.)
2. client_ec.der —Generate CSR in any linux and get it signed by root CA’s
private key and convert into der format.
3. client_pk8.der—Generate private key in pkcs8 standard and convert into der
format.
4. nms_ec.der— Export the CSMP certificate (SSM cert) from FND and convert into
der format.
5. decxu_sec.xml—Same as relay node enable security mode and config.xml
properties should be the same as relay xml config SSID, phy-mode, TX power
ReqSignedPost, and ReqValidCheckPost
Take backup of following two files:
/opt/cgms/standalone/configuration/standalone.xml and standalone-cluster.xml
Update the generated vault tags in
/opt/cgms/standalone/configuration/standalone.xml or standalone-cluster.xml
file.
service cgms restart
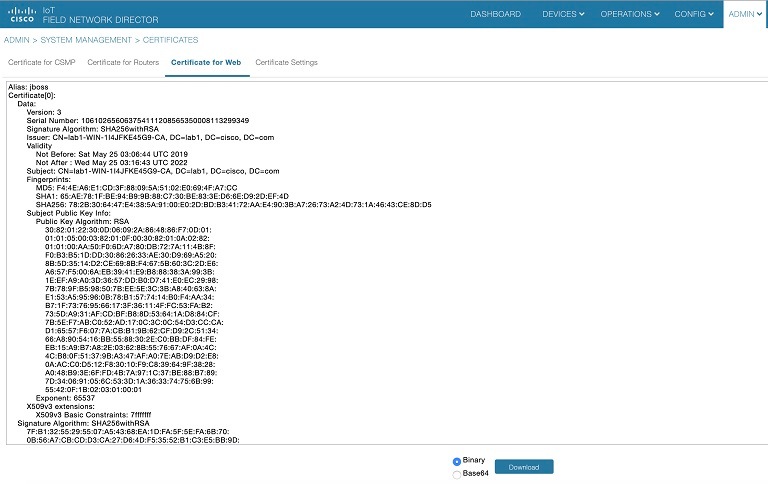
When FND comes up, check for the updated custom certificate either through
browser view certificate or through login to FND and choose Admin → Certificate
→ Certificate For Web.
SSM Certificate Installation Steps for FND (Import jboss Certificate Into SSM Web
Keystore)
#################################################
Default SSM Passwords and alias name:-
ssm_csmp_keystore password : ciscossm
csmp alias name : ssm_csmp
key password : ciscossm
ssm_web_keystore password: ssmweb
#################################################
Download and install the ssm rpm in your FND
server:
rpm -ivh <cgms-ssm-4.6.0-*.x86_64.rpm>
Login to FND
GUI:
Admin -> certificates -> certificate for web
Download the Binary version of "Certificate for Web" from the FND GUI. Save the
downloaded file in CGMS under the following path /opt/certForWeb.bin.
Stop the CGMS and SSM service:
service ssm stop
service cgms stop
Copy the ssm port and password in cgms.properties:
cd /opt/cgms-ssm/bin/
./ssm_setup.sh
Enter your choice : 5.    [Print CG-NMS configuration for SSM]
Enter current ssm_csmp_keystore password : <ciscossm>
Enter alias name : <ssm_csmp>
Enter key password : <ciscossm>
Example:
security-module=ssm
ssm-host=<Replace with IPv4 address of SSM server>
ssm-port=8445
ssm-keystore-alias=ssm_csmp
ssm-keystore-password=NQ1/zokip4gtUeUyQnUuNw==
ssm-key-password=NQ1/zokip4gtUeUyQnUuNw==
Update the generated ssm properties in vim
/opt/cgms/server/cgms/conf/cgms.properties.
Add the FND jboss certificate (Certificate for Web) in to ssm_web_keystore.
cd /opt/cgms-ssm/bin/
./ssm_setup.sh
Enter your choice : 8
Enter current ssm_web_keystore password : <ssmweb>
Enter the alias for import: fnd
Certificate file name: /opt/certForWeb.bin
Trust this certificate? [no]: yes
Certificate was added to keystore
Start the SSM and CGMS service.
service ssm start
service cgms start
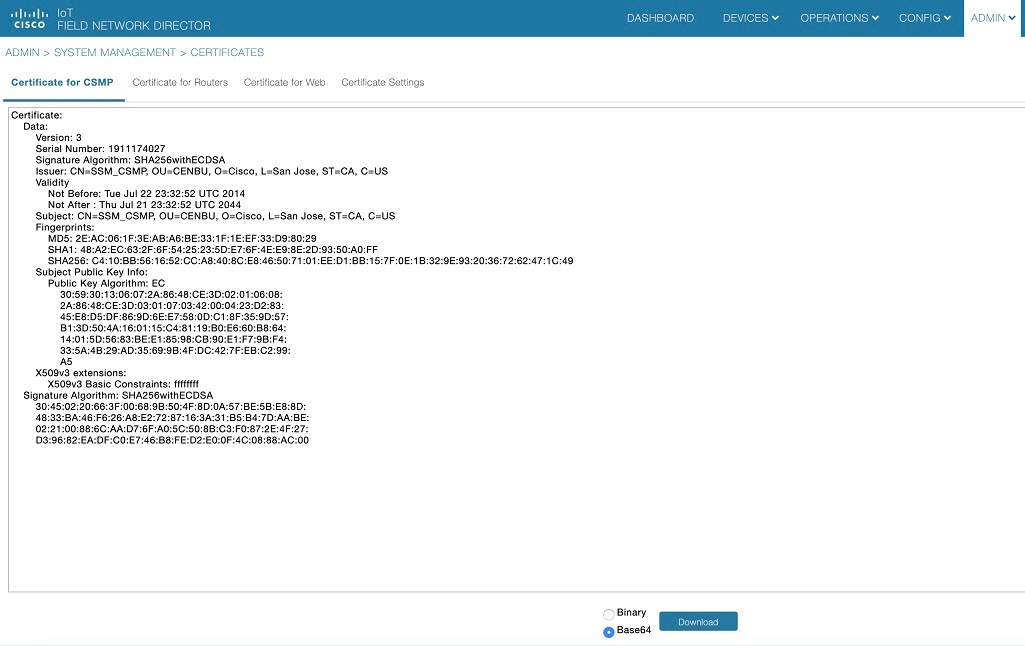
Login to FND and choose Admin -> certificates -> Certificate for CSMP. The CSMP
certificate will be displayed.
Push the generated bin into IR510 with following command:
fwubl_win732bit_1.0.5.exe -w target_node.bin -a 0x80e0000 com1
Hard reboot the IR510 again.
To verify the applied configuration:
TLV - 35 WPANStatus
TLV - 33 Ieee802.1xStatus
Secured Wireless Connection to Target Node
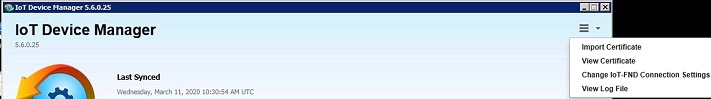
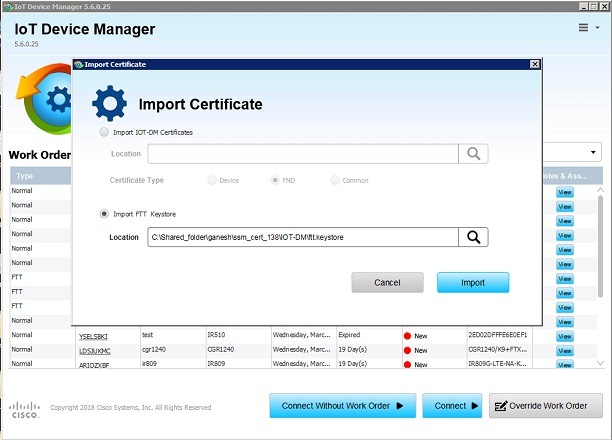
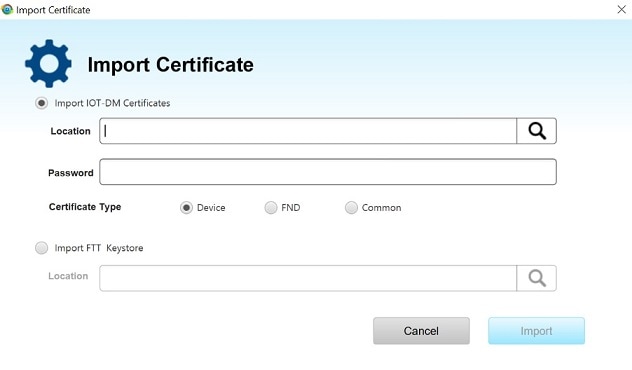
To import the keystore containing these certificates, on the Device Manager opening page,
select ImportCertificate from the drop-down menu on the upper right.
In the Import Certificate dialog box, browse to the location of the certificate file on
your laptop.
Select Import FTT keystore radio button. Then choose the ftt.keystore file and click on
Import.
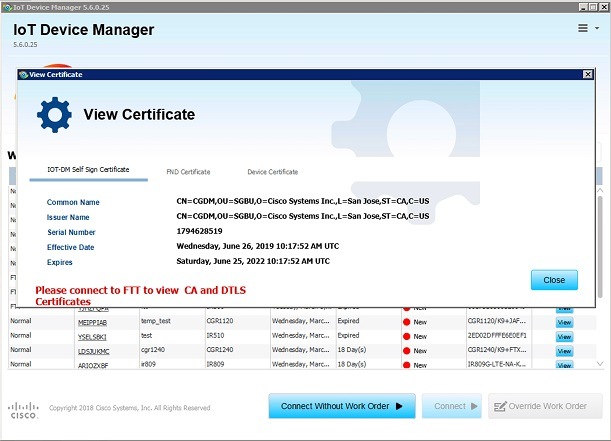
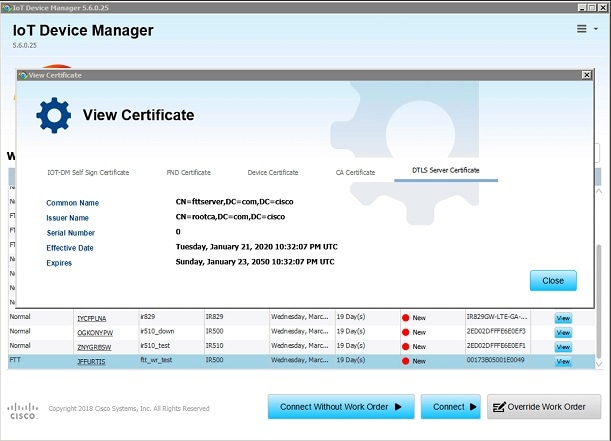
Note
After importing ftt.keystore, you need to connect to FTT to view the certificates;
otherwise you will see the warning message to connect to FTT in the View Certificate
page as shown below.
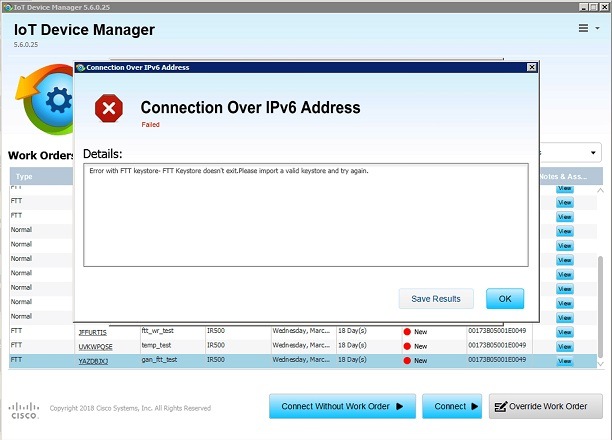
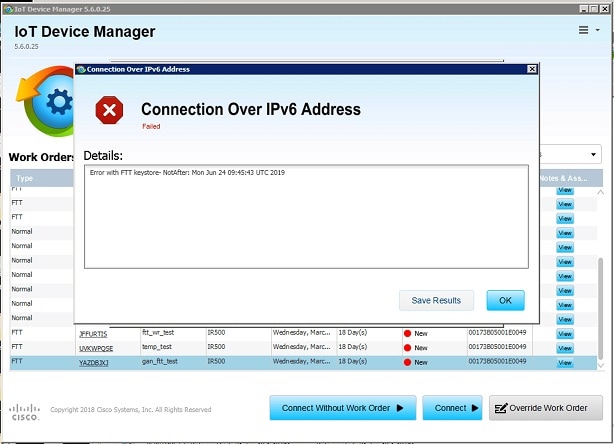
If ftt.keystore is not imported while connecting to FTT, you will get an error as
shown below.
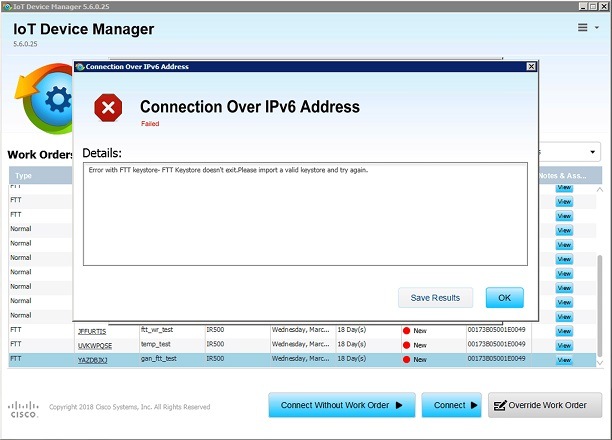
If a wrong password is provided while connecting to FTT, you will get an error as
shown below.
If the certificate is expired while connecting to FTT, you will get an error as
shown below.
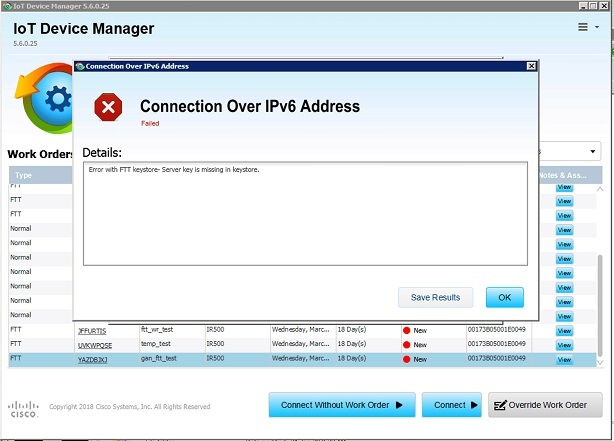
If the server key alias is missing while connecting to FTT, you will get an error
as shown below.
Create a work order from FND. Enter DTLS server Common Name, give permissions to GET and
POST TLVs.
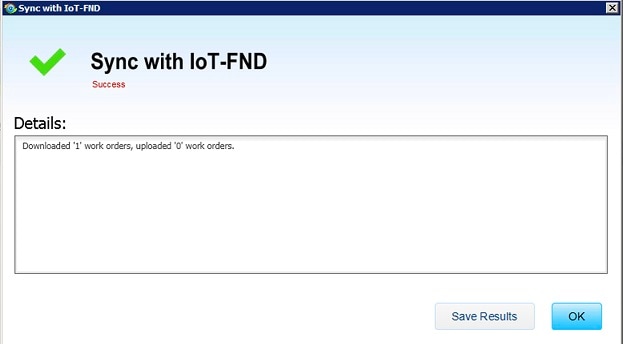
Use one of the following ways to sync the created WR from FND to IOT-DM:
Import the FND custom web certificate in to IOT-DM: IOT-DM Application → Settings
→ Import Certificate → Select Import IOT-DM certificates → Select FND radio
button → choose the *.pfx file → enter password and click on Import.
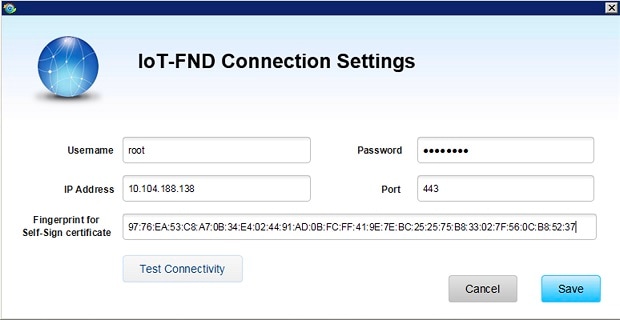
Enter the fingerprint of web certificate in IOT-FND Connection Settings.
Click on Sync with IOT-FND.
Viewing the Imported FTT keystore in IOT-DM
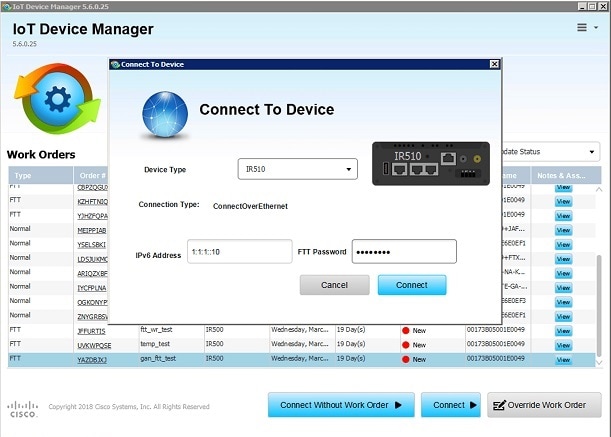
Select the downloaded FTT type work order and click the Connect button. Select IR510 as
device type, enter Relay node IPv6 address, and provide FTT password, then click on
connect. Once the dashboard page is launched, disconnect from device.
Note
The feature will only be enabled when you connect to the device with work order
which has TLV 342 message. If the work order is non FTT type, the IR510 device
connected com port. If the work order type is FTT, the Connect button redirects to
another screen and you need to provide IPV6 address of the relay node and FTT
password. Connect to IR510 via IPV6. Once the connection to IR510 is established
through IPV6 Address, the DTLS server 1.2 will be started. IoT-DM uses port number
5556 for DTLS server.
Connectivity to Relay Node With Work Order
Once the ftt.keystore is imported, they can be viewed in the View Certificate tab
as shown below,
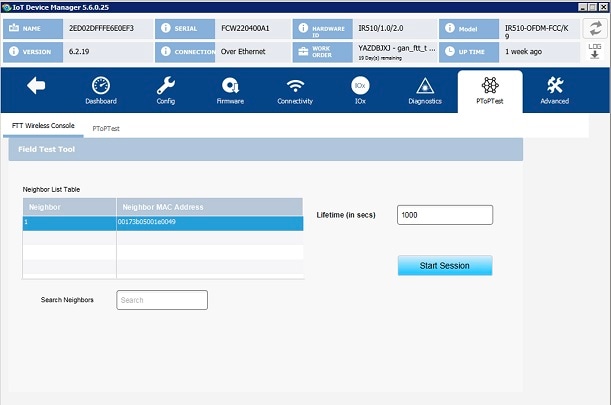
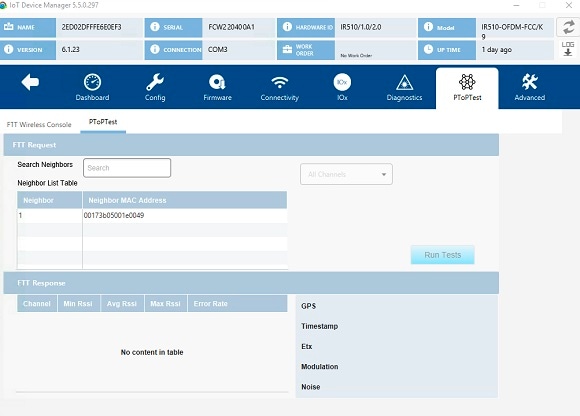
Login again with the same work order and navigate to PToPTest tab. You need to
choose neighbour target node from "Neighbour List table" (populated based on TLV
52), enter the lifetime (in seconds) and click on Start Session. It will post
TLV 341 and connect to the respective target node and establish DTLS channel.
IoT-DM will send authorization message to the connected target node. If the
target node address is not matching with the target node EUI ID mentioned in the
authorization message, target node will reject the request. Otherwise, it will
establish the connection.
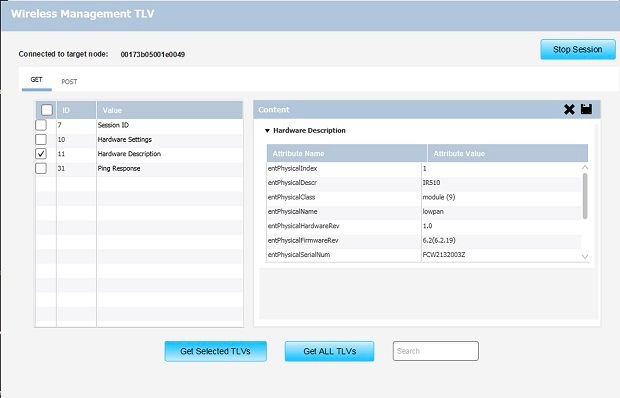
Wireless Console Screen
GET Authorized TLV Tab
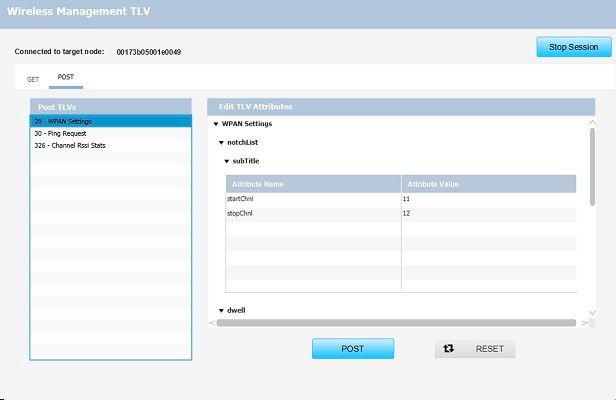
POST Authorized TLV Tab
To terminate the session, click the Stop Session button.
Note
As part of this feature, management command support via FTT wireless console
is removed, hence the "wireless management console screen" supported by
starting the wireless console session will be removed from IOT-DM Release
5.6 and later.
Running Point to Point Test Between Two IR510s
Use the PToPTest page to run point to point test between two IR510s.
Procedure
Step 1
Connect to IR 510 via IOT-DM.
Step 2
Click the PToPTest tab, select a neighbour, choose a channel option, and click the Run Tests button. If you do not choose a channel option, the test will be running with the default of "All Channels."
Use the Select channel drop-down menu to select one of the following channel options.
All Channels: the default selection
Single Channel: choose from 0 to 32
Channel Range: choose the start channel and the end channel
Multi Channels: enter channel numbers seperated by commas (for example, "1,5,23,") in the text box
Step 3
(Optional) If you want to search a specific neighbor, enter the physical address in the Search Neighbours text box.
The function of searching a specific neighbor is only supported on firmware version CG-Mesh 6.0 and later.
Step 4
After the test is completed, the results are dispalyed for RSSI, Error Rate, ETX, Noise, Modulation, GPS, and Timestamp.
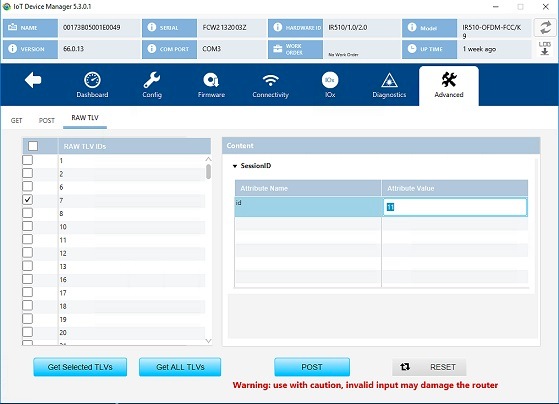
Raw TLV Support on IR510
The RAW TLV tab was introduced for IR510 on the Advanced tab. When you click the RAW TLV tab, all TLVs (including newly added TLVs) will be displayed as a list. Select TLVs from the list and click the Get Selected TLVs button will display the information about the selected TLVs. Click the Get ALL TLVs button will display information of all TLVs in the list. To change the TLV attribute values, click the POST button.
Note
If you change the field value and click the POST button, the data will be posted to the IR510 device WITHOUT ANY VALIDATION.
Note
On the RAW TLV tab, every fields of a TLV will be displayed. If some fields are not postable, the post operation will fail.
Disconnecting from the IR500
After finishing your work on the IR500, click the left arrow on the left side of the menu tabs area on the main page to disconnect
Device Manager from the IR500. Click Yes to confirm that you want to disconnect from the device. Device Manager disconnects and displays the Device Manager opening
page.
Managing IOx Nodes on IR510
From IoT Device Manager Release 5.2, you can perform management operations on the Linux/IOx nodes on the IR510 device. You
can also view the current information of the IOx nodes.
Note
The IOx node on IR510 should already have been setup via FND or manually, so that you can perform the management operations
on it from IOT-DM.
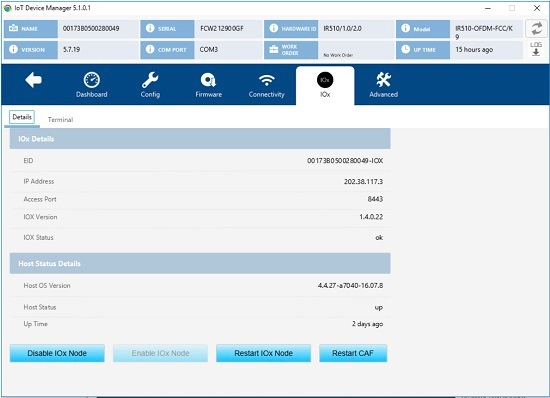
The following image shows the IOx tab which contains 4 management operation buttons and and a text area showing the details
of IOx node in the device.
Figure 5. IOx Tab
You can perform the following actions
Enable IOx Node - This operation only takes effect if the IOx Node was in disabled state.
Disable IOx Node - This operation only takes effect if the IOx Node was in enabled state.
Restart IOx - This operation only takes effect if the IOx Node was in enabled state.
Restart CAF - This operation only takes effect if the IOx Node was in enabled state.
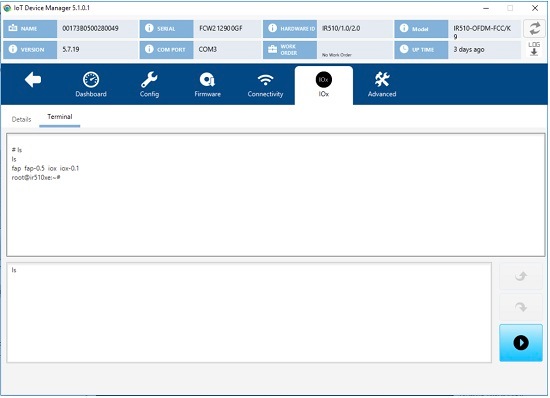
Using the IOx Terminal
You can connect to the Linux/IOx nodes on the IR510 device and execute commands or troubleshoot issues locally by using the
IOx terminal on the IOx tab.
Note
Linux node on the IR500 device should have UDP server running on 8335 port which will be used to connect via IOT-DM Client
over PPP.
To access the IOx Terminal, click the IOx tab and choose Terminal as the following figure shows. An interactive command prompt
will display where you can execute the commands on Linux/IOx terminal.
Figure 6. IOx Terminal
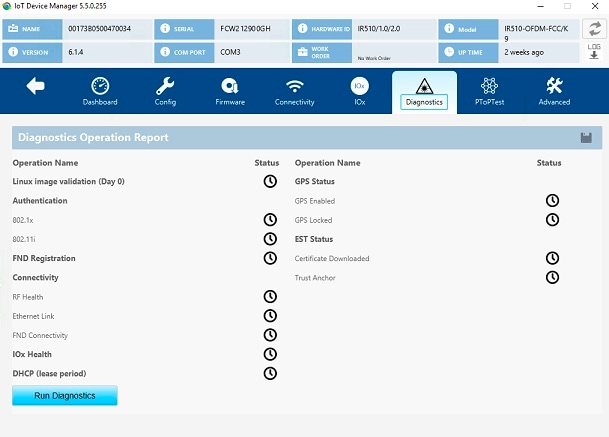
Diagnostic Operations on IR510
From IoT Device Manager Release 5.3, you can run diagnostic operations on IR510. Once completed, a simple report will be disaplayed
to indicate overall health status of the device which includes any issues with the device, suggestions to correct those issues,
and possible troubleshooting steps.
The following figure shows the Diagnostics tab.
Figure 7. Diagnostics Tab
To run diagnostics, click the Diagnostics tab. Then click the Run Diagnostics button, a message dialog box showing "Diagnostic operation is under progress, please wait." will be displayed. Other operations will not be allowed until the diagnostic operation is completed.
After all diagnostics are completed, successful operations will be shown as green and failed ones will be shown as red. Failed
operation will have the suggestions shown when a mouse is hovered on it.
The following diagnostic operations are supported:
Image Validation - Identifies whether the image (ROMMON or LINUX) installed on the device is in a good state.
Error messages:
LINUX image is either not installed or it is corrupt. Please re-install LINUX image and try again.
ROMMON is up and running. Please load LINUX and try again.
Authentication Check - Checks if the device has completed 802.1x and 802.11i authentications in the network.
802.1x
Error message: Seems like 802.1x is disabled. Please follow the instructions to configure 802.1x authentication correctly.
802.11i
Error messages:
802.11i is disabled. Please follow the instructions to configure 802.11i authentication correctly.
Seems like pmkId is not set. Please carryout 802.1x authentication.
Device should have at least one gtkId to participate in 802.11i authentication process.
gtkid is expired. Please renew it.
DHCP Check - Verifies whether the device has the DHCP lease period and got IPV6 address assigned.
Error message: DHCP lease is expired. Please renew it.
FND Registration Check - Identifies whether the device is successfully registered with FND server. The following checks will
be performed:
Time synchronization issue - IoT-DM compares the time of IR510 with the time of FND to check if the time is synchronized.
If their is a time sync issue then below error message is shown:
Error message: Device time is not synched properly. Please correct the device time and try again.
Registration process issue - Displays the registration failure cause.
Error message: There seems to be issue with registration process. Error Code: xxx.
Certificate validity
Error message: NMS Certificate is invalid. Please load the valid NMS certificate and try again.
Default message: Check if the device is added in FND DB.
Note
As part of the FND registration diagnostic operation , there will be an FND API call to get the Current Time. Credentials
will be taken from the CGMS Settings page if field technician had entered it before. If not, a seperate screen would be shown
to you to enter the details of FND Server with which the time sync operation will be performed. You may choose to skip it
if you do not want to enter the details of the FND server. In that case, the Time synchronization check will be ignored while
performing diagnostic operations.
Connectivity Diagnostic operations - Identifies whether the device connectivity is up to the mark with other interfaces on
the field.
RF Health Check - Status of WPAN LED will be displayed.
Ethernet Link Check - Status of Ethernet will be displayed.
FND connectivity Check
IOx Health Check - Performs the diagnostic operations on the IOx module installed in the device.
IOx Host Status - The status of the host on which IOx runs will be displayed.
IOx Status - The status of IOx process will be displayed.


 Feedback