Configuring and Running Reports

This chapter describes the analytics report use cases, an example report creation workflow, and how to configure and run WAE Live Analytics reports.

This section contains the following topics:

Analytics Use Cases

The Analytics pages let you generate traffic, health, ad hoc, and deviation reports, and visualize their results. These reports let you answer the following questions:

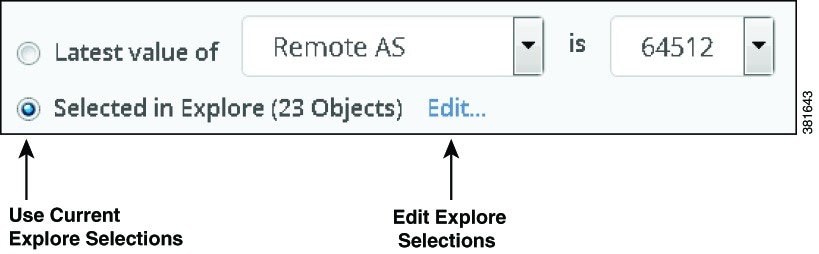
  • Which objects do you want to report on?

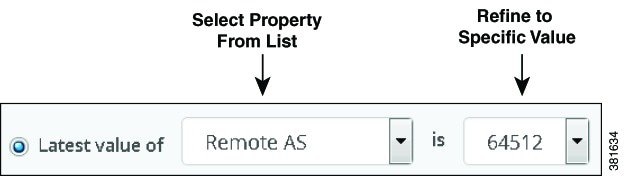
  • What object properties do you want report on?

  • What is the time frame for the report? Do you need to project a trend farther out from that time frame?

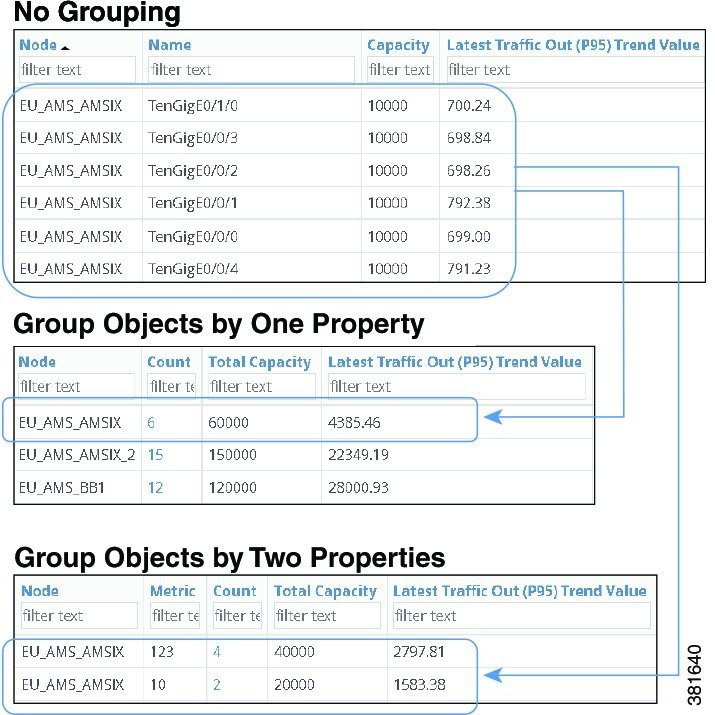
  • Do you want to run a report on individual or grouped objects?

  • Do you want to apply time aggregation operations, and if so, what are they (for example, maximum or average)?

Reports Workflow

There are several report configuration options that you can choose from when creating analytics reports for the first time. Configuration options vary depending on the report type.

The next procedure outlines an example ad hoc report configuration process.

Procedure


Step 1

Choose WAE Live > Analytics and choose the network (top left) on which you want to create the report.

If there is only one network configured, the word “default” appears.

Step 2

On the Analytics page, click New Report.

Step 3

In the Configure Report dialog box, choose the report type (such as Ad hoc) and the object type (such as LSPs) from the drop-down menus.

The Summary page summarizes your selections so far and presents you with several additional tabs: Filter, Time Range, Group By, Time Interval, and Data Columns.

Step 4

Click the Filter tab and the filter type to use. By default, WAE Live assumes you want to choose relevant objects in the Explore view.

To change the default filter, see Choosing a Filter Type.

Step 5

Click the Time Range tab and specify a time range for the report to run. By default, WAE Live uses the last one week of data when running the ad hoc report.

To change the default time range, see Defining Time Ranges.

Step 6

Click the Group By tab, and then choose a group or aggregation option. By default, WAE Live uses None (no objects).

To change the grouping or aggregation options, see Grouping Objects and Grouping and Aggregating Objects for more information.

Step 7

Click the Time Interval tab and specify the time period over which attributes are aggregated; for example, 1 day. For more information, see Time Aggregation Options.

Step 8

Click the Data Columns tab and choose the property and time aggregation operation to apply time aggregation combinations. For more information, see Ad Hoc Report Tabs.

Step 9

To run the report just once, click Run. For more information, see Running the Report without a Name.

Step 10

To save and run the report, click Save & Run. For more information see, Running the Report with a Saved Name.

Step 11

Name the report. For more information, see Naming Reports.

After naming and saving a report, it becomes available from the Reports page.


Configuring Reports

You can configure reports on a per-network basis to view network elements of interest and then group these elements to tailor a report for your particular use case.

To create an analytics report, you must configure the following report options:

  • Type of report to run from the Report Type drop-down menu

  • Type of object to report on from the Object drop-down menu

  • Type of filter to use for filtering objects from the Filter tab

You can configure a report to be run just once (ad hoc), or you can save the report and run it again later.

Report Types, Object Types, and Configuration Options

Table 1 describes the WAE Live report and object types that you can configure for report creation.

Table 1. Report Types, Object Types, and Report-Specific Configuration Options

Report Type

Definition

Available Object Types

Report-Specific Configuration Options

Ad hoc

A custom report that can be run on any data column object type found in the Explore table.

For more information on setting the group by and aggregate by options, see Grouping Objects, Grouping and Aggregating Objects, and Time Aggregation.

For more information on setting ad hoc time intervals ad hoc report examples, see Running Ad Hoc Reports.

  • Interfaces

  • Interface Queues

  • Nodes

  • LSPs

  • Demands

  • Reports

  • Group By

  • Aggregate By

  • Data Columns

Health

A report to determine the health of network objects and whether LAGs are imbalanced.

For more information on setting thresholds and health report examples, see Running Health Reports.

  • Interfaces

  • LSPs

  • LAG Imbalance

  • Nodes

  • Utilization Threshold

  • SetupBW Threshold

  • LAG Imbalance

  • CPU Threshold, Memory Threshold

Traffic

A report to determine current and projected traffic trends.

For more information on grouping, aggregate, and projection options, and traffic report examples, see Running Traffic Reports.

  • Interfaces

  • Demands

  • LSPs

  • Group By, Trends, Projection

  • Trends, Projection

  • Trends, Projection

Deviation

A report to determine sudden shifts in property values.

For more information on setting parameters and example deviation reports, see Running Deviation Reports.

  • Interfaces

  • Interface Queues

  • Nodes

  • LSPs

  • Demands

  • Reports

  • Parameters

Choosing a Filter Type

After deciding the type of report to create and the objects to report on, you must choose a filter type to use when creating your analytics report.

The filter you choose operates on a subset of objects. The complete list of objects and properties that you can filter on is described in Understanding Objects, Properties, and Data. There are two filter types:

  • Selected objects in the Explore View—this filter is selected by default. This filter is available from the Configure Report > Filter tab as well as from the various Explore tables. If there are no objects selected, the Filter page displays (0 Objects).

  • Latest value of—this filter represents the latest value of an object. Each object type has different filter values depending on the object type selected. Filter values can include user-defined properties set up by the WAE Live administrator, if any.

    You can specify the filter to use in creating a report from the drop-down list on the Filter tab, or you can base them on selections in the Explore tables.

    Both filters let you have a broad scope report or a more narrow scope report depending on what data you are looking for in the report.


    Note


    If you choose specific interface types from the Explore Interfaces page for use in a report, WAE Live generates the report only on those interfaces of those selected types. If you choose Interfaces as the Object from a Configure Report page, the report is run on all interfaces regardless of their type.

Choosing Objects in Explore

This procedure assumes that you want to narrow your current report scope from the 23 selected LSPs in the Explore LSPs table to just three LSPs.

Procedure


Step 1

In the Configure Report > Filter tab, click Edit, which takes you to the relevant Explore page.

Step 2

In the LSPs table, choose the three LSPs on which you want to report.


Choosing the Latest Value Filter

When you create reports from the Analytics > New Report > Configure Report > Filter tab, the default filter is Selected in Explore. You can change the default by clicking the Latest value of radio button.


Note


The object type properties and value filters that you see in the drop-down menus vary depending on the object you choose.

This procedure shows how to use the Latest value of filter and refine a remote autonomous system (Remote AS) to a specific value for reporting purposes.

Procedure


Step 1

In the Filter tab, choose the object property to filter on; for example, Remote AS.

Step 2

Refine the Latest value of list by choosing a specific value from the second list; for example, 64512.

This lets you run the report on all objects based on the selected property or on all objects matching the refined property value.


Defining Time Ranges

The Time Range tab defines the time frame for when WAE Live generates the report. You can choose a time range using one of these methods:

Creating a Time Range with the Last Button

You can specify that reports use the time range radio button and the time from the Last pull-down menu. For example, you might create a deviation report with a time range that includes all the data collected within the last year.

Procedure


Step 1

In the Configure Report window, click the Time Range tab.

Step 2

Click the Last Radio button.

Step 3

Enter an integer such as 1 and choose year(s) from the drop-down list. You can also choose hour(s), day(s), week(s), and month(s).


Creating a Custom Date Range

You can specify a custom date range for when WAE Live runs reports. You can enter the range manually in yyyy-mm-dd hh:mm:ss format, or you can choose dates from the calendar pickers.

Procedure


Step 1

In the Configure Report window, click the Time Range tab.

Step 2

Click the Custom Dates radio button.

Step 3

In the From field, enter the from date for the time range.

Step 4

In the To field, enter the to date for the time range.


Creating a Date Range with the Previous Time Window Button

You can configure reports with a floating window (Previous Time Window). This option reports data based on the time frame when the report was run (the last full window)—such as 7:00 a.m.–7:00 p.m.—instead of the time when the report was defined, such as 6:00 p.m.

The time range for the floating window uses the 24-hour clock and can be defined between 00:00:00 and 23:59:59. You can enter the time range in hh:mm:ss format manually (00:00:00), or by choosing the appropriate times from the time pickers.

The time range can transition through two days; for example, you can specify the time window to be From: 22:00:00 (10:00 p.m.) and To: 10:00:00 (10:00 a.m.).

Table 2. Report Window Example

Report Window

Report Run Time

Result

7:00 a.m–7:00 p.m.

6:00 a.m. on January 2

The report covers data from 7:00 a.m.–7:00 p.m. on January 1.

6:00 p.m. on January 2

The report covers data from 7:00 a.m.–7:00 p.m. on January 1.

8:00 p.m. on January 2

The report covers data from 7:00 a.m.–7:00 p.m. on January 2.

This procedure shows how to a create report that defines a time window to include data collected from 7:00 a.m. to 7:00 p.m.

Procedure


Step 1

In the Configure Report window, click the Time Range tab.

Step 2

Click the Previous Time Window radio button.

Step 3

In the From field, enter the from time; for example, 07:00:00 (7:00 a.m.).

Step 4

In the To field, enter the to time; for example,19:00:00 (7:00 p.m.).


Ad Hoc and Traffic Report Specific Options

The ad hoc and traffic reports support the following additional configuration options:

  • Grouping Objects

  • Time Aggregation

Grouping Objects

The traffic and ad hoc reports support the ability to group (or aggregate) a set of objects and sum their property values. In the resulting report table, each row represents a group of objects. The columns represent the aggregated values for each group.

The next procedure shows how to create a traffic report that operates on LSPs and is grouped by source nodes and remote nodes.

Procedure


Step 1

In the Configure Report window, click the Group By tab.

Step 2

Click the Select radio button and choose Source Node.

Step 3

Click the plus button (+) and choose Remote Node.


Group By Options

Table 1 describes the Group By tab options and how they affect the report generation process.

Table 3. Group By Options

Group By Option

Definition

None

Does not to group any objects when generating the report. The None radio is selected by default.

Overall

Groups all objects in the report into one row of data. For example, you can group all interfaces to determine their overall traffic. The data in that row is the sum of all interfaces combined.

Group by one property

Group all objects that have the same value for the selected property together. The resulting report shows one row for each grouped property and the data in that row is the aggregate for that property. For example, if you choose LSPs as the object and then group them by Source Node, the resulting report includes one row for each source node. The data in that row is for all LSPs that are sourced from that node.

Group by multiple properties

Further segment a group of objects based on another property selected after clicking the Plus icon. The resulting report shows one row for each set of grouped properties within its parent group. For example, if you group LSPs by their source node and secondly by their remote (destination) node, the report aggregates data for all remote nodes that have the same source node. In effect, this example grouping would create a traffic matrix.

Grouping Examples

Example Effects of Grouping Objects shows a report generated three times:

  • One without grouping objects (No Grouping)

  • One with objects grouped by nodes (Group Objects by One Property)

  • One grouping first by nodes and then by metric (Group Objects by Two Properties)

The Capacity and the Latest Traffic Out (P95) columns adjust according to whether and how the objects are grouped.

Figure 1. Example Effects of Grouping Objects

Grouping and Aggregating Objects

Grouping is the process of choosing what objects to sum together as a group; for example, all interfaces with a specific capacity. Aggregation is a function where multiple values of different objects are grouped together to form a single value; for example, “maximum” or “average.” Note that “average” represents an additional grouping.

Aggregation Options

Table 1 details the aggregation options and their meanings.

Table 4. Aggregation Option Values and Their Meanings

Aggregation Option

Meaning

Average

Add up all of the object values and find the average value.

Maximum

Look at all of the object values and find the maximum value.

Minimum

Look at all of the object values find the minimum value.

Last

Find the last value in the specified time interval.

Count

Number of times the data was collected during the specified time period. For example, if you collected traffic information once an hour for 24 hours, and the Count was 20, you would know there was a problem during 4 hours.

Change Count

Number of times the value changed. For example, if you choose the Shortest TE Path for LSPs, you can report on the number of times it changed during the last year.

P# Values (P99, P98, P95, P90, and P85)

Find time aggregation computations based on these percentage values. For example, P95 is the value 95% of the time. Many times the top 5% in the chart view is considered as noise, which can be filtered out.

Time Aggregation

The traffic and ad hoc reports support time aggregation features that aggregate multiple property values into a single value for a given time range. For example, you can aggregate maximum raw data values for traffic on a weekly basis.

Time aggregation operations are applied to raw data. For a description of raw data, see Understanding Objects, Properties, and Data. For more information and examples of aggregating data in the reports, see Running Traffic Reports and Running Ad Hoc Reports.

Running Reports

You can run new reports or existing reports from any of the locations listed in the next sections.

Running New Reports

To run new reports:

  • From the Analytics > Reports page or Analytics > Report Log page, click New Report.

  • From the Explore page, choose objects and click Run Report.

Running Existing Reports

There are two ways to run existing reports (with existing or changed parameters):

  • From the Analytics > Reports page, choose View > Run, which runs immediately with the same parameters. To keep or change the parameters, choose View > Run or click the name in the Report Name cell.

  • From the Analytics > Report Log page, to keep or change the parameters, choose View > Edit or click the name in the Report Name cell.

Canceling Running Reports

To cancel reports that are running:

  • From the Analytics > Report Log page, select the report and click Cancel to cancel.

Naming Reports

You can run reports with a saved name or without a name. Additionally, you can change the name of an existing report.

To email the report, you must give the report a unique name when you run it.

Running the Report with a Saved Name

To run the report with a saved name, click the Save & Run button after configuring the report. By giving the report a name, you automatically add it to the Analytics Reports page where you can easily identify and schedule it for future use.

Running the Report without a Name

To run the report without giving it a name, click the Run button after configuring the report. If you do not save the report with a name, it is given a default name with the format Report Type-Object Type-Definition ID. Reports that use a default name appear only on the Analytics Report Log page.

Changing the Name of an Existing Report

To change the name of an existing report, there are two options:

  • From the report output page, choose Save As from the menu available through the gear icon.

  • Run and save the report again with a new name. This overwrites the existing report name.

Applying Filters and Sorting Named Reports

You can apply filters and sorting to a named report so that it displays according to these filters and sorting each time you open or run the report. Thereafter, you can schedule email alerts to be sent when these conditions are met.

These saved report parameters do not affect the generation of the report. Rather they affect what is displayed in the output (based on the filters that were applied), how the information is displayed (based on how the columns were sorted), and if scheduled appropriately, whether the report is sent via email.

Procedure


Step 1

Run and name the report.

Step 2

On the report output page, apply filters and/or sorting.

  • Enter a value in one or more Filter Text cells at the top of a table column, and press Enter.

  • To sort the results of a property in a specific order, click its column heading one or two times.

Step 3

Save the filters and sorting by clicking the Save icon.


Scheduling Reports

You can schedule reports to run once or at regular intervals, and have these results emailed to you and to others. You can also send alerts when the state of your network matches conditions that you define using filters. For example, if want to be notified if interfaces exceed 90% utilization, you can apply and save report filters to meet this criteria, and then schedule an email alert to be sent if this condition is met.

Procedure


Step 1

Choose WAE Live > Analytics and choose the network on which you want to create the report.

If there is only one network configured, the word “default” appears.

Step 2

If you want to email report results based on specific criteria, set the filters before opening this dialog box. Similarly, if you want emailed reports returned with a specific column sorted, save the report with this column sorted. For information, see Configuring and Running Reports.

Step 3

From the Reports page, choose View > Scheduling or click the Scheduled link associated with the report you want to schedule.

Step 4

To turn on scheduling, choose the options that fit your needs. You can schedule the time of day for the report to run, and you can run reports once on a specific day, daily, weekly, monthly, or on a specified number of weeks or months.

To turn off scheduling, choose None.

Step 5

To email scheduled reports, enter one or more email addresses separated by commas.

Step 6

If emailing reports, either specify that they always be sent or only if they contain data (they are non-empty). If you are emailing the report based only on specified criteria (Step 1), choose “non-empty report.”

Step 7

Click Save.


Reports Table Details

The Reports table provides the following details and options for your reports:

  • Report Name—Name of the report. Click the name to open the Configure Report page with the parameters selected that were used to create the report.

  • Time Range—Duration of the report; for example, last month, last year, and so on.

  • Last Run—Date and time of the last time the report was run. If the report has been run multiple times, click the icon next to the date to list the available reports. To run one of these reports, choose it and then click Select.

  • Scheduled—Frequency of how often the report is automatically run. If the report is not scheduled, the column reads None. Click View > Scheduling to schedule the report to run, to email the report, or to stop running the report if already scheduled.

  • Owner—Username of the person who created the report. If LDAP is the authentication method, this is the same as the LDAP client username. By filtering on your username, you can view only the reports that you created.

  • View options:

    • View—Click to view the report output.

    • View > Run—Run the report with same parameters.

    • View > Edit—Open the Configure Report page with the parameters selected that were used to create the report. If you run and rename the report, it replaces the name of the existing report.

    • View > Scheduling—Open the page that lets you schedule the report to run, to email the report, or to stop running the report if already scheduled.

    • View > Delete—Remove the report from this Reports page. The report remains listed on the Report Log page.

Using the Report Log

The Analytics Report Log lists all previously run reports and information that further defines them, such as their start and end time. You can view report results, run the report again, or edit the report configuration before rerunning.

To view the Report Log:

Procedure


Step 1

Choose WAE Live > Analytics and choose the network (top left) on which you want to create the report.

If there is only one network configured, the word “default” appears.

Step 2

On the Analytics page, click Show Report Log.

The Report Log provides the following details about your reports:

  • Report Name—Name of the report. Click it to open the Configure Report page with the parameters selected that were used to create the report.

  • Job ID—Specific instance of a report. A unique Job ID is generated each time a report is run. The Job ID is required information for importing traffic reports into the WAE Design GUI.

  • Definition ID—Uniquely identifies the report. If the same report is run multiple times with the same parameters, its Definition ID stays the same.

  • Start Time—The time the report was run; for example, 2016-12-11 15:54:26. The time is based on your user profile; for example, UTC-07:00 Pacific Daylight Time.

  • End Time—The time the report ended; for example, 2016-12-11 15:54:59.

  • Elapsed Time—The time it took for the report to run; for example, 00:00:33.

  • % Complete—Percentage of completion for the report.

  • Job Status—Status of the report, which can be:

    • Created

    • Pending

    • In progress

    • Complete

    • Cancelled

    • Cancelling

    • Errors

    • Aborted

Step 3

(Optional) Use the View options to run, edit, schedule, download, or delete the report.