Open SDN Controller Basics
The following topics provide an overview of Open SDN Controller and describe basic information you will need to use this product:
Overview
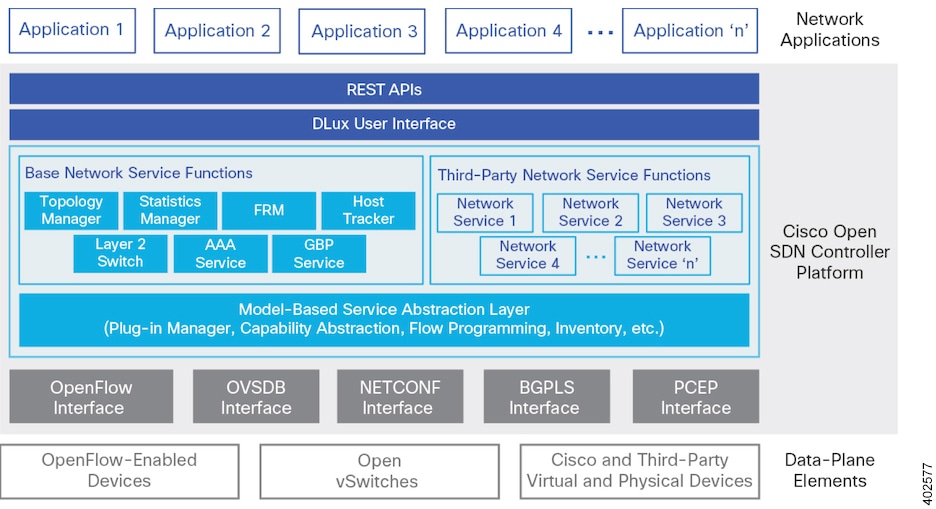
The Cisco Open SDN Controller is a commercial distribution of OpenDaylight that delivers business agility through the automation of standards-based network infrastructure. Built as a highly scalable software-defined networking (SDN) application platform, the Open SDN Controller abstracts away the complexity of managing heterogeneous networks to improve service delivery and reduce operating costs.
Key Features
The following table summarizes the key features that Open SDN Controller provides.
| Feature | Description |
|
Commercial distribution |
Provides a hardened, validated, and supported OpenDaylight distribution. |
|
Clustering |
Allows you to configure multiple controller nodes to act as one in order to ensure the controller's continuous operation. |
|
Serviceability |
Provides features such as log collection, metrics collection, and system monitoring. |
|
Open Virtual Appliance (OVA) packaging |
Enables simplified installation and deployment flexibility. |
|
Cisco DevNet Integration |
Provides access to the Open SDN Controller application development environment. For more information, visit developer.cisco.com/site/opensdn. |
|
IP/MPLS and OpenFlow network support |
Integrated application support of IP/MPLS and OpenFlow networks |
|
Northbound Representational State Transfer (REST) APIs |
Support application integration to the network. |
|
Network services Java APIs |
Enable the creation of embedded functions to deliver custom controller capabilities. |
|
Southbound device plug-ins |
Connect virtual and physical network elements, supporting heterogeneous network environments. |
Logging In
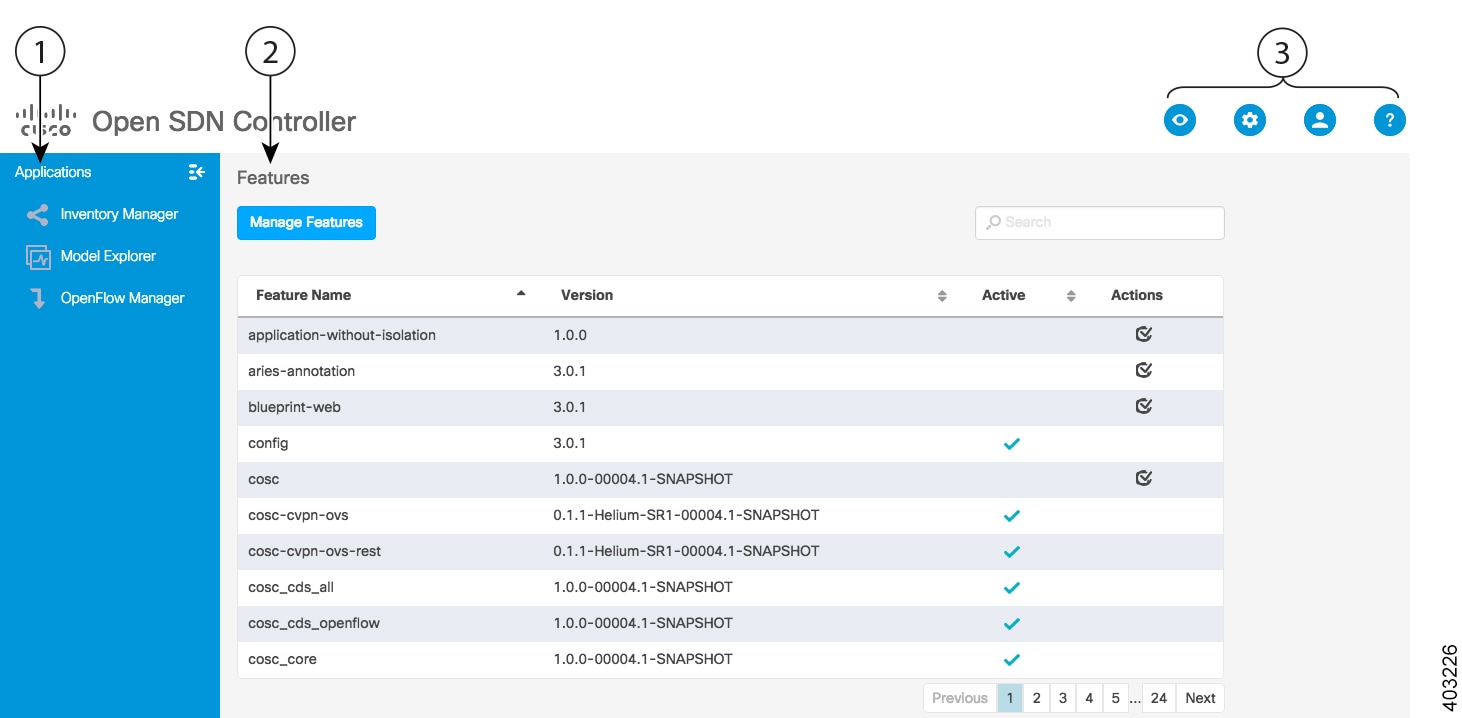
Open SDN Controller GUI
The Open SDN Controller GUI is comprised of the following components:
| Callout | Component | Description | ||
|
1 |
Applications pane |
Provides a launching point for the applications that Open SDN Controller provides to facilitate the administration of your network:
|
||
|
2 |
Content pane |
Displays the content applicable to the application or page that was last opened.
|
||
|
3 |
Main toolbar |
Provides the following four menus:
|
Application Toolbar
The following table describes the features available in the toolbar shared by the BGPLS Manager, OpenFlow Manager, and PCEP Manager applications.
| Button | Description |
|---|---|
|
Click to select one or multiple devices in the topology. To select multiple devices, either hold down the Shift key while you click each device or draw a rectangle around them. |
|
|
Click to move the entire topology or particular devices within the topology. |
|
|
Click to zoom out the topology. |
|
|
Click to zoom in the topology. |
|
|
Click to zoom in on a particular area of the topology. Draw a rectangle around the device or devices you want to focus on. |
|
|
Click to restore the default topology view and display the entire topology within the content pane. |
|
|
When multiple devices are selected, click to group those devices. Once devices are grouped, a single icon depicts all of the devices in that group. To toggle between viewing the group icon and the icons for the individual devices, click the +/- sign. |
|
|
Click to view the application in full-screen mode. |
|
|
Click to specify how devices are displayed in the topology and the color theme that is used. |
 Feedback