Cisco Open SDN Controller 1.1 Administrator Guide
Bias-Free Language
The documentation set for this product strives to use bias-free language. For the purposes of this documentation set, bias-free is defined as language that does not imply discrimination based on age, disability, gender, racial identity, ethnic identity, sexual orientation, socioeconomic status, and intersectionality. Exceptions may be present in the documentation due to language that is hardcoded in the user interfaces of the product software, language used based on RFP documentation, or language that is used by a referenced third-party product. Learn more about how Cisco is using Inclusive Language.
- Updated:
- July 8, 2015
Chapter: Open SDN Controller Applications
Open SDN Controller Applications
The following topics describe the five applications that Open SDN Controller provides to facilitate the day-to-day administration of your network:
BGPLS Manager
Border Gateway Protocol (BGP) allows you to set up an interdomain routing system that automatically guarantees the loop-free exchange of routing information between autonomous systems. The primary function of a BGP system is to exchange network reachability information with other BGP systems, including information about the list of autonomous system paths. BGP can also be used to exchange other types of network information. For example, BGP Link-State (a BGP extension) enables a router running a link-state routing protocol (such as IS-IS) to communicate the link-state database in a BGP session up to the controller.
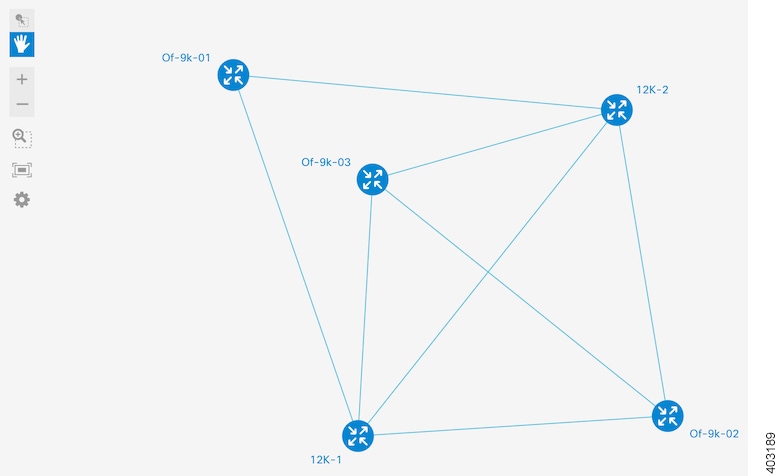
From the BGPLS Manager, you can view a topology that maps to the nodes or devices in your network running a link-state routing protocol. You can also view address and interface information for each device, as well as the status of device links.
Note that BGP-enabled devices cannot be added to the topology within BGPLS Manager. To add devices, complete the following procedure described in the Adding BGP Devices topic.
BGPLS Manager Workflow
The following procedure describes a typical workflow you would employ for the BGPLS Manager.
 Note | Before you proceed, ensure that BGP-LS has been configured properly on both the controller and a BGP-LS speaker in the network. For more information, see the Setting Up BGP-LS and PCEP section in the Open SDN Controller installation guide. |
| Step 1 | Open the BGPLS
Manager by selecting
BGPLS
Manager from the Applications pane.
A topology appears in the content pane, displaying the BGP-enabled devices in your network and the links that connect them. In this example, say you want to focus on the device that resides in your San Francisco site and view its BGP information. | ||
| Step 2 | From the BGPLS
Manager toolbar, click
Select.
| ||
| Step 3 | Click the icon
for the San Francisco device.
A popup window opens, displaying basic BGP information for the device such as its IP address and any networks it is set to announce.
| ||
| Step 4 | Click the links
connected to the device to view traffic information and identify any links with
higher than normal traffic, which could indicate that a problem exists.
|
Inventory Manager
From the Inventory Manager, you can view summary information for both the devices that Open SDN Controller manages and the interfaces that are configured on those devices. Note the following:
-
You are only able to edit or delete NETCONF devices from the Inventory Manager. For a description of how to add devices, see Mounting NETCONF Devices to the Controller.
-
Any non-operational NETCONF devices will be indicated by red text.
-
After a login username and password have been set on a NETCONF device, you can then change these values directly from the Inventory Manager.
Inventory Manager Workflow
The following procedure describes a typical workflow you would employ for the Inventory Manager.
| Step 1 | Open the
Inventory Manager by selecting
Inventory Manager from the Applications pane.
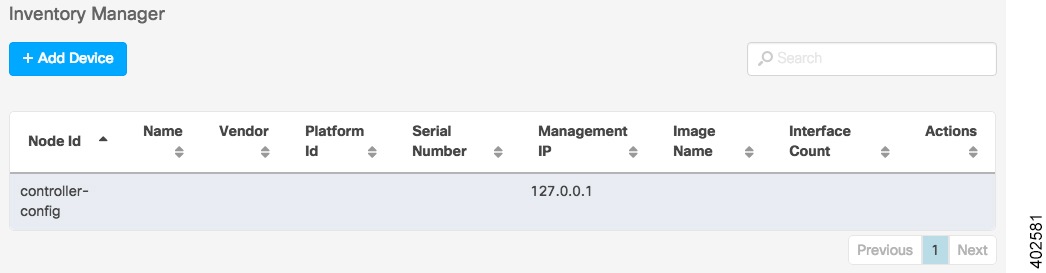
When you first open the Inventory Manager, you see a listing of every managed device in your system, as well as information such as its node ID, serial number, and interface count.
| ||
| Step 2 | Manage the
devices in your system:
| ||
| Step 3 | View information
for the interfaces configured on a device:
|
Adding a Device
Editing a Device
Deleting a Device
Model Explorer
YANG is a data modeling language that models NETCONF configuration data, state data, remote procedure calls (RPCs), and notifications. Open SDN Controller uses YANG models to structure this data hierarchically into modules and submodules and render REST APIs at runtime in the Model Explorer. From here, you can access your network's configuration and state data via REST API methods such as GET and PUT.
To open the Model Explorer, select Model Explorer from the Applications pane.
Before you use the Model Explorer, we recommend that you view the documentation available for the REST APIs that Open SDN Controller supports to better understand their syntax and usage. See Viewing REST API Documentation for more information.
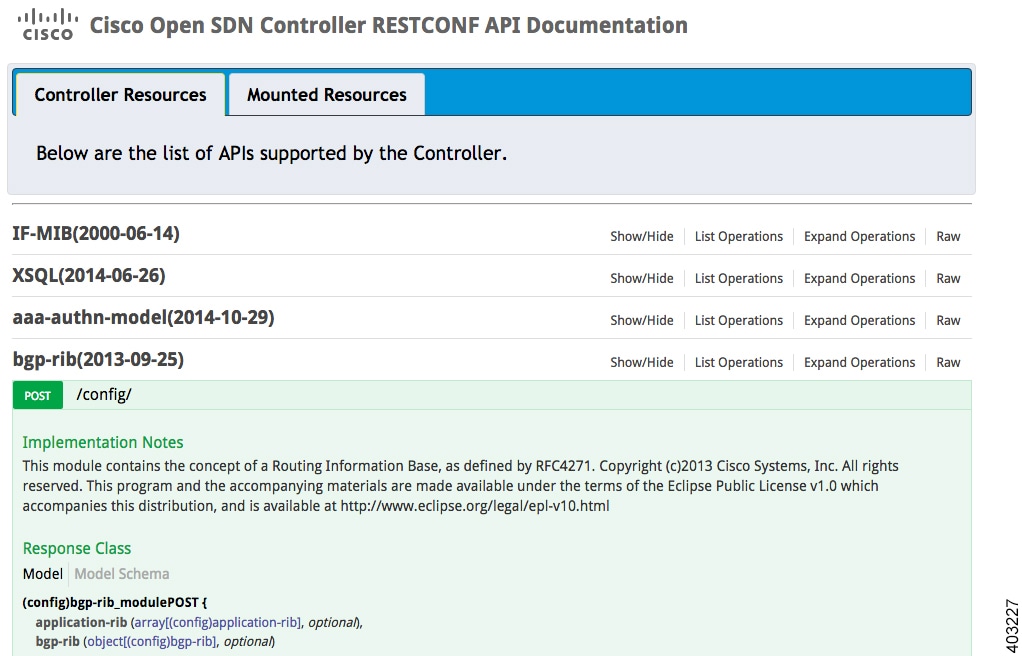
Viewing RESTCONF API Documentation
Open SDN Controller supports a number of RESTCONF APIs. To access documentation that provides usage information for these APIs:
Navigating the Model Explorer GUI
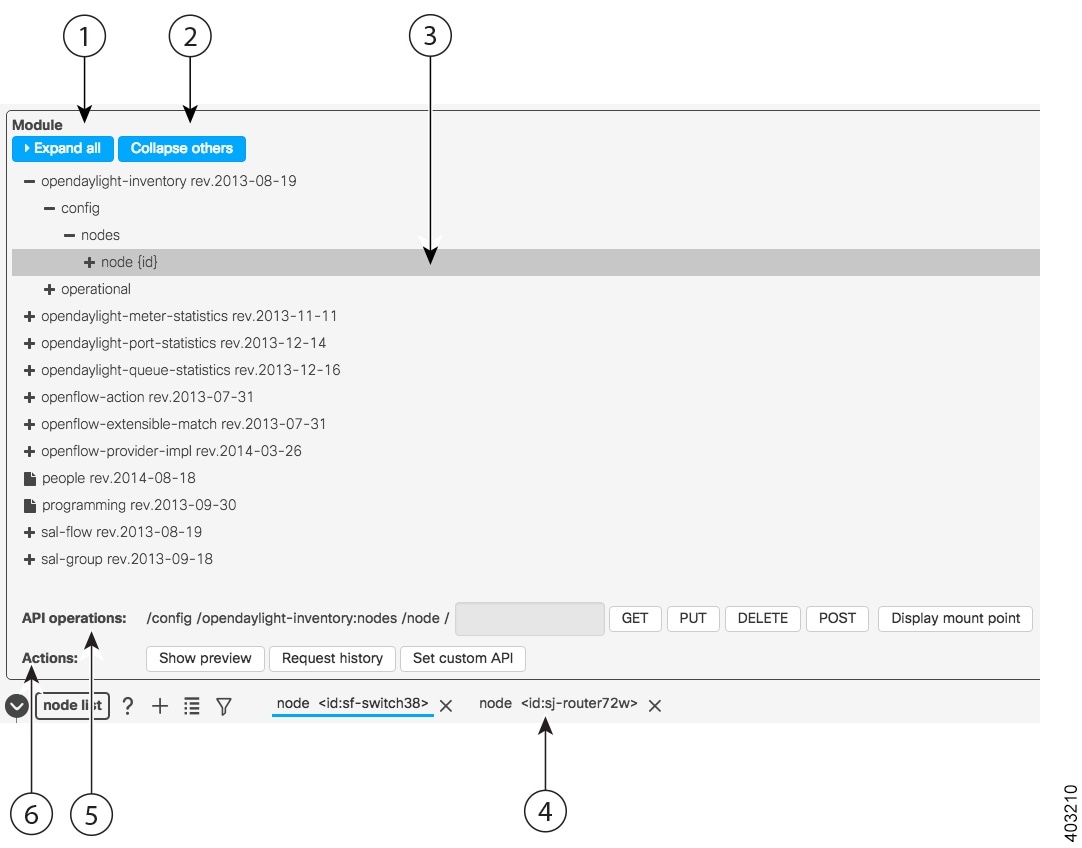
The following table describes the components that make up the Model Explorer GUI.
| Callout | Component | Description |
|---|---|---|
|
1 |
Expand all button |
Click to expand all of the APIs listed in the Module area and view their elements. |
|
2 |
Collapse others button |
Click to minimize all of the APIs listed in the Module area except for the API that is currently selected and expanded. |
|
3 |
Module area |
Lists every REST API that the controller supports. To work with a particular API, locate it in the list (expanding elements, as needed) and then select the API. |
|
4 |
API Settings area |
Displays the settings configured for the selected API or API operation. From here, you can also add list elements and configure filters. |
|
5 |
API Operations field |
Lists the corresponding URL for the selected API. Inputs can be filled with data. This field also provides buttons that allow you to execute the operations supported by that API. |
|
6 |
Actions field |
Provides three buttons:
|
Model Explorer Workflow
The following procedure describes a typical workflow you would employ for the Model Explorer.
| Step 1 | With the Model
Explorer open, select an API from the Module area.
What you can do from here depends on whether you selected a config API, an operational API, or an API operation:
|
| Step 2 | Update the
settings for the selected API or operation, as needed.
Note the following:
|
| Step 3 | Add list
elements to the selected API or operation.
See Adding List Elements for more information. |
| Step 4 | Apply filters
to the selected API or operation.
See Managing Filters for more information. |
| Step 5 | (Optional)
Click
Show preview to view the corresponding API
path and payload for the operation you want to execute.
This feature is useful when you want to copy and paste this information into another application, such as OpenFlow Manager. |
| Step 6 | Execute the appropriate POST, PUT, or DELETE operation. |
Adding List Elements
When you view a config API's or operational API's settings, you may see lists that you can modify in the API Settings area. To add elements to a list, complete the following procedure. In this example, we will add two nodes to the opendaylight-inventory API and configure a few settings for each node.
List Element Operations
The following table describes the operations that are available when you are working with lists in the Model Explorer.
| Icon | Description |
|---|---|
|
Click to view a description of an element. |
|
|
Click to add a new list element. |
|
|
Click to view all of the elements that belong to a list. |
|
|
Click to open the filter popup window. See Managing Filters for more information. |
|
|
Click to view additional list elements so you can select them. Only three elements are displayed in the API Settings area at any given time. |
|
|
Click to delete a list element. |
Managing Filters
The Model Explorer allows you to apply filters to the information it maintains. The following topics describe how to make use of this functionality.
Adding a Filter
Building on the previous example, we will set up a filter for the 2 nodes we added.
| Step 1 | Click the node list's filter
icon to open the filter popup window.
By default, a blank filter is displayed after you first open the filter popup window. You cannot delete it because at least one filter must be displayed in the filter popup window at any given time. In this example, say you only want to view devices that run Cisco NX-OS software. |
| Step 2 | In the software field, enter
nx-os and then click
Ok.
Notice that both nodes are still displayed. This is because = is set as the logical operator (by default), which instructs the Model Explorer to return results that match the value you entered exactly. |
| Step 3 | Reopen the filter popup window
and set the software field's logical operator to
contains.
Only node sj-router72w should be displayed now. Note the following:
|
Activating and Deactivating a Filter
| Step 1 | Click a list's filter icon to open the filter popup window. |
| Step 2 | Do one of the following: |
| Step 3 | Verify that the
filters you have configured are in the correct state by placing your cursor
over the list's filter icon and viewing the resulting popup.
A full icon indicates that the filter is activated, whereas an empty icon indicates that the filter is deactivated. |
Deleting a Filter
| Step 1 | Click a list's filter icon to open the filter popup window. |
| Step 2 | Do one of the following: |
| Step 3 | Place your cursor over the
list's filter icon to verify that the appropriate filter was deleted.
The resulting popup should reflect the changes you made. If you removed all of the filters, the list's filter icon should be empty. |
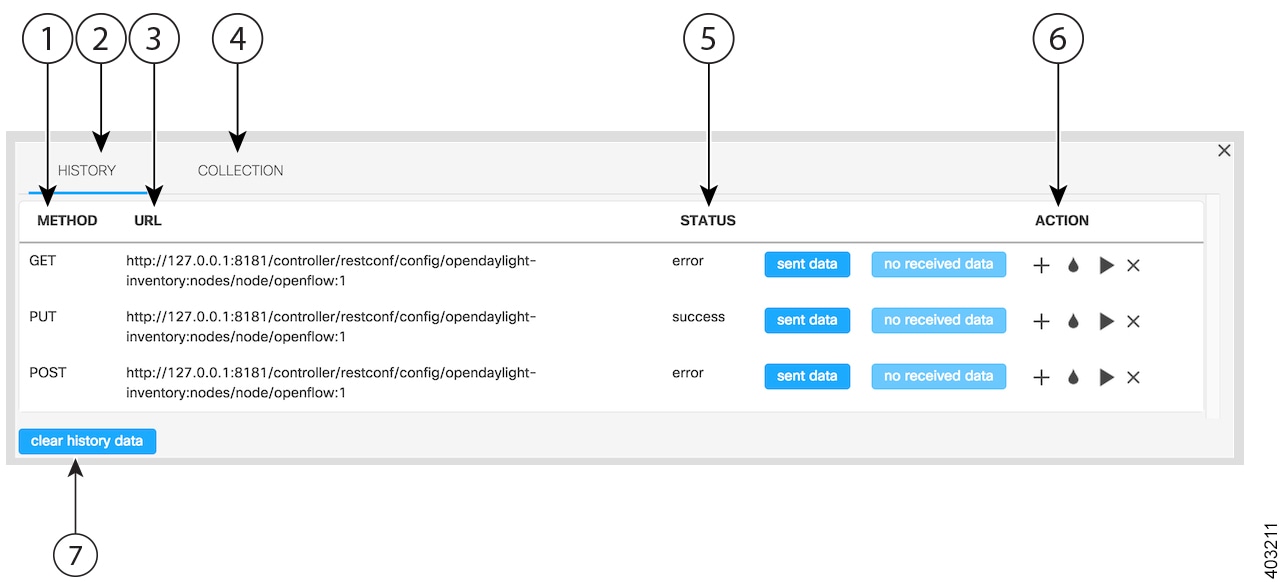
Viewing Request History
The Request history popup window maintains a record of every REST API method operation that has been executed in Open SDN Controller and provides summary information for each operation. The following table describes this window and its components.
| Callout | Component | Description |
|---|---|---|
|
1 |
Method column |
Indicates the REST API method used for an operation. |
|
2 |
History tab |
Displays the REST API method operations that have been executed on the controller since the last time the Request history popup window's data was cleared. |
|
3 |
URL column |
Indicates the REST API URL used for an operation. |
|
4 |
Collection tab |
Displays the REST API method operations that have been saved by a user for future use. |
|
5 |
Status column |
Indicates whether an operation was executed successfully and whether data was sent or received during the operation. |
|
6 |
Action column |
Allows you to perform one of the following actions on an operation: |
|
7 |
clear history data button |
Deletes every REST API method operation that is currently listed in the Request history popup window. |
Modifying API Settings Directly
When you want to update the settings configured for an API, you would normally do so from the Model Explorer's API Settings area. You also have the option of updating an API's settings directly in the custom API popup window. In the following example, we will configure an API's root node.
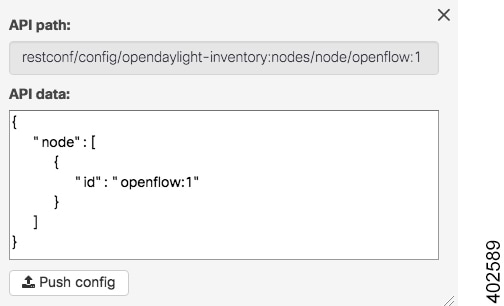
| Step 1 | From the Actions field, click Set custom API to open the custom API popup window. |
| Step 2 | In the API path
field, enter the path for the API you want to modify.
In this example, set the API path to restconf/config/opendaylight-inventory:nodes/node/openflow:1. |
| Step 3 | In the API data
area, enter the setting changes you want to make.
In this example, enter the following text: {"node": [{"id": "openflow:1"}]} |
| Step 4 | Click Push config. |
OpenFlow Manager
The OpenFlow protocol is based on the concept of an Ethernet switch, with an internal flow-table and standardized interface to allow traffic flows on a switch to be added or removed. The OpenFlow protocol defines the communications channel between the OpenFlow agent and the OpenFlow controller. In an OpenFlow network, the OpenFlow Agent exists on the switch and the OpenFlow controller exists on a server, which is external to the switch. Any network management is either part of the controller or accomplished through the controller.
Open SDN Controller relies on the OpenFlow 1.3 plugin to implement OpenFlow support and provide functionality such as connection creation, session management, state management, and error handling. The plugin, which is installed when you install the controller, allows you to manage the OpenFlow-enabled devices in your network via the OpenFlow Manager. The following components make up this application and are described in more detail in this section:
To open the OpenFlow Manager, select OpenFlow Manager from the Applications pane.
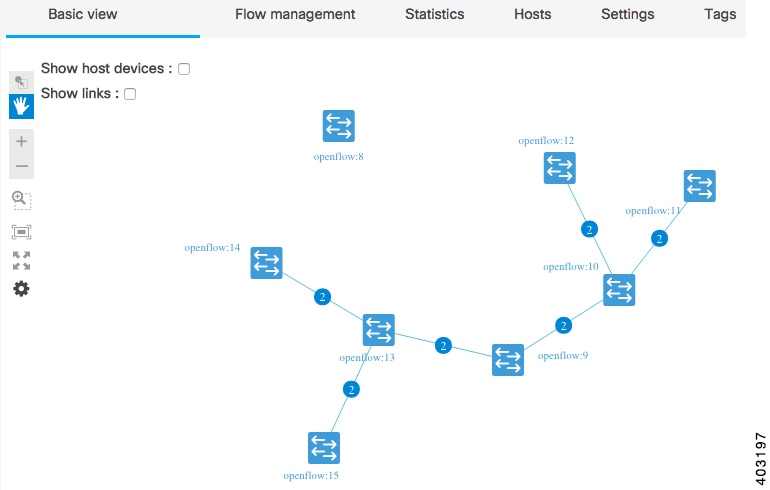
Basic View Tab
By default, the Basic View tab is displayed after you open the OpenFlow Manager. The topology provided here maps the OpenFlow-enabled devices in your network and the hosts that are connected to them.
To display hosts, do the following:
-
Ensure that the L2switch feature is enabled on the controller.
-
If you are using Mininet, discover hosts by running the pingall command from Mininet.
Otherwise, proceed to Step 3.
-
With the Basic View tab open, click the Show host devices check box.
After selecting a device in the topology, you can manage the flows configured on that device and view the corresponding statistics.
Note | To quickly determine a device's neighbor devices, place your cursor over that device's icon in the topology. The icons for any non-neighboring devices are dimmed. |
See the following topics for more information:
-
For information about adding devices to the topology, see Adding OpenFlow-Enabled Devices.
-
For information about configuring secure connections between the controller and devices, see Enabling TLS Support.
-
For a description of the OpenFlow Manager toolbar, see Application Toolbar.
Adding OpenFlow-Enabled Devices
Devices cannot be added to the topology within OpenFlow Manager. To add a device, refer to the Open SDN Controller installation guide and complete the procedure specific to the type of device you are adding:
-
To add a Cisco ASR 9000 Series router, see Configuring OpenFlow Support on a Cisco ASR 9000 Series Router.
-
To add a Cisco Nexus 3000 Series switch, see Configuring OpenFlow Support on a Cisco Nexus 3000 Series Switch.
Flow Management Tab
From this tab, you can perform the following flow management tasks:
-
Determine the number of flows associated with each OpenFlow-enabled device in your network.
-
View a listing of all the flows that are currently configured.
-
Set the deployment mode for a particular device.
-
Add, modify, and activate filters to refine the information displayed in the Flows table.
-
Add, modify, delete, and reload flows.
- Flow Management Tab Workflow
- Adding a Filter
- Activating a Filter
- Modifying a Filter
- Deleting a Filter
- Adding a Flow
- Modifying a Flow
- Deleting a Flow
Flow Management Tab Workflow
The following procedure describes a typical workflow you would employ for this tab.
| Step 1 | With the OpenFlow Manager already open, click the Flow Management tab. | ||
| Step 2 | View the Flow
Summary table at the top of the tab, which lists the number of flows (both
configured and pending) associated with each OpenFlow-enabled device.
| ||
| Step 3 | Set the deployment mode for the devices listed in the Flow Summary
table by clicking the appropriate icon:
For a description of these modes, see Flow Deployment Modes. | ||
| Step 4 | Scroll to the
middle of the tab and manage the filters you want to apply to the Flows table.
See Adding a Filter, Modifying a Filter, and Deleting a Filter for more information. | ||
| Step 5 | Scroll to the
bottom of the tab and manage the flows configured on the controller.
See Adding a Flow, Modifying a Flow, and Deleting a Flow for more information. |
Adding a Filter
To apply a simple filter to the Flows table, enter a value in the filter field that corresponds to a particular column in the Flows table. If you want to create a more robust filter, complete the following procedure.
| Step 1 | From the Filters table toolbar, click the Filter Management icon. |
| Step 2 | Configure the
filter you want to add:
|
| Step 3 | Do one of the following: |
| Step 4 | Click Save and Exit. |
| Step 5 | In the Filters table, confirm that the filter you just created is listed and its check box is selected. |
Activating a Filter
Any filters that have been configured will only be applied to the Flows table if they are active.
Modifying a Filter
Deleting a Filter
There are two ways to delete a filter:
(From the Filters table)
Locate the filter in the table and click the corresponding Delete icon.
(From the Filters creation/modification tab)
Adding a Flow
| Step 1 | From the Flows toolbar, click the Flow Management icon. |
| Step 2 | Configure the
settings for the flow you want to add:
|
| Step 3 | Do one of the following: |
| Step 4 | (Optional) Click Show Preview to view the actual code that will be sent to the controller when you submit your request. |
| Step 5 | Click
Send
Request.
If you have configured multiple flows, click Send All instead. |
| Step 6 | Click the
Reload flows icon to update the Flows table.
The flow you created should now be listed here. |
Modifying a Flow
Deleting a Flow
There are three ways to delete a flow:
(From the Flows table)
To delete an individual flow:
To delete multiple flows:
-
Select the check box for every flow you want to delete.
-
From the Flows toolbar, click the Delete icon.
-
Click OK to confirm deletion in the popup window.
(From the Flows creation/modification tab)
-
From the Flows toolbar, click the Flow Management icon.
-
At the top of the tab, locate the flow you want to delete and click its Delete icon.
Note the following:
Statistics Tab
The Statistics tab provides statistics for both the flows configured in your network and the corresponding device ports.
Statistics Tab Workflow
Complete the following procedure to access these statistics.
| Step 1 | Select OpenFlow Manager from the Applications pane. The Basic View tab is open, by default. |
| Step 2 | Do one of the following: |
| Step 3 | Select the
device(s) you want to view statistics for.
The page updates, displaying the following buttons: |
| Step 4 | Click the button that corresponds to the statistics you want to view and skip ahead to Step 7. |
| Step 5 | From the
Statistics drop-down list, select whether you want to view flow (table) or port
statistics.
If you select the Table Statistics option, proceed to Step 6. Otherwise, skip ahead to Step 7. |
| Step 6 | From the Type drop-down list, select one of the following options: |
| Step 7 | Below the statistics table, specify the number of table rows and objects you want to view and then click Refresh Data. |
Hosts Tab
The Hosts tab provides summary information for the OpenFlow-enabled host devices that Open SDN Controller manages. From here, you can quickly determine things like a host device's ID, attachment point status, and HTS IP address. To specify how many host devices are listed in the Hosts table, select the appropriate value below the table.
Settings Tab
You can configure two settings in the Settings tab: the refresh interval for OpenFlow device statistics and the flow instantiation mode OpenFlow Manager should use.
| Step 1 | With the OpenFlow Manager already open, click the Settings tab. |
| Step 2 | Configure the
following settings:
|
| Step 3 | Click Confirm settings to save your changes to the controller. |
Flow Deployment Modes
In the Settings tab, you can specify OpenFlow Manager to use one of three modes when instantiating flows: Reactive Mode, Proactive Mode, or Integrated Mode.
Note the following:
-
After you install either the odl-l2switch-switch or odl-openflowplugin-apps feature, the deployment-mode-manager feature is available for use. The functionality provided by this feature depends on which of the two previously mentioned features are installed.
-
In the description of each mode, an asterisk indicates that an action is performed only when the odl-l2switch-switch feature is installed.
-
Say you have a scenario where either the odl-l2switch-switch or odl-openflowplugin-apps feature is installed and the deployment mode on certain devices has been changed from the default. After you install the other feature, connected devices are updated with the correct flows based on the deployment mode that was set for each device prior to installation.
-
Reactive mode is the initial default deployment mode that is automatically applied to all connected devices. To set either Proactive or Integrated mode as the default, update the flow deployment mode configuration file:
-
Navigate to the directory in which the configuration file resides:
cd etc/opendaylight/karaf/
-
Open 42-deployment-mode-manager.xml in a text editor.
-
Locate the following line and replace REACTIVE with the mode you want to configure:
<default-deployment-mode>REACTIVE</default-deployment-mode>
When specifying a mode, use all uppercase letters.
-
Save your changes.
-
-
To set a different deployment mode on a particular device, locate the device's entry in the Flow Summary table (in the Flow Management tab) and click the appropriate icon.
-
When you change the default deployment mode, that mode is automatically applied only to newly connected devices from that point on. The deployment mode that’s already set for devices that connected previously is unchanged.
Reactive Mode
When this mode is selected, OpenFlow Manager forwards a flow’s unmatched packets (packets that don’t match any entries in a flow table) to the controller, allowing the controller to decide what to do with them. This decision is then stored as a flow entry in the relevant flow table, allowing any packets received for that flow in the future to be processed without controller intervention.
OpenFlow Manager carries out the following actions when Reactive Mode is selected:
Proactive Mode
When this mode is selected, OpenFlow Manager pushes all known flows to the network elements that handle forwarding before any traffic is received. Since the flows and their corresponding instructions have already been defined, the controller doesn’t need to step in and decide what to do with any unmatched packets (unless that is what you have instructed the controller to do).
OpenFlow Manager carries out the following actions when Proactive Mode is selected:
Integrated Mode
This mode is essentially a hybrid of Reactive and Proactive Mode, instructing the controller to figure out what to do with packets that don’t match any of the flows that have been defined.
OpenFlow Manager carries out the following actions when Integrated Mode is selected:
Determining the Current Deployment Mode
When you need to determine the deployment mode that is currently set for either the controller or a particular device, you can do so by making one of the following POST requests.
Note the following:
-
Before every RESTCONF request you make, you must first generate a security token. See Making RESTCONF Requests for more information.
-
You can also determine the deployment mode that is currently set for the controller by viewing OpenFlow Manager’s Settings tab.
For the Controller
(URL)
https://token:$token@<controller-IP-address>/controller/restconf/operations/deployment-mode:get-deployment-mode
For a Device
(URL)
https://token:$token@<controller-IP-address>/controller/restconf/operations/node-deployment-mode:get-node-deployment-mode
(Payload)
<input xmlns="urn:opendaylight:params:xml:ns:yang:controller:node-deployment-mode">
   <node xmlns:inv="urn:opendaylight:inventory">/inv:nodes/inv:node[inv:id="<OpenFlow-device-ID>"]</node>
</input>
Setting the Deployment Mode Manually
Although you can set the deployment mode for the controller and devices from OpenFlow Manager, you also have the option of doing so manually. To do so, make one of the following POST requests, replacing <deployment-mode> and <OpenFlow-device-ID> with the correct value in the request's payload.
Note | Before every RESTCONF request you make, you must first generate a security token. See Making RESTCONF Requests for more information. |
For the Controller
(URL)
https://token:$token@<controller-IP-address>/controller/restconf/operations/deployment-mode:set-deployment-mode
(Payload)
<input xmlns="urn:opendaylight:params:xml:ns:yang:controller:deployment-mode">
<deployment-mode><deployment-mode></deployment-mode>
</input>
For a Device
(URL)
https://token:$token@<controller-IP-address>/controller/restconf/operations/node-deployment-mode:set-node-deployment-mode
(Payload)
<input xmlns="urn:opendaylight:params:xml:ns:yang:controller:node-deployment-mode">
   <node xmlns:inv="urn:opendaylight:inventory">/inv:nodes/inv:node[inv:id="<OpenFlow-device-ID>"]</node>
   <deployment-mode><deployment-mode></deployment-mode>
</input>
PCEP Manager
Path Computation Element Communication Protocol (PCEP) is a TCP-based protocol that defines a set of messages and objects used to manage PCEP sessions and to request and send paths for multi-domain traffic engineering Label Switched Paths (LSPs). From the PCEP Manager, you can create LSPs between the BGP-enabled devices in your network. To open this application, select PCEP Manager from the Applications pane.
Note the following:
-
The BGPLS Manager and PCEP Manager display the same topology. To add devices to this topology, complete the procedure described in the Adding BGP Devices.
-
The list of configured LSPs that is displayed after you click the Establish LSP icon is not updated in real time. It is refreshed only after a change has been made (such as adding or deleting an LSP).
-
For a description of the PCEP Manager toolbar, see Application Toolbar.
Before You Get Started
Keep the following information in mind before you use the PCEP Manager.
Requirements
The PCEP Manager assumes that:
-
All the BGP-LS/PCEP-enabled routers in your network have a hostname.
-
The BGP-Router-ID, MPLS-TE ID, and PCC value configured for each router is the same IP address.
-
All router IDs must be reachable from the Open SDN Controller host and vice versa. Specifically, the routers must be able to reply to the controller via a static, default, or dynamic route. One of the following must also be true:
Caveats
Troubleshooting
Problem: No nodes are displayed on the topology.
Solution:
-
Make a GET request, using the following URL—
https://token:$token@<controller-IP-address>/controller/restconf/operational/network-topology:network-topology/
topology/example-linkstate-topology
-
In the topology section of the resulting output, find every instance of router-id and note the IP address of the corresponding device.
Every device listed here should be displayed in the topology. If any devices are not displayed, this indicates that they were not configured properly.
Note | For a description of how to make RESTCONF requests in Open SDN Controller, see Making RESTCONF Requests. |
Problem: When two nodes are selected in the Auto Path tab, a list of the available paths between those nodes is not displayed.
Solution:
Creating LSPs
You can create three types of LSPs in PCEP Manager: path-based, hop-based, and manual. Complete the procedure for the LSP type you want to create.
Note | To quickly determine a device's neighbor devices, place your cursor over that device's icon in the topology. The icons for any non-neighboring devices are dimmed. |
Path-Based LSPs
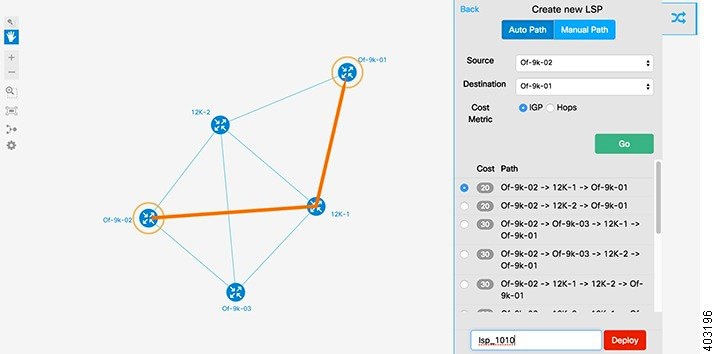
| Step 1 | From the upper
right-hand corner of the content pane, click the Establish LSP icon.
A listing of the LSPs that are currently active is displayed. |
| Step 2 | Click
Create
New LSP.
By default, the Auto Path tab and IGP radio button are already selected. |
| Step 3 | Select the
source and destination device and then click
Go.
A listing of the available paths between the two devices is displayed, sorted by IGP metric order. |
| Step 4 | Select the path you want to use. |
| Step 5 | In the LSP Name field, enter a name for the new LSP and then click Deploy. |
Hop-Based LSPs
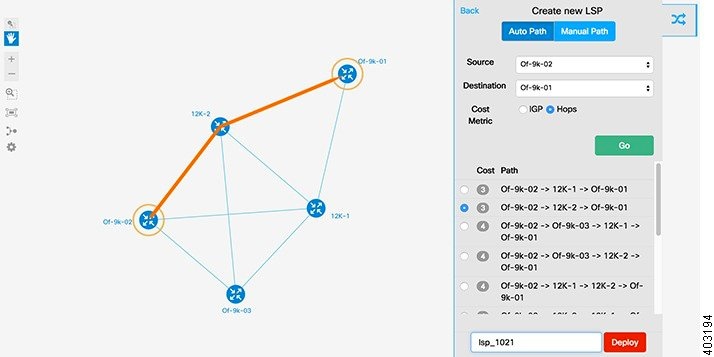
| Step 1 | From the upper
right-hand corner of the content pane, click the Establish LSP icon.
A listing of the LSPs that are currently active is displayed. |
| Step 2 | Click
Create
New LSP.
By default, the Auto Path tab and IGP radio button are already selected. |
| Step 3 | Specify the source and destination device. |
| Step 4 | Select the Hops
radio button and then click
Go.
A listing of the available paths between the two devices is displayed, along with the cost associated with those paths. |
| Step 5 | Select the path you want to use. |
| Step 6 | In the LSP Name field, enter a name for the new LSP and then click Deploy. |
Manual LSPs
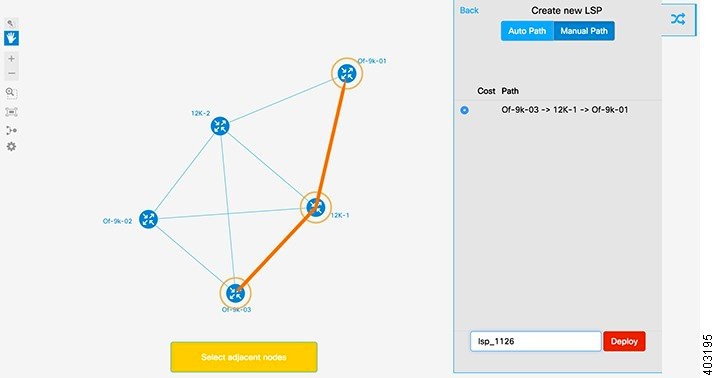
| Step 1 | From the upper
right-hand corner of the content pane, click the Establish LSP icon.
A listing of the LSPs that are currently active is displayed. |
| Step 2 | Click
Create
New LSP.
By default, the Auto Path tab is already selected. |
| Step 3 | Select the Manual Path tab. |
| Step 4 | From the topology, select the source device, adjacent devices, and then the destination device. |
| Step 5 | In the LSP Name field, enter a name for the new LSP and then click Deploy. |
 Feedback