Important.
Results generated by AI. Before using results, verify accuracy and completeness.
Copy
Describes how to monitor network parameters using telemetry data for proactive analysis, including prerequisites, workflow, and step-by-step configuration and verification.
The use case illustrates how, with the dial-in mode, you can use telemetry data to stream various parameters about your network. You use this data for predictive analysis where you monitor patterns, and proactively troubleshoot issues. This use case describes the tools used in the open-sourced collection stack to store and analyse telemetry data.
Note
Watch this video to see how you configure model-driven telemetry to take advantage of data models, open source collectors, encodings and integrate into monitoring tools.
Telemetry involves the following workflow:
Define: You define a subscription to stream data from the router to the receiver. To define a subscription, you create a sensor-group.
Deploy: The receiver initiates a session with the router and establishes a subscription-based telemetry session. The router streams data to the receiver. You verify subscription deployment on the router.
Operate: You consume and analyse telemetry data using open-source tools, and take necessary actions based on the analysis.
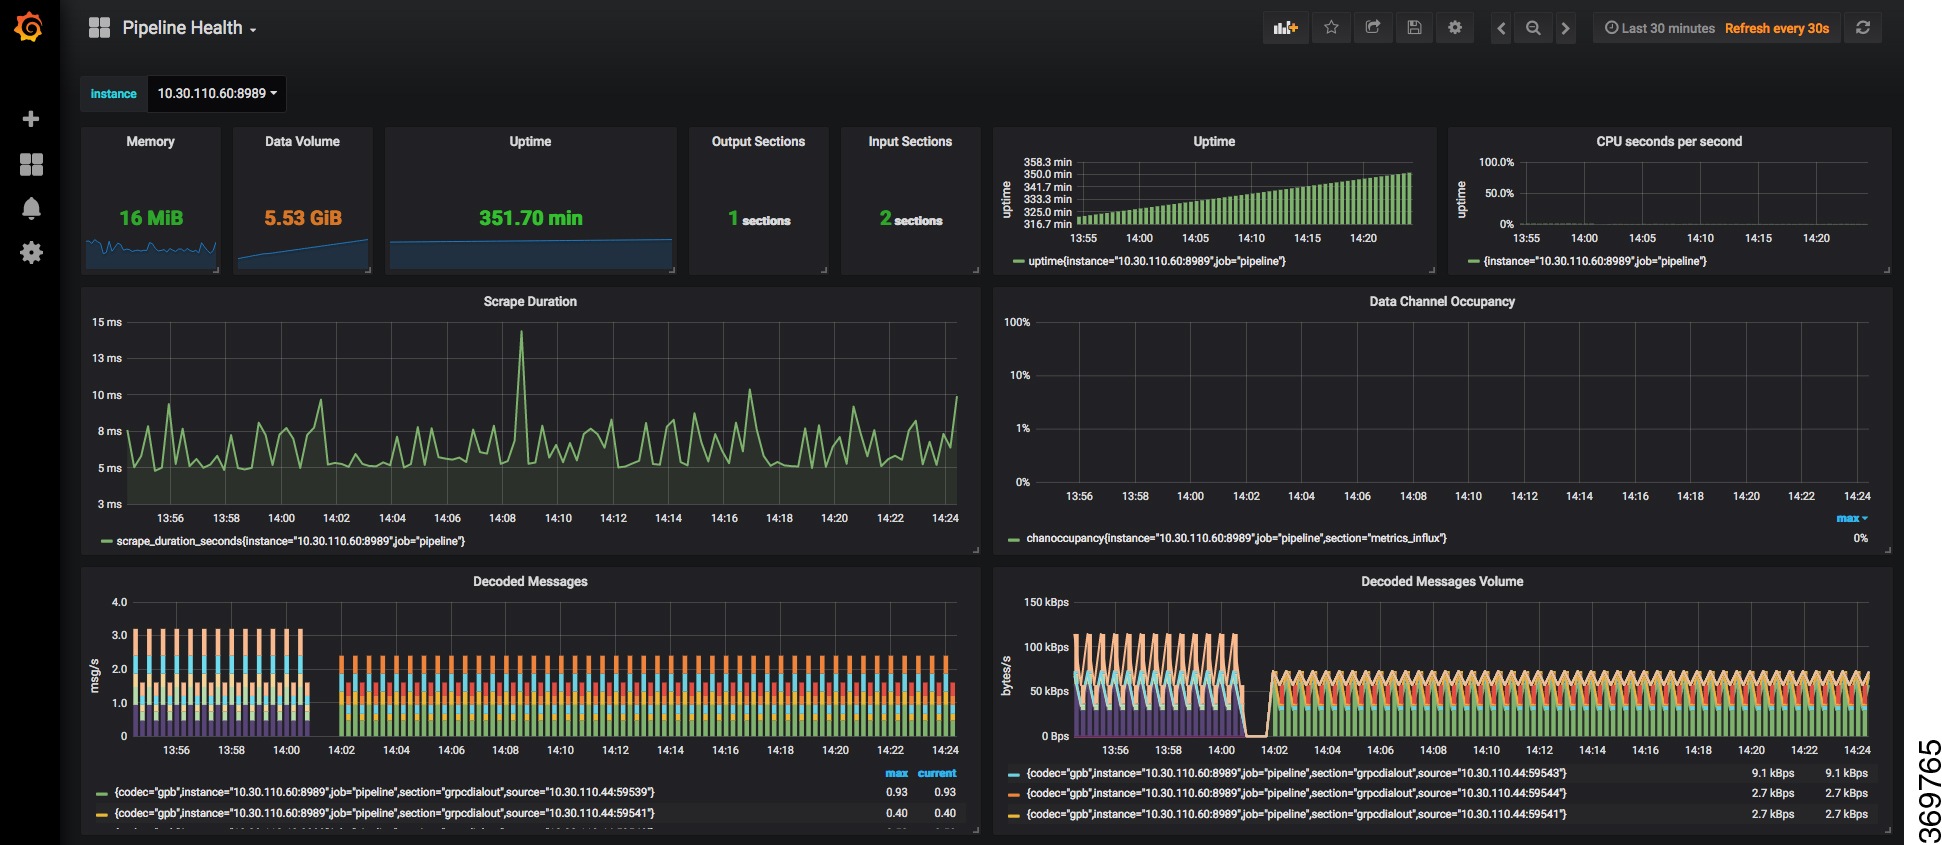
Figure 1. Visual Analysis of Network Health using Telemetry Data
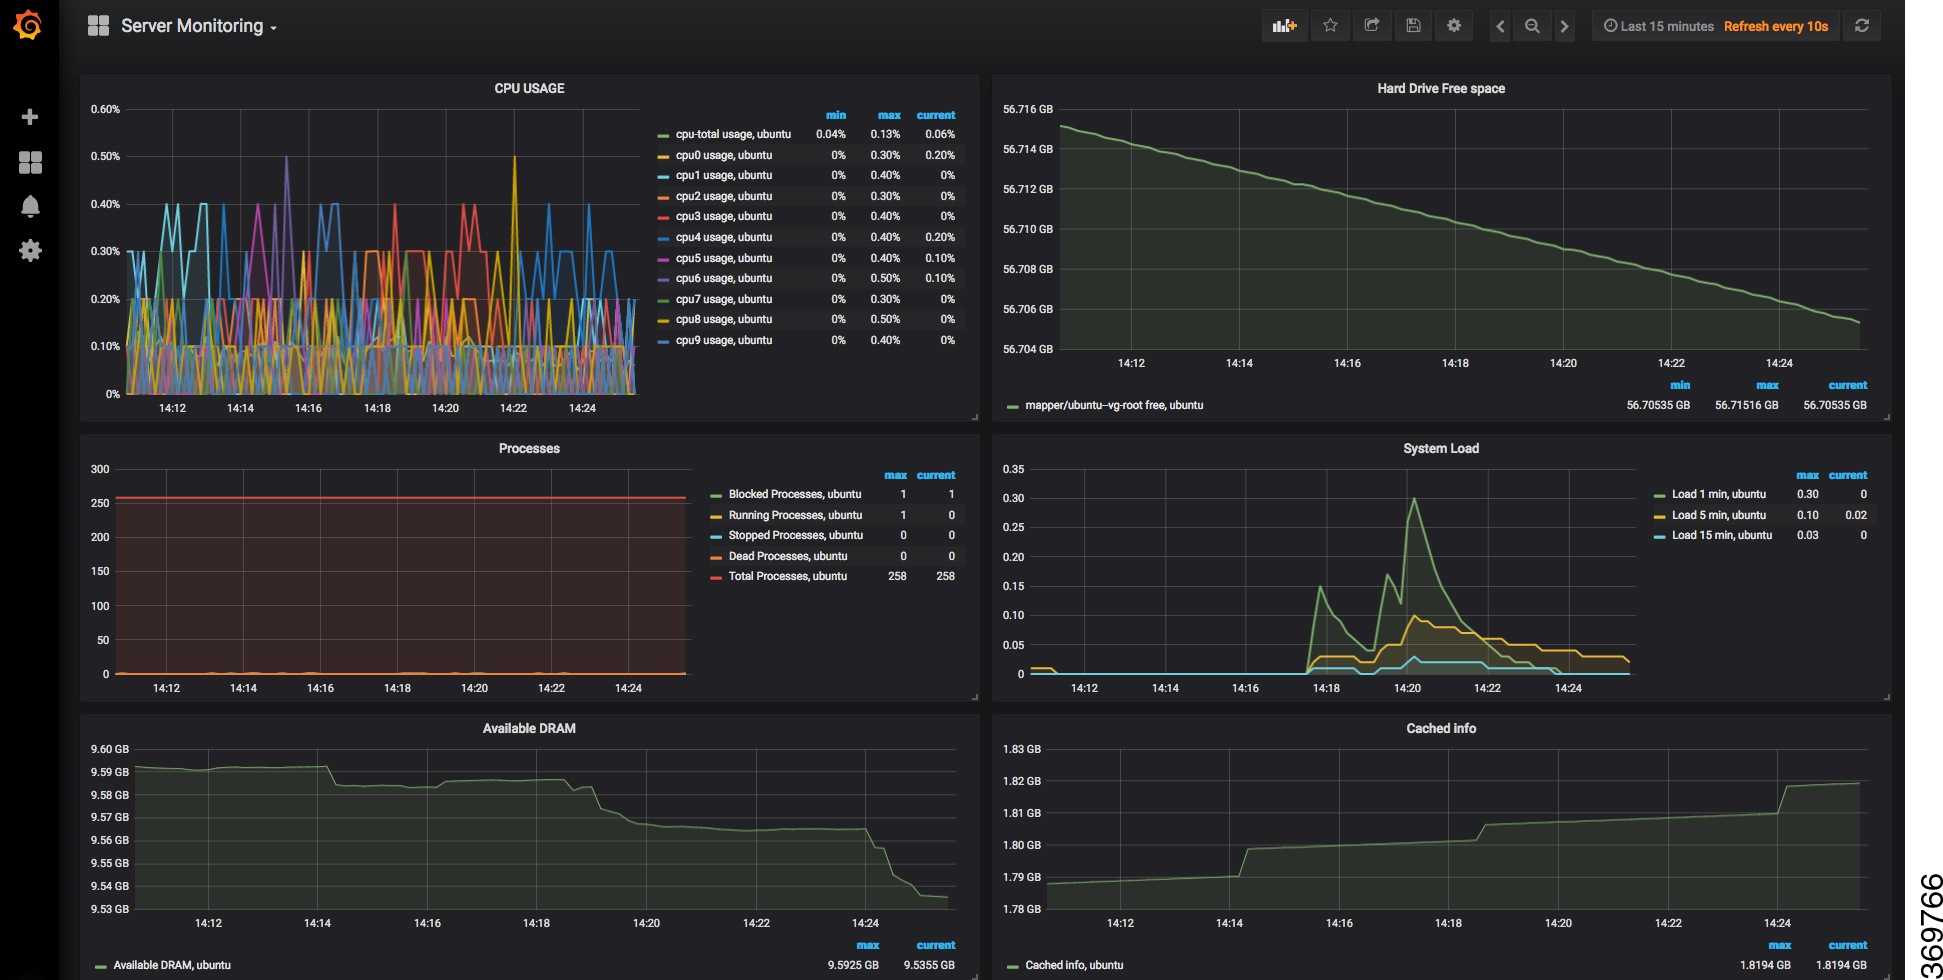
Figure 2. Visual Analysis of System Monitoring using Telemetry Data
Before you begin
Ensure you meet these dependancies:
Make sure you have L3 connectivity between the router and the receiver.
Enable gRPC server on the router to accept incoming connections from the receiver.
For more information, see the Use gRPC Protocol to Define Network Operations with Data Models chapter in the Programmability Configuration Guide for Cisco NCS 6000 Series Routers.
Stream telemetry data out of physical sub-interface.
Stream telemetry data out of bundle interface and sub-interface.
This enhancement to in-band telemetry is supported on 20-Port 100-Gbps (2T) line cards.
Procedure
Define a subscription to stream data from the router to the receiver. Specify the subset of the data that you want to stream from the router using sensor paths. The sensor path represents the path in the hierarchy of a YANG data model. This example uses the native data model Cisco-IOS-XR-um-telemetry-model-driven-cfg.yang. Create a sensor-group to contain the sensor paths.
Subscribe to telemetry data that is streamed from a router. A subscription binds the sensor-group and sets the streaming method. The streaming method can be cadence-driven or event-driven. Separating the sensor-paths into different subscriptions enhances the efficiency of the router to retrieve operational data at scale.
Example:
Note
The configuration for event-driven telemetry is similar to cadence-driven telemetry, with only the sample interval as the differentiator. Configuring the sample interval value to 0 (zero) sets the subscription for event-driven telemetry, while configuring the interval to any non-zero value sets the subscription for cadence-driven telemetry.
Verify deployment of the subscription. The receiver dials into the router to establish a dynamic session based on the subscription. After the session is established, the router streams data to the receiver to create a data lake. Verify the state of the subscription. An Active state indicates that the router is ready to stream data to the receiver based on the subscription.
Example:
Router#show telemetry model-driven subscription
Thu Jan 16 09:48:14.293 UTC
Subscription:  health                   State: Active
-------------
  Sensor groups:
  Id                               Interval(ms)        State
  health                           30000               Resolved

Subscription:  optics                   State: NA
-------------
  Sensor groups:
  Id                               Interval(ms)        State
  optics                           30000               Resolved

Subscription:  mpls-te                  State: NA
-------------
  Sensor groups:
  Id                               Interval(ms)        State
  mpls-te                          30000               Resolved

Subscription:  routing                  State: NA
-------------
  Sensor groups:
  Id                               Interval(ms)        State
  routing                          30000               Resolved

Subscription:  interfaces               State: NA
-------------
  Sensor groups:
  Id                               Interval(ms)        State
  interfaces                       30000               Resolved

Subscription:  CPU-Utilization          State: NA
-------------
  Sensor groups:
  Id                               Interval(ms)        State
  Monitor-CPU                      30000               Resolved

  Destination Groups:
  Id                 Encoding            Transport   State   Port    Vrf     IP
  CPU-Health         self-describing-gpb tcp         NA      57500           172.0.0.0
    No TLS
The router streams data to the receiver using the subscription-based telemetry session and creates a data lake in the receiver.
Operate on telemetry data for in-depth analysis of the network. Start Pipeline from the shell, and enter your router credentials. The streamed telemetry data is stored in InfluxDB.
Example:
$ bin/pipeline -config pipeline.conf

Startup pipeline
Load config from [pipeline.conf], logging in [pipeline.log]

CRYPT Client [grpc_in_mymdtrouter], [http://172.0.0.0:5432]
 Enter username: <username>
 Enter password: <password>
Wait for ^C to shutdown
The streamed telemetry data is stored in InfluxDB.
Use Grafana to create a dashboard and visualize the streamed data.
Figure 3. Visual Analysis of Network Health using Telemetry Data
Figure 4. Visual Analysis of System Monitoring using Telemetry Data
In conclusion, telemetry data shows that various parameters of the network can be monitored simultaneously. This data is streamed in near real-time without affecting the performance of the network. With this data, you gain better visibility into your network.
Once completed, the router streams telemetry data to the receiver, creating a data lake for proactive analysis. You can visualize and analyze network health and performance using open-source tools such as Pipeline, InfluxDB, and Grafana.
What to do next
Review the dashboards and analysis results in Grafana and InfluxDB to proactively monitor and troubleshoot network issues.