Feature Information for Performance Measurement for Traffic Engineering
The following table provides release information about the feature or features described in this module. This table lists only the software release that introduced support for a given feature in a given software release train. Unless noted otherwise, subsequent releases of that software release train also support that feature.
Use Cisco Feature Navigator to find information about platform support and Cisco software image support. To access Cisco Feature Navigator, go to www.cisco.com/go/cfn. An account on Cisco.com is not required.|
Feature Name |
Releases |
Feature Information |
|---|---|---|
|
Link Delay Measurement |
Cisco IOS XE Bengaluru 17.4 |
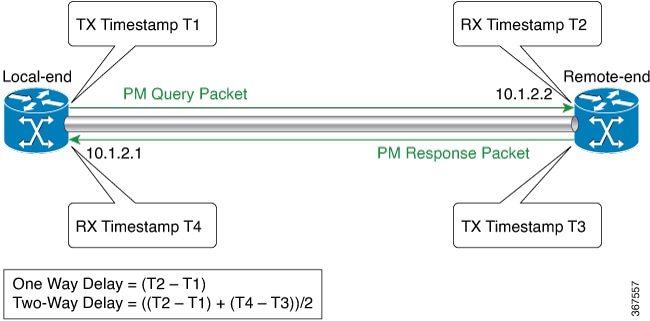
Metrics such as packet loss, delay, delay variation (jitter) and bandwidth utilization help you evaluate the performance of your network. You can use these metrics as input for Traffic Engineering (TE) and direct the flow of traffic through the network to conform to Service Level Agreements (SLAs). With this feature, you can configure the measurement and advertisement of link delay metrics for TE. |

 Feedback