Getting Your Cisco ACI Fabrics Ready for Cisco Nexus Dashboard Insights
Available Languages
Bias-Free Language
The documentation set for this product strives to use bias-free language. For the purposes of this documentation set, bias-free is defined as language that does not imply discrimination based on age, disability, gender, racial identity, ethnic identity, sexual orientation, socioeconomic status, and intersectionality. Exceptions may be present in the documentation due to language that is hardcoded in the user interfaces of the product software, language used based on RFP documentation, or language that is used by a referenced third-party product. Learn more about how Cisco is using Inclusive Language.
- US/Canada 800-553-2447
- Worldwide Support Phone Numbers
- All Tools
 Feedback
 Feedback
Contents
Cisco Nexus Dashboard Insights Configuration Prerequisites for Cisco ACI Fabrics
Single Pod Grandmaster Configuration:
Monitoring Policy (Fabric Node Control Policy)
Cisco Nexus Dashboard Configuration
Adding a Cisco ACI Site to Cisco Nexus Dashboard
(Optional) Configuring External Service Pools – Required for NetFlow
Cisco Nexus Dashboard Insights Setup
Configuration Steps for Cisco Nexus Dashboard Insights 6.x Site Group:
Configuration Steps for a Cisco Nexus Insights Release 5.x Site
Cisco ACI NetFlow Configuration
Connectivity to Cisco Nexus Dashboard Data Interface Verification
Network Time Protocol Verification
Cisco APIC Network Time Protocol Verification
Switch Network Time Protocol Verification
Precision Time Protocol Verification
Fabric Node Control Verification
Cisco Nexus Dashboard Insights is the Day-2-Operations tool for Cisco Data Center fabrics. Focusing on anomalies in the network, Cisco Nexus Dashboard Insights gives operators quick visibility into the network health through a modern and scalable architecture. For more information, see the Cisco Nexus Dashboard Insights White Paper.
This document is intended to serve as a checklist and guide for configuring Cisco ACI fabrics to support Cisco Nexus Dashboard Insights. In this white paper, prerequisites such as in-band management, how to connect Cisco Nexus Dashboard to Cisco ACI, Network Time Protocol (NTP), Precision Time Protocol (PTP), and Monitoring policies will be discussed. Further, the configuration of Cisco Nexus Dashboard and Cisco Nexus Dashboard Insights to onboard apps will be covered. Finally, there will be a verification and troubleshooting section.
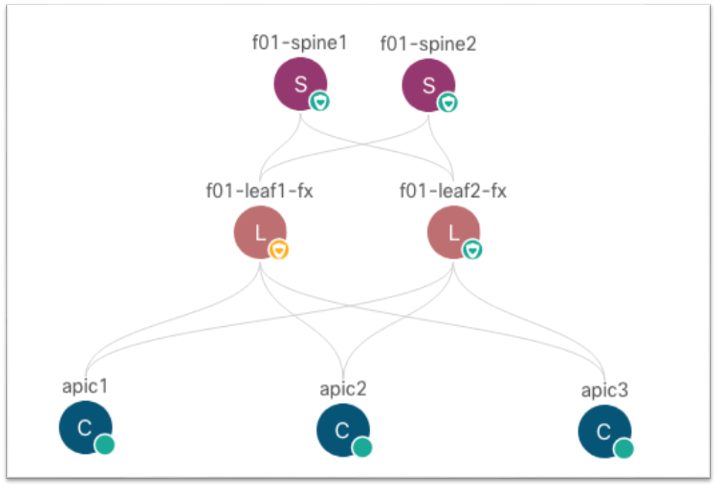
We will use an example fabric with the following topology to configure the below settings. This fabric is running release 5.1(3e) and is cabled in the following manner:
Note: The documentation set for this product strives to use bias-free language. For the purposes of this documentation set, bias-free is defined as language that does not imply discrimination based on age, disability, gender, racial identity, ethnic identity, sexual orientation, socioeconomic status, and intersectionality. Exceptions may be present in the documentation due to language that is hardcoded in the user interfaces of the product software, language used based on RFP documentation, or language that is used by a referenced third-party product.
Cisco Nexus Dashboard Insights Configuration Prerequisites for Cisco ACI Fabrics
The Cisco Nexus Dashboard Insights service uses the Cisco ACI in-band management network to receive the network telemetry data from the Cisco APIC controllers and all the switches in the fabric. Therefore, you must configure in-band management for your Cisco ACI fabric. The in-band management configuration can be summarized with the following major pieces:
● Access Policies for Cisco APIC interfaces (access ports)
● MGMT tenant in-band bridge domain with a subnet
● MGMT tenant node management address (Cisco APIC, leaf switch, and spine switch)
● MGMT tenant node management EPG for in-band management
This section shows how to configure the in-band management EPG and allocate in-band IP addresses to the fabric devices. For more information, see the Cisco APIC Basic Configuration Guide, Release 5.1(x) - Management.
You must open specific ports to use in-band management. For information about which ports to open, see the various "Communication Ports" sections of the Cisco Nexus Dashboard User Guide for the release that you deployed.
The steps include:
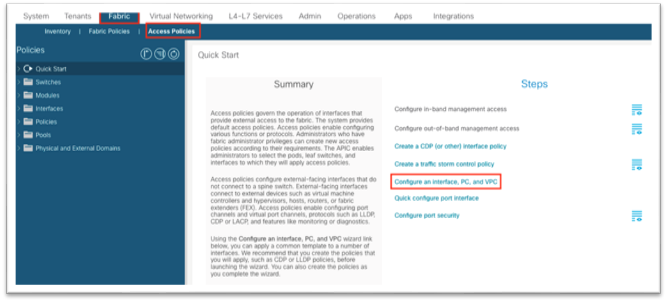
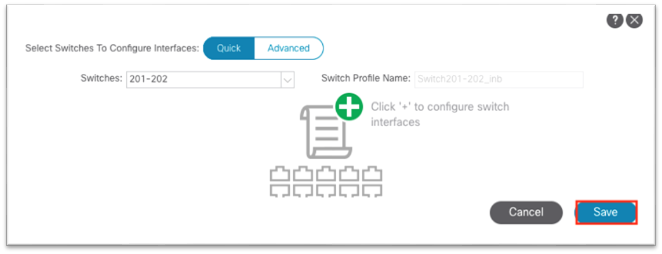
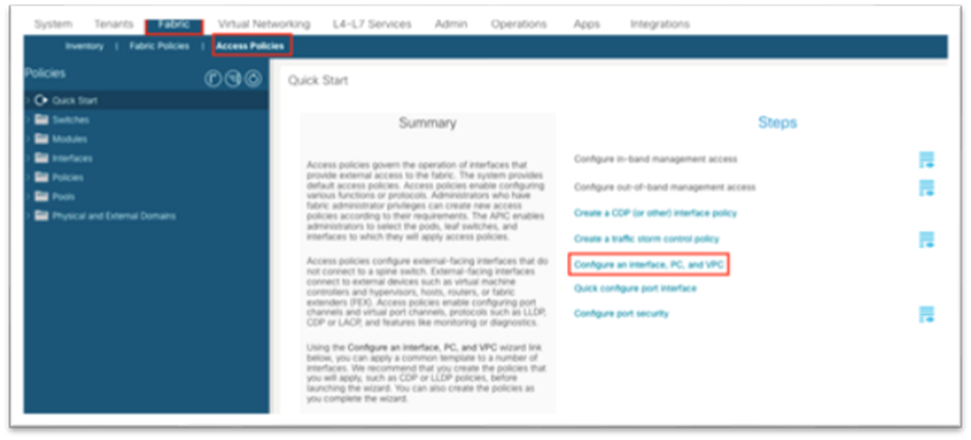
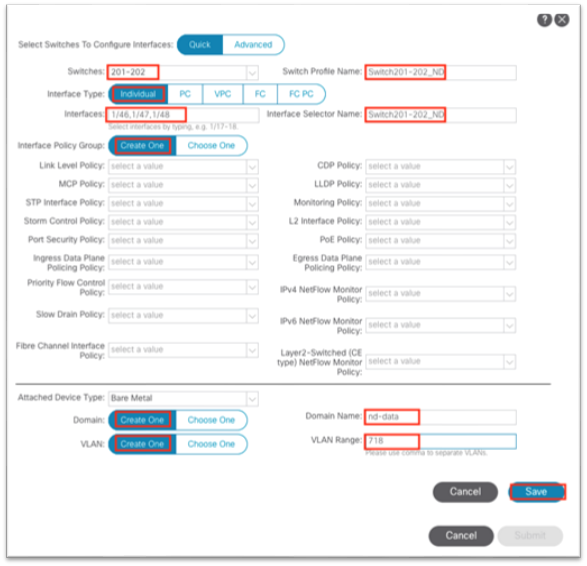
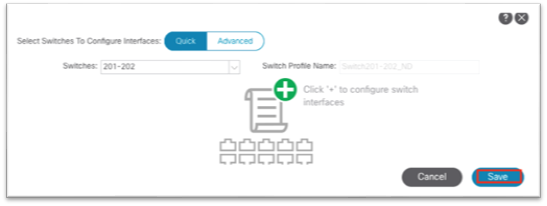
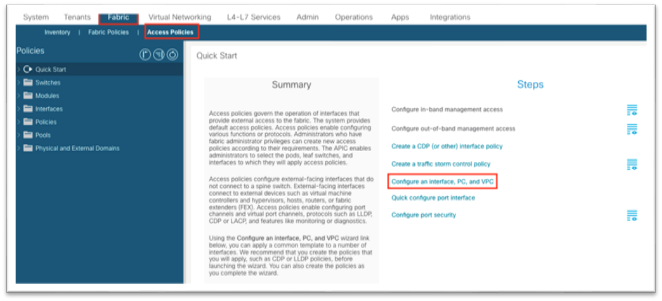
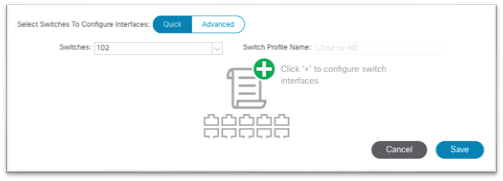
1. Navigate to Fabric > Access Policies and in the Quick Start menu, choose Configure Interface, PC and vPC.
2. In the dialog, click the green plus + symbol twice to expand the wizard.
a. Select the two switches where the Cisco APIC ports are connected from the drop-down list.
b. Enter a name in the Switch Profile Name field.
c. Set the Interface Type to Individual.
d. In the Interfaces field, enter the Cisco APIC interfaces either as a comma-separated list or as a range.
e. Enter a name in the Interface Selector Name field.
f. Set the Interface Policy Group to Create One. You do not need to select an interface-level policy; the defaults are sufficient.
g. In the Attached Device Type drop-down list, choose Bare Metal.
h. The Domain and VLAN should both be set to Create One.
i. Enter a name in the Domain Name field to name the physical domain that is associated with in-band management.
ii. Enter a VLAN ID that will be used for in-band management in the fabric.
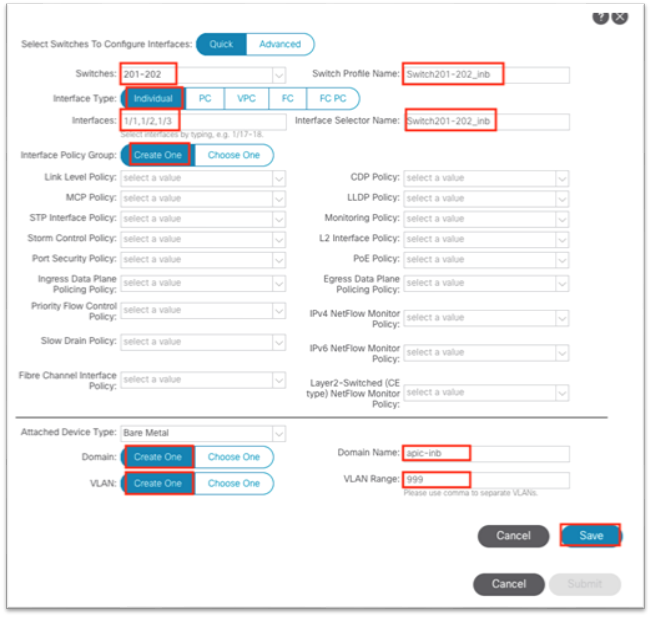
i. Click Save.
j. Click Save again.
k. Click Submit.
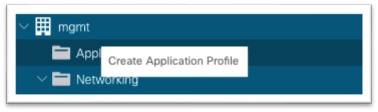
3. Navigate to Tenants > mgmt.
4. Expand Networking > Bridge Domains > inb.
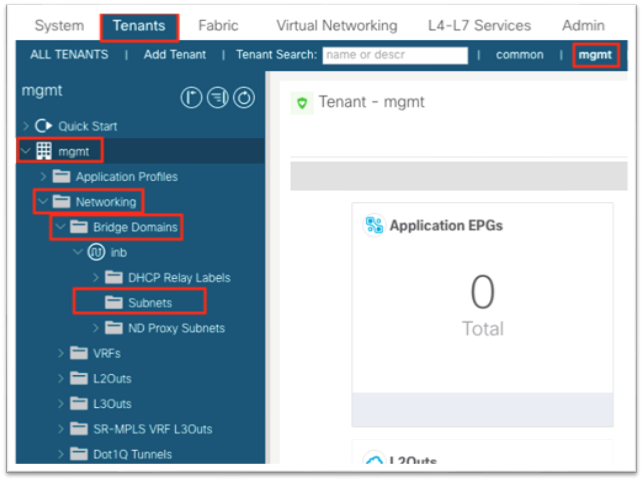
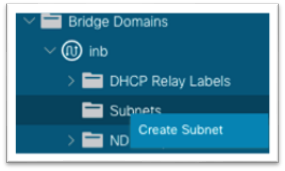
5. Right-click the Subnets folder and choose Create Subnet.
6. In the dialog, enter the gateway IP address of the in-band management subnet.
a. Choose Advertised Externally if needed for L3Out advertisement.
7. Click Submit.
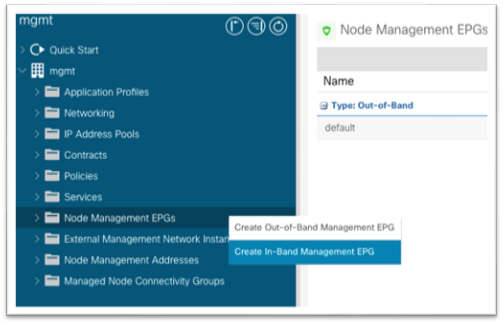
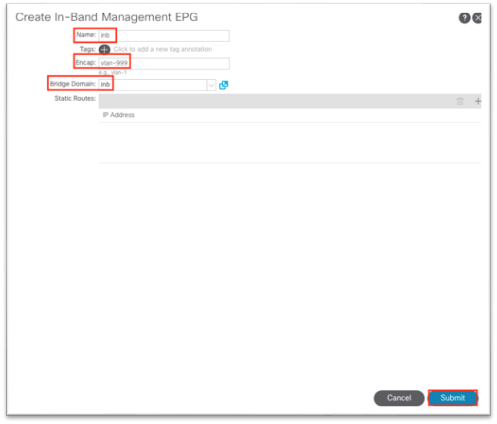
8. Still in the mgmt tenant, right-click the Node Management EPGs folder and choose Create In-Band Management EPG.
9. In the dialog:
a. Enter a name for the in-band management EPG.
b. Enter the VLAN defined in step 2.h.ii when configuring access policies. Use "VLAN-###" as the format.
c. In the Bridge Domain drop-down list, choose the in-band bridge domain.
d. Click Submit.
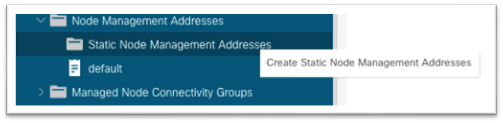
10. Still in the mgmt tenant, expand Node Management Addresses.
11. Right-click Static Node Management Addresses and choose Create Static Node Management Addresses.
12. In the dialog:
a. For Node Range, enter a range of 1 to 1 to configure Cisco APIC 1.
b. Put a check in the In-band Addresses check box.
c. In the In-Band Management EPG drop-down list, choose the EPG that you created in step 9.
d. In the In-Band IPv4 Address field, enter the IP address that should be used for the node with the CIDR mask.
e. In the In-Band IPv4 Gateway field, enter the IP address of the gateway assigned to the in-band bridge domain in step 6.
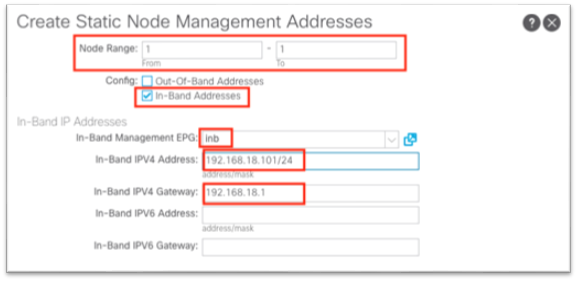
f. Click Submit.
13. Repeat step 12 for each Cisco APIC using node ID 1, 2, 3 and so on as needed. Likewise, repeat the step for each leaf and spine node ID in the fabric.
Connecting Cisco ACI In-band Management Network with the Cisco Nexus Dashboard Data Network - Option 1a: Directly Connected to an EPG via Phyiscal Domain and Static Path Binding
Cisco Nexus Dashboard data interfaces network should be reachable to the Cisco ACI in-band network. For simplicity, there are two major connectivity options available to accomplish this:
● Cisco Nexus Dashboard as an endpoint inside Cisco ACI, residing in a new and unique bridge domain and EPG combination
● Cisco Nexus Dashboard reachable using a L3Out in the MGMT tenant in-band VRF instance
With the first option, the Cisco Nexus Dashboard should be learned as a Layer 3 endpoint in Cisco ACI and the Cisco ACI fabric should act as the gateway for the Cisco Nexus Dashboard. To reach the in-band bridge domain subnet, either deploy the Cisco Nexus Dashboard bridge domain locally inside the MGMT tenant tied to the in-band VRF instance, otherwise route leaking would be necessary to leak the Cisco Nexus Dashboard subnet into the in-band VRF instance and likewise the in-band bridge domain subnet into the Cisco Nexus Dashboard VRF instance.
The steps Include:
1. Navigate to Fabric > Access Policies and in the Quick Start menu choose Configure Interface, PC and vPC.
2. In the dialog, click the green plus + symbol twice to expand the wizard.
a. Select the two switches where the Cisco Nexus Dashboard Data ports are connected from the drop-down list.
b. Enter a name in the Switch Profile Name field.
c. Set the Interface to Individual.
d. In the Interfaces field, enter the Cisco Nexus Dashboard interfaces as either a comma-separated list or as a range.
e. Enter a name in the Interface Selector Name field.
f. Set the Interface Policy Group to Create One. You do not need to select an interface-level policy; the defaults are sufficient.
g. In the Attached Device Type drop-down list, choose Bare Metal.
h. The Domain and VLAN should both be set to Create One.
i. Enter a name in the Domain Name field to name the physical domain that is associated with in-band management.
ii. Enter a VLAN ID that will be used for static path bindings in the fabric.
i. Click Save.
j. Click Save again.
k. Click Submit.
3. Navigate to Tenants > mgmt.
4. Expand Networking > Bridge Domains.
5. Right-click the Bridge Domains folder and choose Create Bridge Domain.
6. Enter a name for the bridge domain.
a. In the VRF drop-down list, choose inb.
b. Click Next.
c. Click the + symbol in the Subnets area to bring up a dialog.
i. Enter the Cisco Nexus Dashboard Data Network gateway IP address and CIDR mask.
ii. Choose Advertise Externally as needed.
iii. Click OK.
d. If necessary, under Associated L3Outs, click the + and choose the in-band VRF instance L3Out.
e. Click Next.
f. Click Finish.
7. Still under the mgmt tenant, navigate to Application Profiles and right-click and choose Create Application Profile.
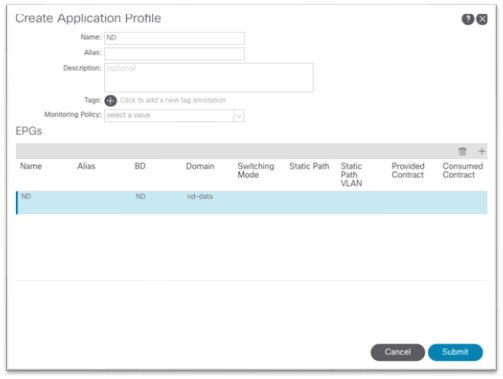
8. In the dialog, enter a name for the application profile.
9. Under EPGs, click the + symbol.
a. Enter a name for the EPG where the Cisco Nexus Dashboard data interface will belong.
b. Choose the bridge domain created in step 5.
c. Choose the physical domain that you created earlier.
d. Click Update.
e. Click Submit.
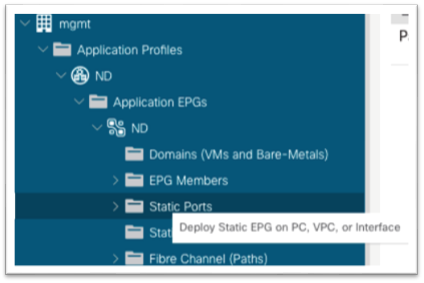
10. Expand the newly created Application Profile > Application EPGs > EPG and click the Static Ports folder.
a. Right-click the folder and select Deploy Static EPG on PC, vPC, or Interface.
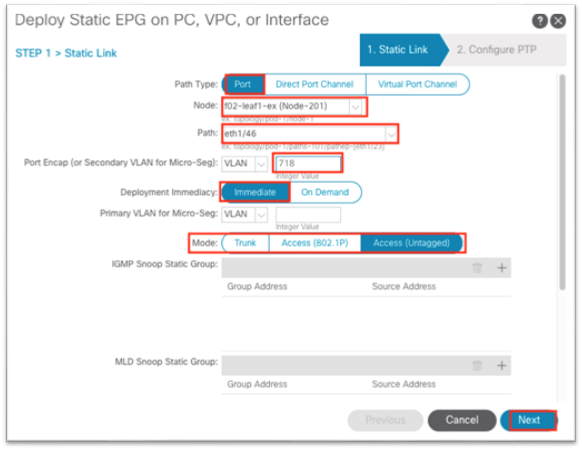
b. In the dialog, choose Port.
c. In the Node drop-down list, choose the first leaf node where the first Cisco Nexus Dashboard Data interface is connected.
d. In the Path drop-down list, choose the interface on the node where the Cisco Nexus Dashboard Data interface is connected.
e. In the Port Encap field, enter the VLAN number that you created earlier when defining the VLAN pool under the access policies.
f. For Deployment Immediacy, choose Immediate.
g. For Mode, choose the appropriate mode based on how the Cisco Nexus Dashboard appliance was configured.
i. If the Cisco Nexus Dashboard was configured with a VLAN TAG, choose Trunk.
ii. If the Cisco Nexus Dashboard was configured without a VLAN TAG, choose Access.
h. Click Next.
i. Click Finish.
j. Repeat this process for all Cisco Nexus Dashboard Data interfaces connected to the fabric.
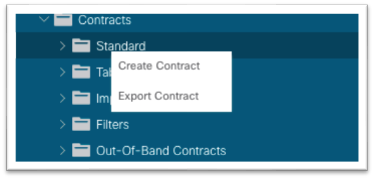
11. Still under the mgmt tenant, navigate to Contracts and expand the folder.
12. Right-click Standard and choose Create Contract.
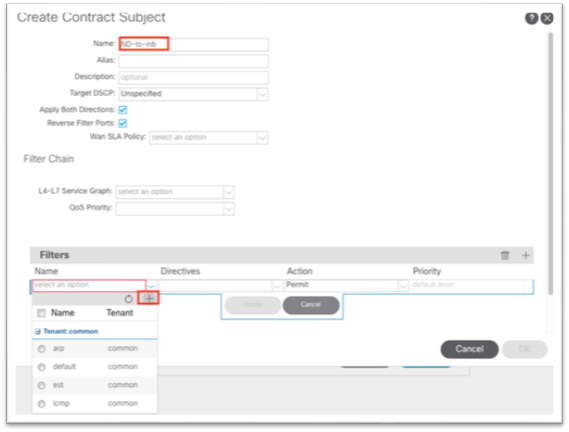
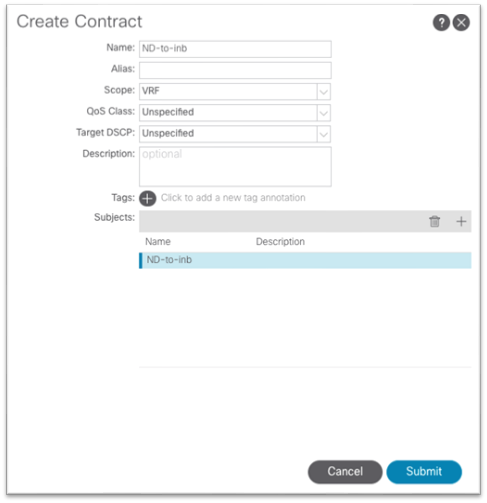
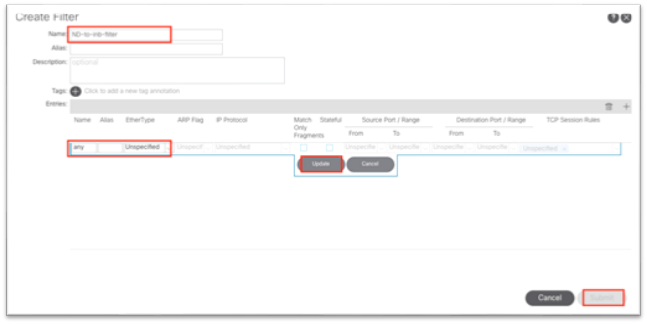
13. In the dialog, name the contract. Use a name that is clear in terms of the flow. For example: ND-to-inb.
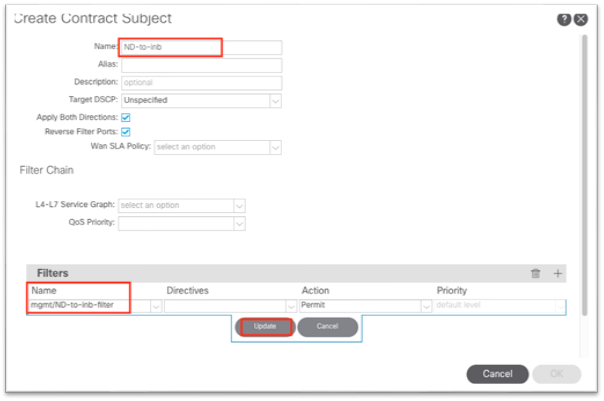
a. Click the + to create a subject.
i. In the new dialog, name the subject.
ii. Click the + to create a new filter.
iii. Expand the drop-down list under Name and click the + to create a new filter.
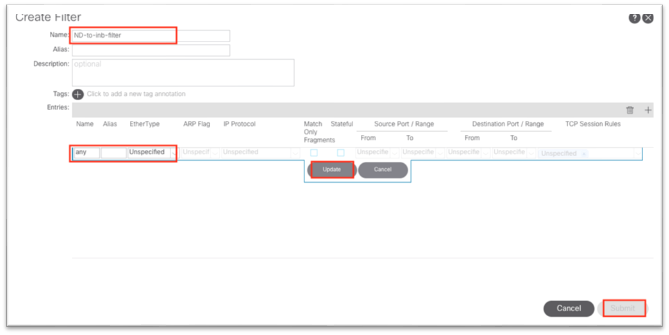
iv. In the new dialog, name the filter.
v. Click the + under Entries.
vi. Name the entry.
vii. Choose the Ether Type from the drop-down list. For allowing all communications, leave the value as unspecified.
viii. Choose the IP protocol.
ix. Enter the destination port.
x. Click Update.
xi. Click Submit in the Create Filter dialog. The new filter should be selected under the Create Contract Subject.
b. Click Update.
c. Click OK to complete the subject.
d. The subject should show up under the Subjects section of the Create Contract dialog.
e. Click Submit.
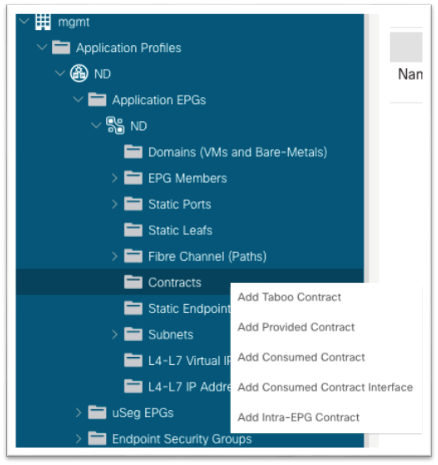
14. Still in the mgmt tenant, navigate to Application Profiles > your-AP-name > Application EPGs > your-EPG-name, and right-click Contracts, and choose Add Consumed Contract.
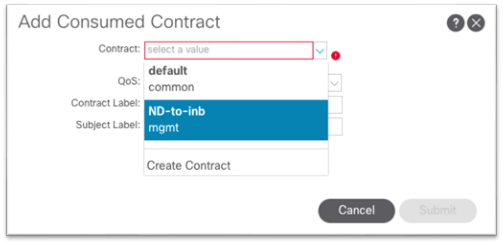
15. In the dialog, in the Contract drop-down list, choose the contract that you created in step 13.
a. Click Submit.
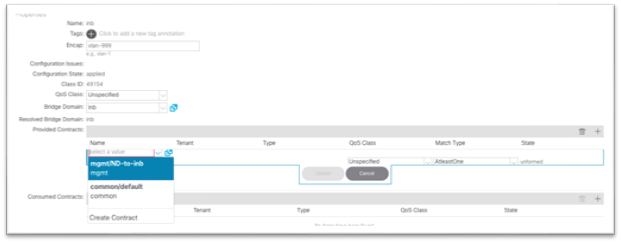
16. Still in the mgmt tenant, navigate to Node Management EPGs and choose the in-band EPG.
17. Under Provided Contracts, click the + and in the Name drop-down list, choose the contract that you created in step 13.
18. Click Update.
This completes the connectivity section for Cisco Nexus Dashboard being directly connected to an EPG toward in-band management.
In Cisco ACI, VMM integration is a process that leverages external virtualization controller northbound APIs to manage network constructs in a programmable, automated, and highly scalable manner. Multiple hypervisor vendors are supported. See the Virtualization Compatability Matrix for more information. For more information on VMM integration, see the Cisco ACI Virtualization Guide.
With Cisco Nexus Dashboard release 2.1, the virtual form factor use case is expanded into Cisco Nexus Dashboard Insights. Currently, VMware vCenter (.ova) and KVM (.qcow2) virtual machines are supported. For detailed information on virtual Cisco Nexus Dashboard and its deployment, see the Cisco Nexus Dashboard 2.1 Deplyoment Guide. The main requirements around connectivity remain, whereby the data interface of the virtual Cisco Nexus Dashboard would need access to the inband management network of Cisco ACI. For the purpose of this document, we will assume VMM Integration is in place either to VMware vCenter or to Red Hat Virtualization.
Similar to option 1a, the assumption here is that the virtual Cisco Nexus Dashboard is directly connected using a supported hypervisor to a leaf switch or through a single intermediate switch. The virtual Cisco Nexus Dashboard should be learned as a Layer 3 endpoint in Cisco ACI and the Cisco ACI fabric should act as the gateway for the Cisco Nexus Dashboard. To reach the in-band bridge domain subnet, either deploy the Cisco Nexus Dashboard bridge domain locally inside the MGMT tenant tied to the in-band VRF instance, otherwise route leaking would be necessary to leak the Cisco Nexus Dashboard subnet into the in-band VRF instance and likewise the in-band bridge domain subnet into the Cisco Nexus Dashboard VRF instance.
By virtue of the VMM integration, there is no need to program the leaf switch interfaces manually for where the hypervisor that hosts the virtual Cisco Nexus Dashboard will be connected. VMM integration will dynamically program the VLAN on the port where the VM is detected. The only thing that is required is the correct access policies as well as associating the VMM domain to the EPG.
Prerequisites:
· An existing VMM domain
o Access policies for a new hypervisor tied to an existing VMM domain
o Existing hypervisor with configured access policies tied to the existing VMM domain
This section focuses on the tenant aspect, including:
· Tenant policies
o Bridge domain for Cisco Nexus Dashboard Data interface and matching EPG inside an application profile.
o Bridge domain subnet for Cisco Nexus Dashboard Data interface
o Contract allowing communication to the in-band (node control) EPG
The steps Include:
1. Navigate to Tenants > mgmt.
2. Expand Networking > Bridge Domains.
3. Right-click the Bridge Domains folder and choose Create Bridge Domain.
4. Enter a name for the bridge domain.
a. In the VRF drop-down list, choose inb.
b. Click Next.
c. Click the + symbol in the Subnets area to bring up a dialog.
i. Enter the Cisco Nexus Dashboard Data Network gateway IP address and CIDR mask.
ii. Choose Advertise Externally as needed.
iii. Click OK.
d. If necessary, under Associated L3Outs, click the + and choose the in-band VRF instance L3Out.
e. Click Next.
f. Click Finish.
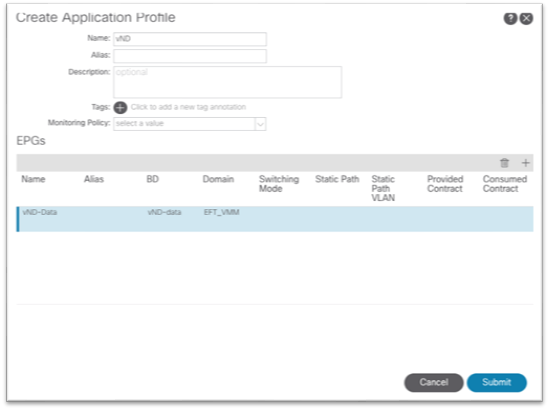
5. Still under the mgmt tenant, navigate to Application Profiles and right-click and choose Create Application Profile.
6. In the dialog, enter a name for the application profile.
7. Under EPGs, click the + symbol.
a. Enter a name for the EPG where the Cisco Nexus Dashboard data interface will belong.
b. Choose the bridge domain created in step 5.
c. Choose the VMM domain.
d. Click Update.
e. Click Submit.
8. Still under the mgmt tenant, navigate to Contracts and expand the folder.
9. Right-click Standard and choose Create Contract.
10. In the dialog, name the contract. Use a name that is clear in terms of the flow. Example: ND-to-inb.
a. Click the + to create a subject.
i. In the new dialog, name the subject.
ii. Click the + to create a new filter.
iii. Expand the drop-down list under Name and click the + to create a new filter.
iv. In the new dialog, name the filter.
v. Click the + under Entries.
vi. Name the entry.
vii. Choose the Ether Type from the drop-down list. For allowing all communications, leave the value as unspecified.
viii. Choose the IP protocol.
ix. Enter the destination port.
x. Click Update.
xi. Click Submit in the Create Filter dialog. The new filter should be selected under the Create Contract Subject.
b. Click Update.
c. Click OK to complete the subject.
d. The subject should show up under the Subjects section of the Create Contract dialog.
e. Click Submit.
11. Still in the mgmt tenant, navigate to Application Profiles > your-AP-name > Application EPGs > your-EPG-name, and right-click Contracts, and choose Add Consumed Contract.
12. In the dialog, in the Contract drop-down list, choose the contract that you created in step 13.
a. Click Submit.
13. Still in the mgmt tenant, navigate to Node Management EPGs and choose the in-band EPG.
14. Under Provided Contracts, click the + and in the Name drop-down list, choose the contract that you created in step 13.
15. Click Update.
This completes the connectivity section for virtual Cisco Nexus Dashboard being directly connected to an EPG leverageing VMM Integration.
Connecting Cisco ACI In-band Management Network with the Cisco Nexus Dashboard Data Network - Option 2: Any Infra (Using an L3Out)
In this deployment model, the Cisco Nexus Dashboard data interface is located external to Cisco ACI on any infra. The data network must have reachability to the Cisco ACI in-band management network and likewise Cisco ACI in-band must have reachability to the Cisco Nexus Dashboard data interfaces. For Cisco ACI internal VRF instances to communicate with outside networks, an L3Out is required to establish peering with an external router.
This section will go over the high-level steps to configure an L3Out for the in-band management VRF instance "inb" and advertise the in-band bridge domain subnet out as well as learn and apply the policy to external subnets such as the Cisco Nexus Dashboard data interface.
The any infra configuration can be summarized with the following major pieces:
● Access policies for L3Out
● Configuring the L3Out
● Contracts between in-band EPG and L3Out External EPG
For more information, see the Cisco APIC Layer 3 Networking Configuration Guide, Release 5.2(x) and Cisco ACI Fabric L3Out Guide white paper.
The steps include:
1. Navigate to Fabric > Access Policies and in the Quick Start menu, choose Configure Interface, PC and vPC.
2. In the dialog, click the green plus + symbol twice to expand the wizard.
a. Choose from the drop-down list the switches where the external router is connected.
b. Enter a name in the Switch Profile Name field.
c. Set the Interface Type to Individual.
d. In the Interfaces field, enter the ports where the external router is connected either as a comma-separated list or as a range.
e. Enter a name in the Interface Selector Name field.
f. Set the Interface Policy Group to Create One. Choose the appropriate interface level properties needed for the external router.
g. In the Attached Device Type drop-down list, choose Bare Metal.
h. The Domain and VLAN should both be set to Create One.
i. Enter a name in the Domain Name field to name the physical domain that is associated with in-band management.
ii. Enter a VLAN ID that will be used for static path bindings in the fabric.
i. Click Save.
j. Click Save again.
k. Click Submit.
3. Navigate to Tenants > mgmt.
4. Expand Networking.
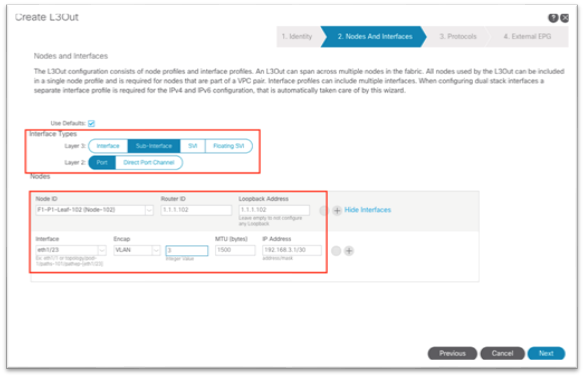
5. Right-click the L3Outs folder and choose Create L3Out.
6. In the new dialog:
a. Enter a name for the L3Out.
b. Choose the VRF instance.
c. Choose the Layer 3 domain that you created in the previous steps.
d. Choose the routing protocol or leave the field blank for static routing.
e. Click Next.
f. Choose the Layer 3 and Layer 2 interface type.
g. Choose the node, and enter a router ID and loopback if necessary.
h. Choose the interface and enter the appropriate parameters.
i. Click Next.
j. Use the drop-down list to choose the appropriate interface protocol policy.

k. Click Next.
l. Enter the name for the external EPG.
m. Click Finish.
7. Still under the mgmt tenant, navigate to Networking > Bridge Domains > inb > subnets and click on the subnet that you defined.
8. In the work pane, ensure that there is a check in the Advertised Externally check box.
9. Click the parent bridge domain object called "inb," then in the work pane click on the Policy tab > Layer 3 Configurations tab and click the + symbol next to Associated L3Outs.
a. Choose the L3Out created in the previous step from the drop-down list.
b. Click Update.
10. Still under the mgmt tenant, navigate to Contracts and expand the folder.
11. Right-click Standard to create a new standard contract.
12. In the dialog, name the contract.
a. Use a name that is clear in terms of the flow. For example: ND-to-inb.
b. Click the + to create a subject.
i. In the new dialog, name the subject.
ii. Click the + to create a new filter.
iii. Expand the drop-down list under Name and click the + to create a new filter.
iv. In the new dialog, name the filter.
v. Click the + under Entries.
vi. Name the entry.
vii. In the EtherType drop-down list, choose a type. To allow all communications, leave the value as Unspecified.
viii. Choose the IP protocol.
ix. Enter the destination port.
x. Click Update.
xi. Click Submit in the Create Filter dialog. The new filter should be selected under the Create Contract Subject.
c. Click Update.
d. Click OK to complete the subject.
e. The subject should show up under the Subjects section of the Create Contract dialog.
f. Click Submit.
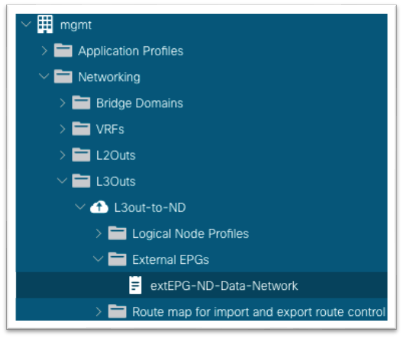
13. Still in the mgmt tenant, navigate to Networking > L3Outs > your-L3Out > External EPGs and select the external EPG.
14. In the work pane, click on the Contracts tab, click the Action button, and choose Add Consumed Contract.
a. Choose Submit.
15. Still in the mgmt tenant, navigate to Node Management EPGs and choose the in-band EPG.
16. Under Provided Contracts, click the + and in the Name drop-down list, choose the contract that you created.
17. Click Update.
This completes the connectivity section for Cisco Nexus Dashboard on any infra toward in-band management.
Network time protocol (NTP) is a core Cisco ACI service that should be enabled regardless of using Cisco Nexus Dashboard Insights or not. Having NTP enabled on the Cisco APIC and switches ensures consistency among log messages, faults, events, and internal atomic counters for debugging. This is required for Cisco Nexus Dashboard Insights to correlate information correctly and show meaningful anomalies and their relationships.
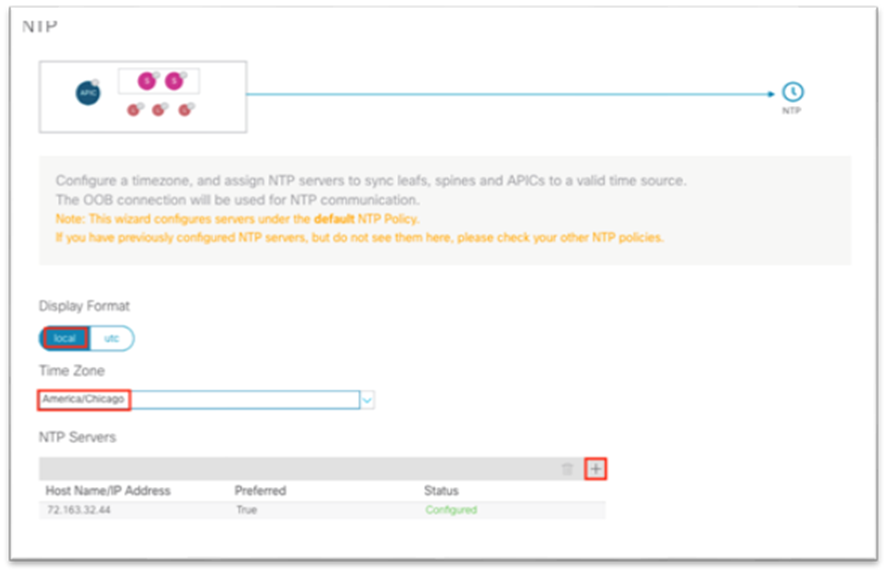
See the Cisco APIC Basic Configuration Guide, Release 5.2(x) - Provisioning Core Cisco ACI Fabric Services for the traditional steps to configure NTP by configuring the date/time policy under Fabric > Fabric Policies. The following procedure uses a new wizard to configure the same policy.
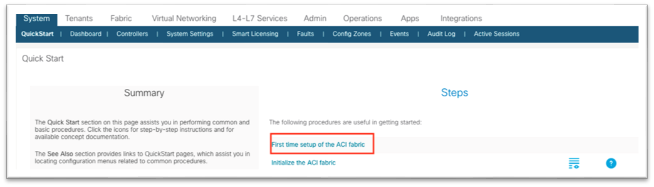
1. In the main menu, navigate to System > Quick Start and choose First time setup of the ACI Fabric.
2. In the dialog, under NTP, choose Edit Configuration or Review and Configure if it has not been set up previously.
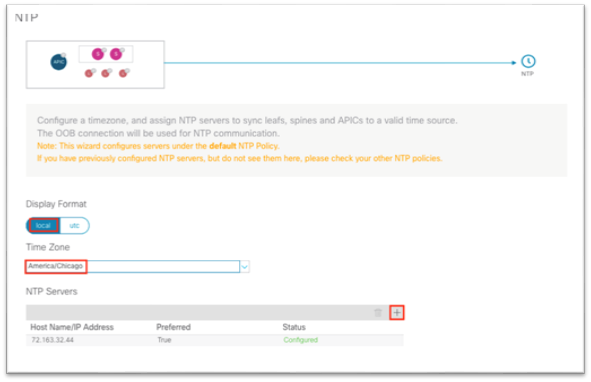
3. In the dialog:
a. Choose the display format preference for the Cisco APIC.
b. Choose the time zone for the Cisco APIC.
c. Under NTP Servers, click the + to add in the IP address or hostname of the NTP server to be used by this site.
d. Click Save and Continue.
4. Click Proceed to Summary and click Close.
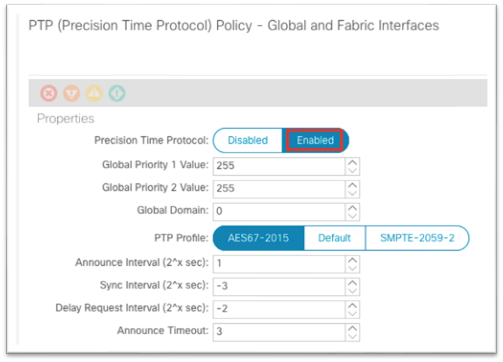
If the flow analytics in Cisco Nexus Dashboard Insights is enabled for a data center network site, and flow monitoring rules are provisioned, every Cisco Nexus 9000 series switch in the site will stream out the flow records for the monitored flows on a per second basis. A flow record has a rich set of meta data about the flow and a precision time protocol (PTP) time stamp. Upon receiving the streamed flow records from switches in the network, Cisco Nexus Dashboard Insights runs flow analytics and correlation functions to stitch the flow data from individual switches together to form end-to-end flows. For each of the flows, Cisco Nexus Dashboard Insights uses the PTP time stamps to calculate end-to-end flow latency.
For the flow latency calculation to function correctly, the network switches need to have PTP enabled and configured correctly. They need to use the same PTP grandmaster.
For more information, see the Cisco APIC System Management Configuration Guide, Release 5.1(x) - Precision Time Protocol.
For a Cisco ACI fabric with only a single pod, PTP can be enabled without the need for an external grandmaster. The fabric will elect a single spine switch to act as a grandmaster and all other switches will synchronize to this grandmaster. Cisco ACI Multi-Pod fabrics require an external grandmaster, and we recommend that you have them connected to the external IPN device. This ensures an equal number of hops to reach the active grandmaster. You can connect the grandmaster on a leaf switch port as well using an EPG or L3Out, which then can be used as grandmaster candidates in case the active grandmaster goes down.
Single Pod Grandmaster Configuration:
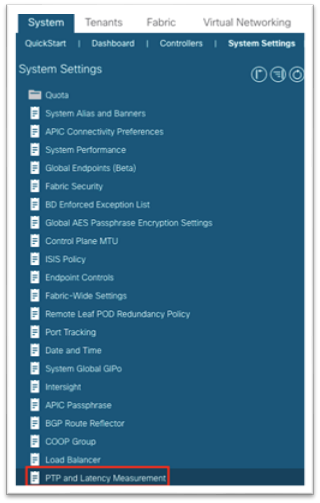
1. In the main menu, navigate to System > System Settings > PTP and Latency (previously known as the Precision Time Protocol setting).
2. In the work pane, for Precision Time Protocol, choose Enabled.
3. At the bottom, click Submit.
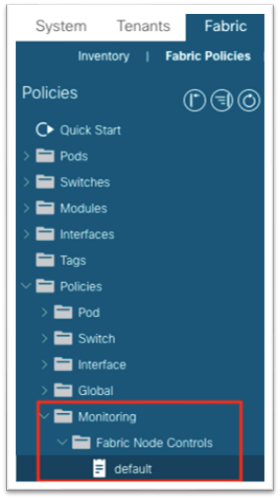
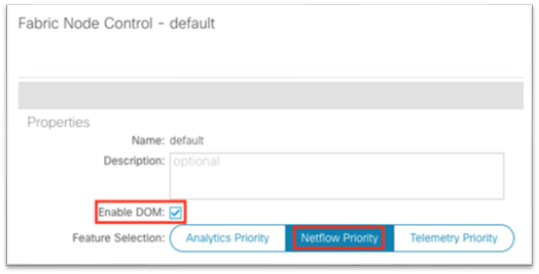
Monitoring Policy (Fabric Node Control Policy)
The fabric node control policy is used to enable digital optical monitoring (DOM) and concurrently to select a feature selection priority.
The Feature Selection has three priorities, which are mutually exclusive:
● Choose Analytics Priority for integration of the Cisco ACI fabric with Cisco Secure Workload (Tetration). The Cisco Secure Workload is not compatible with Nexus Dashboard flow analytics (Traffic Analytics and Flow Telemetry).
● Choose Netflow Priority when Cisco Nexus Dashboard Insights Traffic Analytics is enabled and concurrently other Netflow collectors are configured on the Cisco ACI fabric.
● Choose Telemetry Priority when the Flow Telemetry or Traffic Analytics is enabled in Cisco Nexus Dashboard Insights. This mode does not support using additional Netflow collectors with ACI.
If the Traffic Analytics feature is enabled for the fabric in Nexus Dashboard but no other Netflow collectors are configured in the fabric, then you can choose both Netflow Priority and Telemetry Priority.
To apply the policy, configure fabric-level switch selectors for leaf and spine switches and choose a policy group to reference this fabric node control policy. For information about the monitoring policy, see the Cisco APIC Troubleshooting Guide, Release 4.2(x) - DOM.
1. Navigate to Fabric > Fabric Policies > Policies > Monitoring > Fabric Node Controls > default.
2. In the work pane, put a check in the Enable DOM check box.
3. For Feature Selection, choose Telemetry Priority.
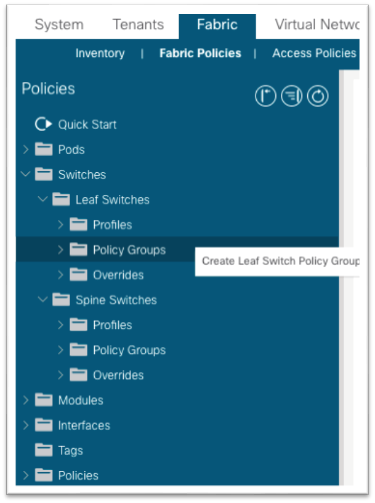
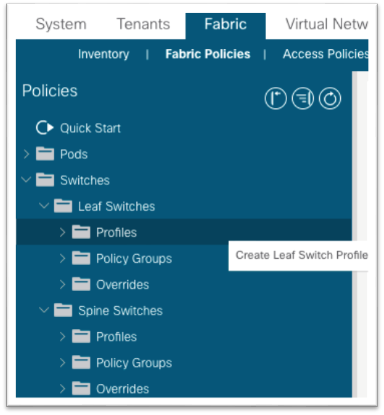
After you complete the above steps, you must apply the policy through the familiar profile, selectors, and policy group associations, except this time, apply the policy for leaf switches and spines switches instead of for interfaces. Begin by creating a leaf policy group:
1. Navigate to Fabric > Fabric Policies > Switches > Leaf Switches > Policy Groups.
2. Right-click Policy Groups and choose Create Leaf Switch Policy Group.
3. In the dialog, name the policy group.
a. For node control policy, if you created a custom policy earlier, choose that policy here and click Submit.
b. Otherwise, the default will be used when nothing is selected. You can click Submit with a blank policy group.
4. Next, create a profile under Fabric > Fabric Policies > Switches > Leaf Switches > Profiles.
5. In the dialog, give the profile a name.
a. For Switch Associations, click the + symbol to add a row.
i. Give the switch association a name.
ii. Choose the switches in the Blocks section using the drop-down list and put a check in the check box to choose all leaf switches.
iii. In the Policy Group drop-down list, choose the policy group that has DOM and Telemetry enabled.
iv. Click Submit.
The policy group has now been applied to all leaf switches. The steps should be repeated for all spine switches. This includes creating the policy group and referencing the node control policy, creating a spine switch profile, and associating the policy group to the block of spine switches.
1. Navigate to Fabric > Fabric Policies > Policies > Monitoring > Fabric Node Controls > default.
2. In the work pane, put a check in the Enable DOM check box.
3. For Feature Selection, choose Netflow Priority.
After you complete the above steps, must apply the policy through the familiar profile, selectors, and policy group associations, except this time, apply the policy for leaf switches and spines switches instead of for interfaces. Begin by creating a leaf policy group:
4. Navigate to Fabric > Fabric Policies > Switches > Leaf Switches > Policy Groups.
5. Right-click Policy Groups and choose Create Leaf Switch Policy Group.
6. In the dialog, name the policy group.
a. For node control policy, if you created a custom policy earlier, choose that policy here and click Submit.
b. Otherwise, the default will be used when nothing is selected. You can click Submit with a blank policy group.
7. Next, create a profile under Fabric > Fabric Policies > Switches > Leaf Switches > Profiles.
8. In the dialog, give the profile a name.
a. For Switch Associations, click the + symbol to add a row.
i. Give the switch association a name.
ii. Choose the switches in the Blocks section using the drop-down list and put a check in the check box to choose all leaf switches.
iii. In the Policy Group drop-down list, choose the policy group that has DOM and Telemetry enabled.
iv. Click Submit.
The policy group has now been applied to all leaf switches. The steps should be repeated for all spine switches. This includes creating the policy group and referencing the node control policy, creating a spine switch profile, and associating the policy group to the block of spine switches.
Cisco Nexus Dashboard Configuration
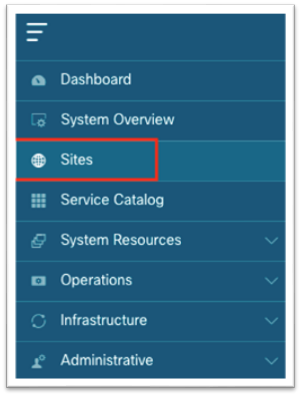
Adding a Cisco ACI Site to Cisco Nexus Dashboard
This operation is conducted in Cisco Nexus Dashboard by selecting the Sites option in the menu bar. You must enter the name of the node management in-band EPG that you configured previously when adding the site into Cisco Nexus Dashboard.
For more information about Cisco Nexus Dashboard and Cisco Nexus Dashboard Insights, see the Cisco Nexus Dashboard Deployment Guide - Fabric Connectivity and Cisco Nexus Dashboard Insights User Guide - Installation and Setup.
1. Using a browser, open a session to the Cisco Nexus Dashboard GUI.
2. In the left-hand menu, choose Sites.
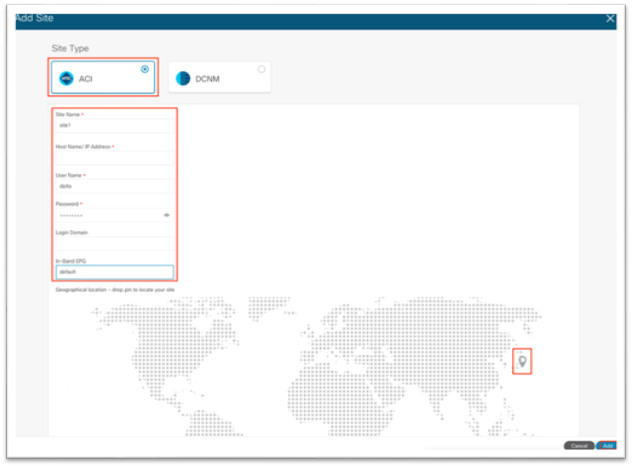
3. In the work pane, choose Actions > Add Site.
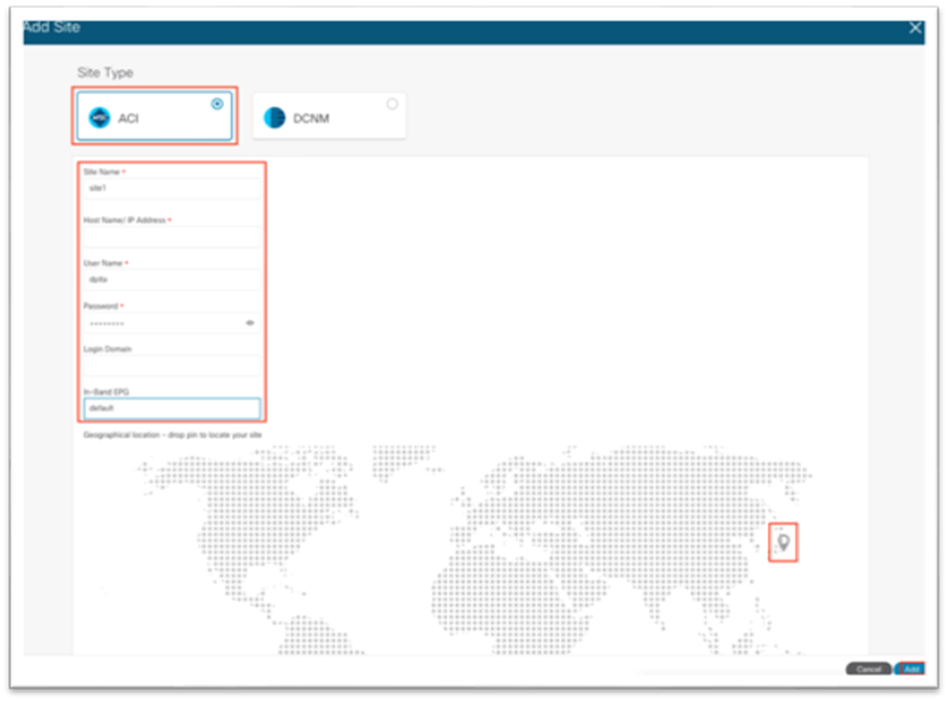
4. In the new screen, ensure Cisco ACI is selected as the site type.
a. Fill in the name for this site. This name will carry over to all other Services, such as Cisco Nexus Dashboard Orchestrator or Cisco Nexus Insights.
b. Enter the in-band IP address of the Cisco APIC.
c. Enter a username for authentication to the Cisco APIC.
d. Enter the password for the specified username. This password is only used once for the initial connection. Afterward, a certificate-based authentication is used between Cisco APIC and Cisco Nexus Dashboard for all subsequent operations.
e. Specify the login domain for username.
f. Enter the node management in-band EPG name.
g. Drop the pin on the map.
h. Click Add at the bottom right corner.
(Optional) Configuring External Service Pools – Required for NetFlow
The external service pools are used to configure persistent IP addresses to be used for certain services. These persistent IP addresses are retained even if the backend service is relocated to a different Cisco Nexus Dashboard Node. For more information, see the Cisco Nexus Dashboard User Guide.
The external service pools are required for NetFlow and are used to when programing the flow exporter under the NetFlow monitoring policy.
Note: If Cisco Nexus Dashboard Insights is already running before the external service pools are created, Cisco Nexus Dashboard Insights must be disabled and re-enabled for the changes to take effect.

This section provides an overview of the steps to configure the external service pools in Cisco Nexus Dashboard. Detailed steps are provided later in this document.
1. Using a browser, open a session to the Cisco Nexus Dashboard GUI.
2. In the left-hand menu, Choose Infrastructure > Cluster Configuration.
3. Under the External Service Pool tile, click the pencil icon to edit the external serivce pools.

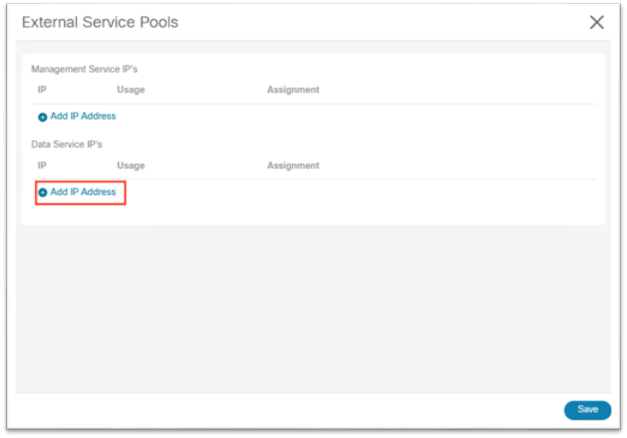
4. In the pop-up, under Data Serivce IP’s, click Add IP Address.
5. In the text box, input the IP address and click the green checkmark to save the entry.
6. Click Add IP Address once again and repeat the process until you have configured six data service IP addresses. These IP addresses will be randomly claimed by services.
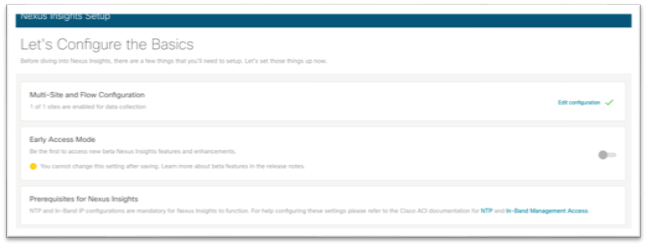
Cisco Nexus Dashboard Insights Setup
Cisco Nexus Dashboard Insights setup is used to enable sites that are registered on Cisco Nexus Dashboard.
Enable the following key features to receive the greatest benefit from Cisco Nexus Dashboard Insights:
● Software Analytics: Used to stream switch and Cisco APIC software analytics to Cisco Nexus Dashboard Insights for further processing, correlation, and anomaly detection. Set this to Enabled.
● Flow Analytics: Used to configure rules and have switches export flow metadata to Cisco Nexus Dashboard Insights. Set this to Enabled.
● Microburst Sensitivity: Based on a threshold percentage, this setting can be set to low, medium, or high.
With the Cisco Nexus Dashboard Insights 6.0 release, the following new features have been added:
● Multiple sites can now be grouped into a site group for a holistic view of related sites.
● Bug Scan can be enabled to run peridocially to check the fabric for known defects downloaded from the Cisco Cloud.
● Assurance Analysis: Used to take a detailed snapshot of the network fabric periodically including intent, policy, and hardware states. These snapshots can then be used for delta analysis, pre-change analysis, and to query the model using natural language queries in the Explore function.
● Alert rules can be configured to provide more granular control of anomalies, setting the initial state to acknowledge or to customize the recommendation.
● Compliance requirements can be enabled to provide communication or configuration checks on the snapshots to ensure business requirements and operational requirements are in compliance with known standards.
Configuration Steps for Cisco Nexus Dashboard Insights 6.x Site Group:
This section discusses the high level steps to enable a site in Cisco Nexus Dashboard Insights release 6.0. Detailed steps on creating a site group or adding a site into an existing site group are out of the scope of this document. For more information about setting up Cisco Nexus Dashboard Insights, see the Cisco Nexus Dashboard Insights 6.x ACI User Guide - Installation and Setup and if necessary, the Cisco Nexus Dashboard Insights 6.x Deployment Guide.
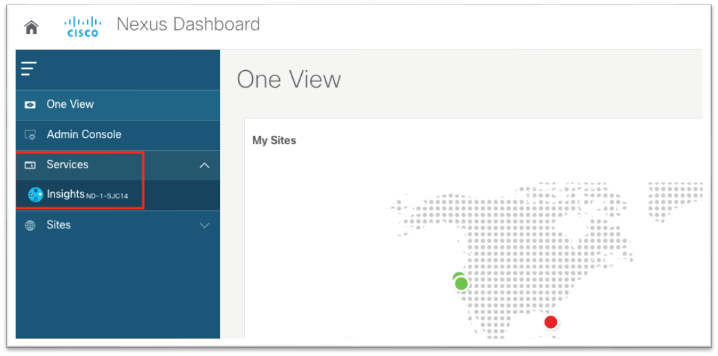
1. Using a browser, open a session to the Cisco Nexus Dashboard GUI.
2. In the left-hand menu, choose Services.
3. Choose Insights from the menu.
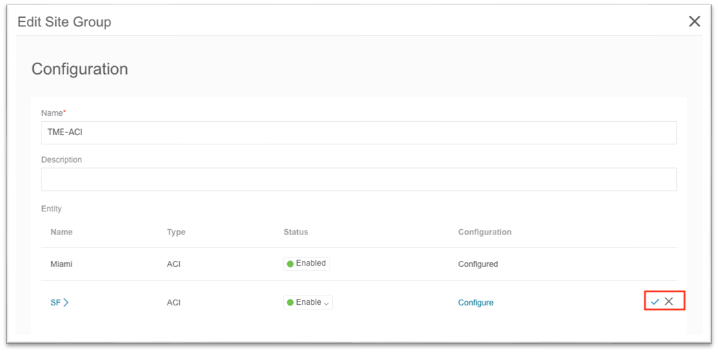
After the Cisco Nexus Dashboard Insights service launches, proceed to either create a new site group or configure a site group already in existence by editing the existing site group and adding a member. The following steps are equivalent for both new and existing site groups.
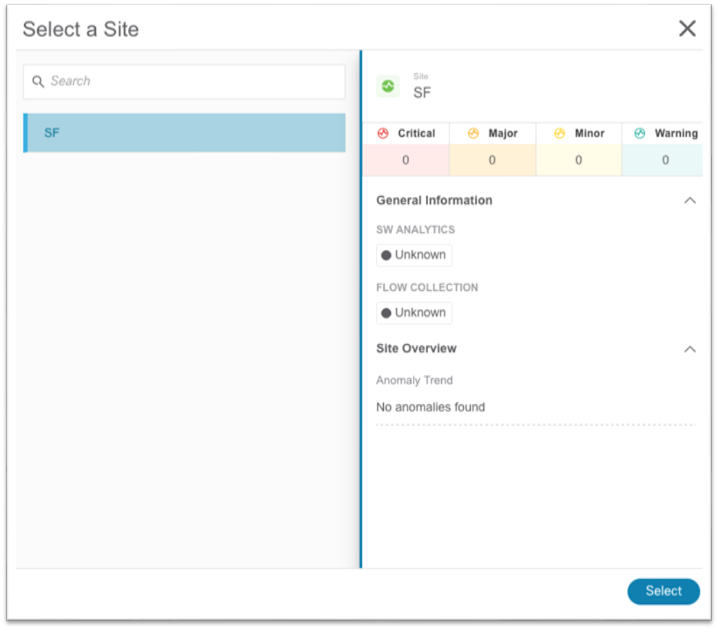
1. Select Member opens a pop-up that shows the available sites. Select an available site and click Select.
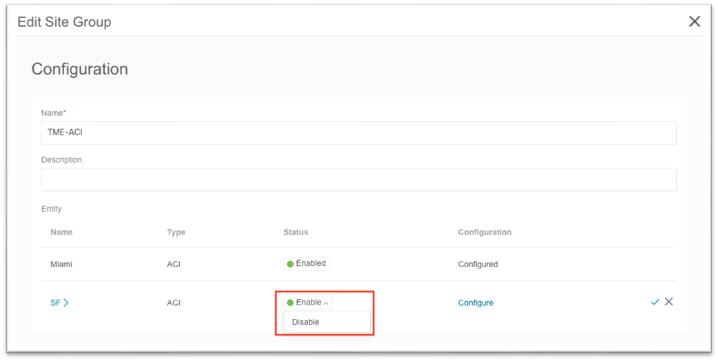
2. Set the Status to Enabled.

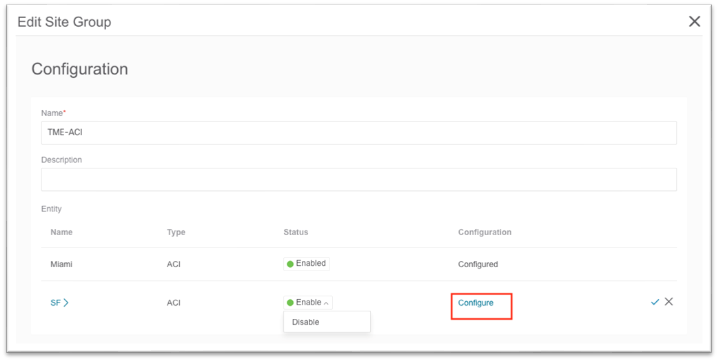
3. In the Configuration column, click Configure. This opens a new pop-up.
a. In this pop-up input the username and password that will be used for assurance analysis. These credentials should have admin-level privilege.
b. Click Save.
4. Click the checkmark to save.
5. Click Save at the bottom.
a. After the site is added successfully, the Collection Status column value changes from "Adding" to "Enabled."
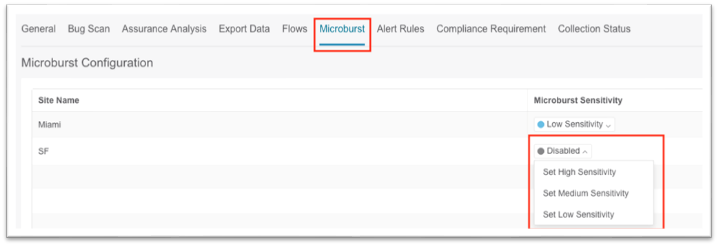
6. Click the Microbusrt tab along the top menu, then click the sensitivity drop-down list and choose the desired microburst sensitivity for the site.
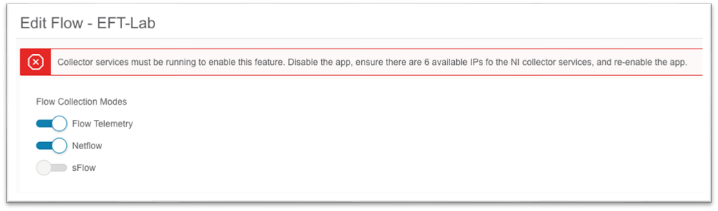
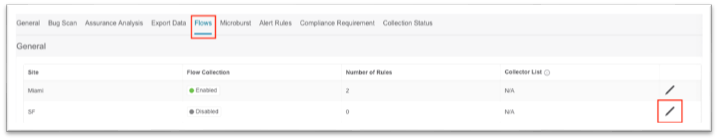
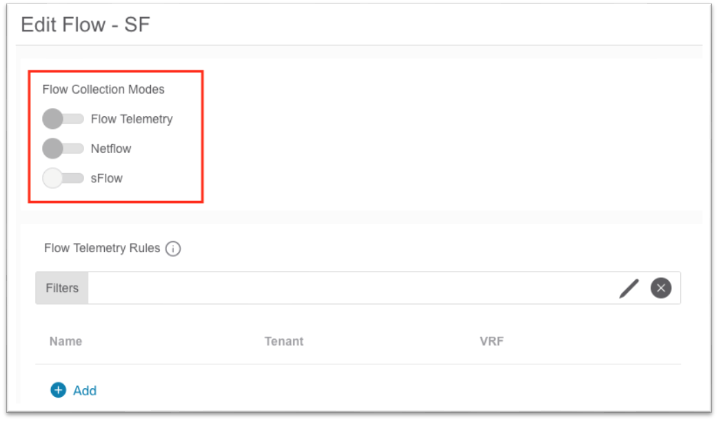
7. Click on the Flows tab in the top menu, then click on the pencil icon to edit the new site.
a. In the pop-up, choose the toggle for the desired flow collection mode.
b. Create flow telemetry rules, if needed.
c. Click Save at the bottom.
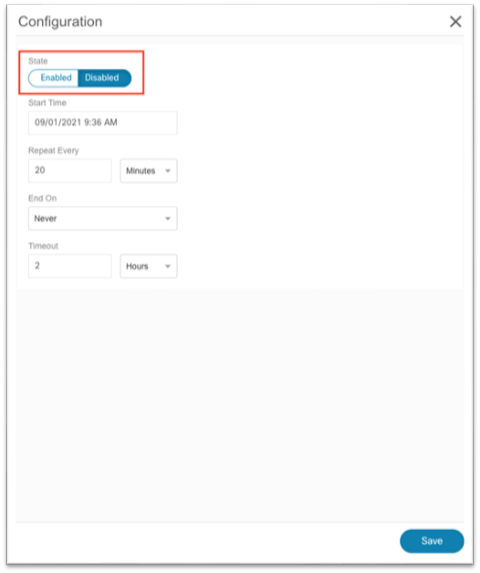
8. Click on the Assurance Analysis tab in the top menu, then click on the pencil icon to edit the new site.
a. In the pop-up, set the state to Enabled.
b. If necessary, choose a start time in the future in case another site is currently running an assurance analysis.
c. For repeat time, ensure enough time is allocated for a large fabric. See the User Guide for more information.
d. Click Save at the bottom.
9. Click the Bug Scan tab in the top menu, then click on the pencil icon to edit the new site.
a. In the pop-up, set the state to Enabled.
b. Click Save at the bottom.

10. After you have enabled all desired settings, click on the X in the blue title bar to return to the Site Group Overview page.

Configuration Steps for a Cisco Nexus Insights Release 5.x Site
For more information about setting up Cisco Nexus Dashboard Insights, see the Cisco Nexus Insights 5.x ACI User Guide - Installation and Setup.
1. Using a browser, open a session to the Cisco Nexus Dashboard GUI.
2. In the left-hand menu, choose Service Catalog.
3. Click Open for Cisco Nexus Insights.
This will open a new tab in your browser. If this is your first time setting up Cisco Nexus Insights, a setup wizard will appear.
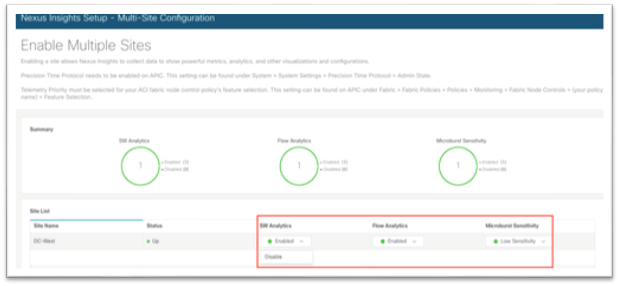
4. In the Multi-Site and Flow Configuration section, click Edit configuration.

5. Using the drop-down lists under the SW Analytics and Flow Analytics columns, choose Enabled where appropriate. Under the Microburst Sensitivity column, choose the desired sensitivity.

6. Click Done at the bottom right corner to exit the Enable Multiple Sites screen.
7. Click Done once more to exit the Insights Setup screen.
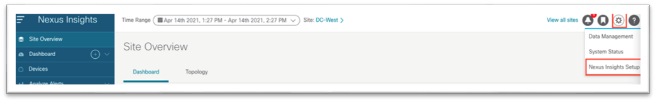
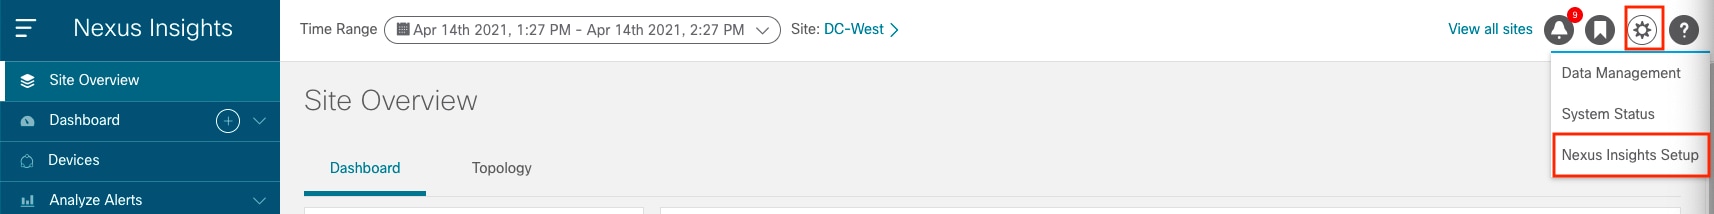
At this point, it will take about 5-15 minutes for data to start populating into the Cisco Nexus Dashboard Insights service before any information can be displayed. You can add any future sites into Cisco Nexus Dashboard as described in the previous chapter. In Cisco Nexus Insights, in the top right toolbar, you can also click the Gear/Settings icon and choose Nexus Insights Setup.
Cisco ACI NetFlow Configuration
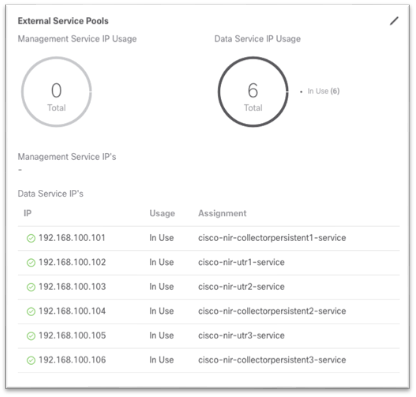
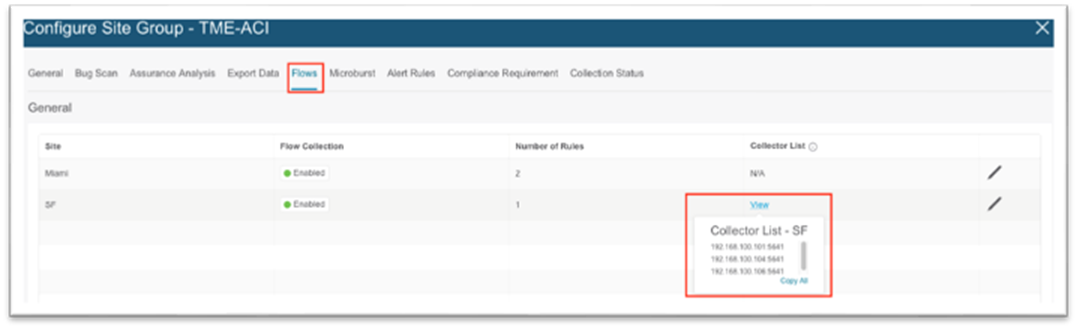
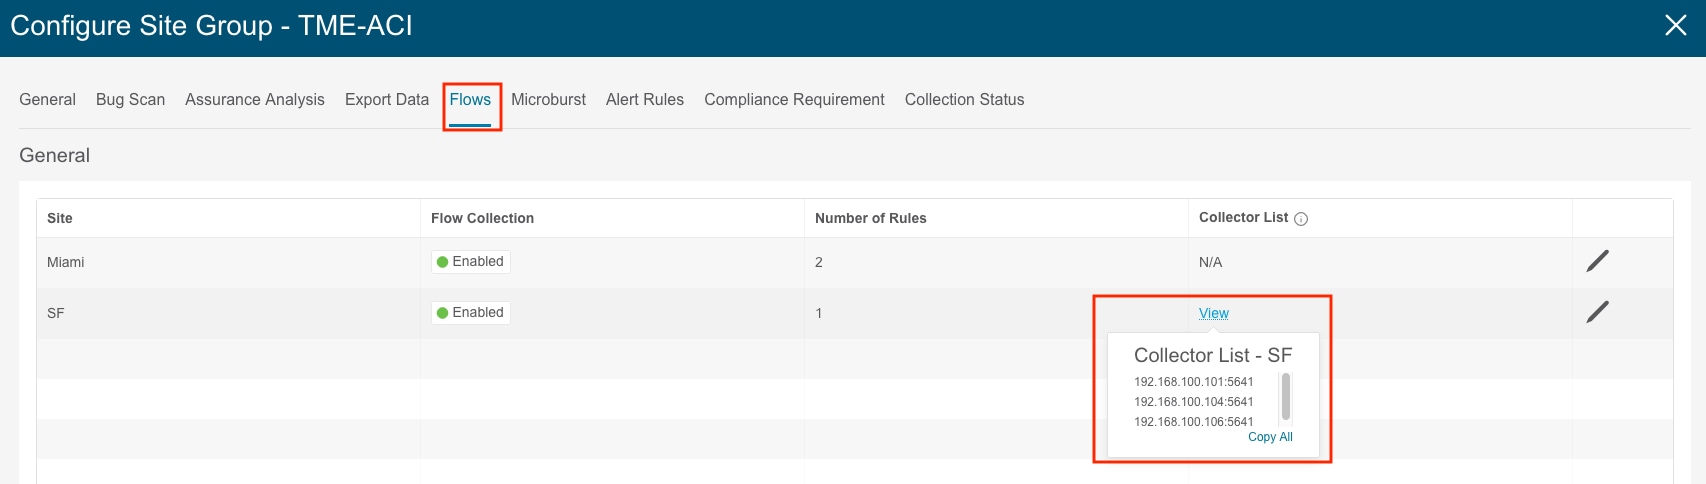
If NetFlow is required, ensure the Cisco Nexus Dashboard External Service Pools persistent IP addresses are assigned on the data network and ensure the site in the site group flow collection mode is set to NetFlow. If it is, the NetFlow Exporter IP addresses will be shown under the Collector List column as shown below:
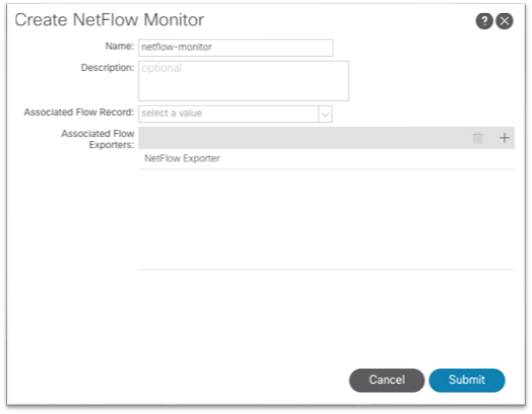
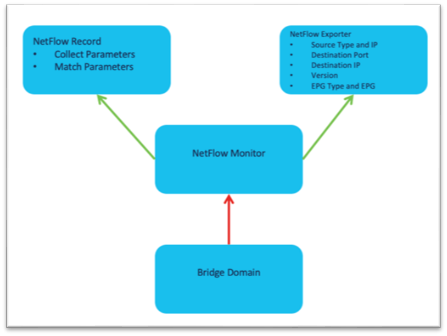
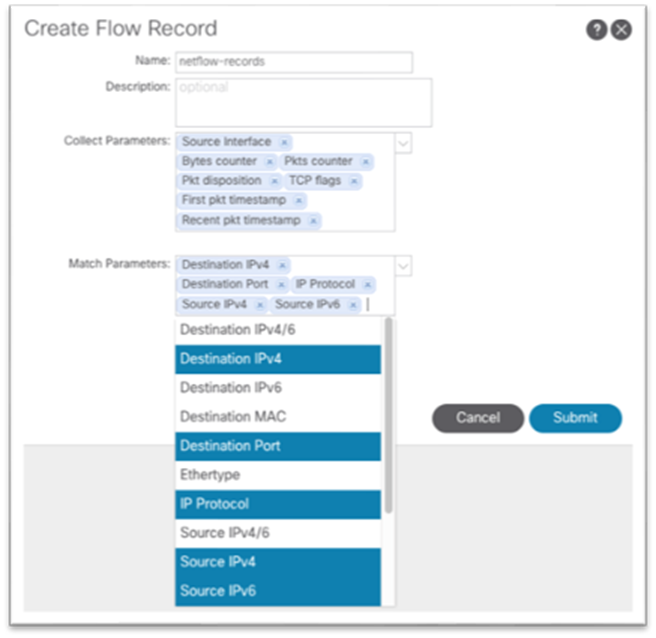
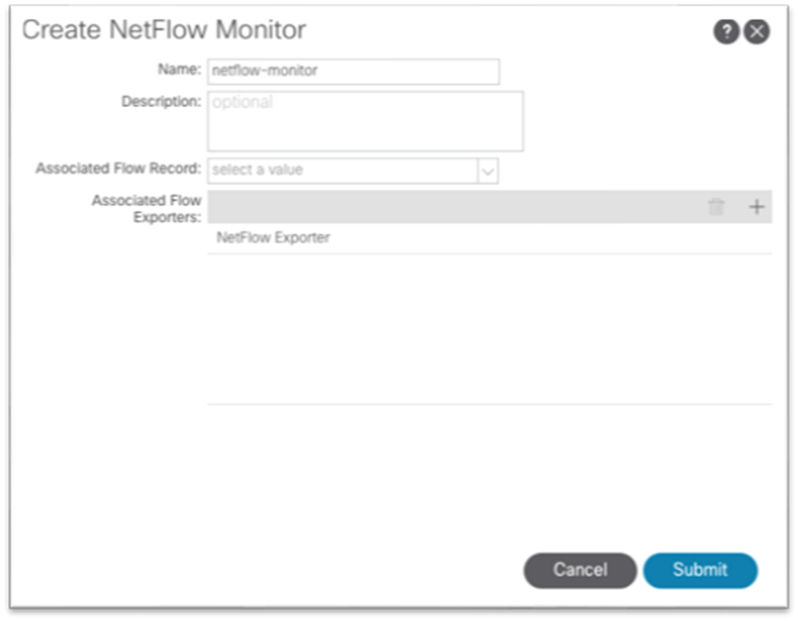
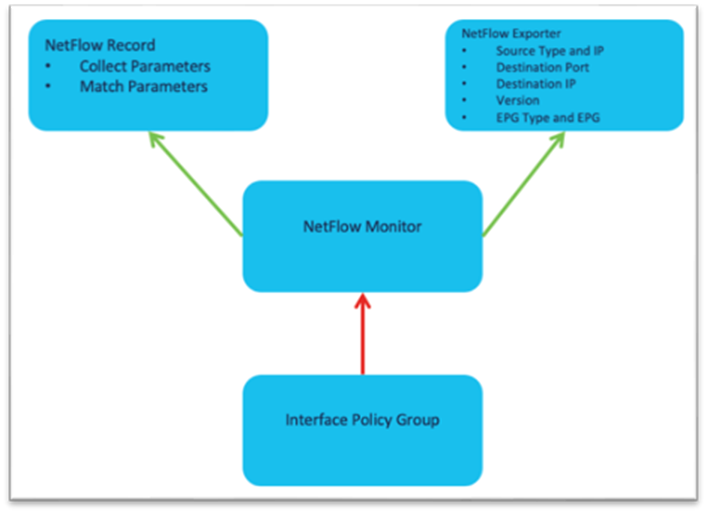
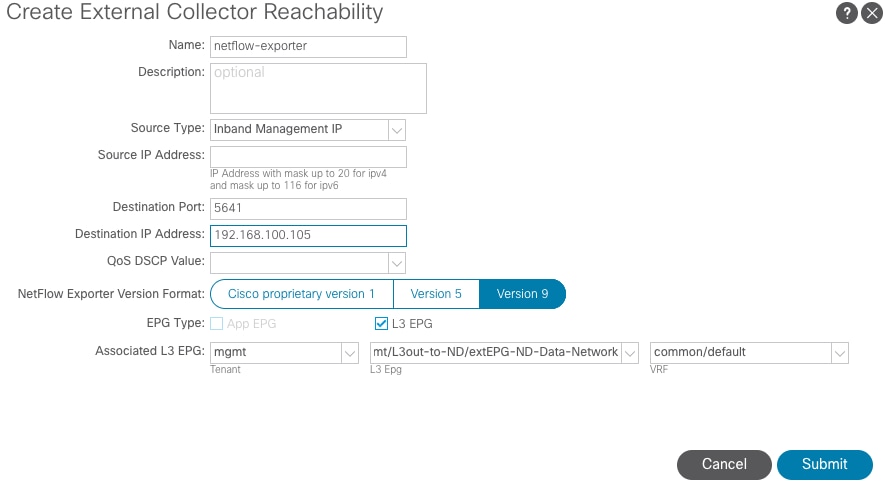
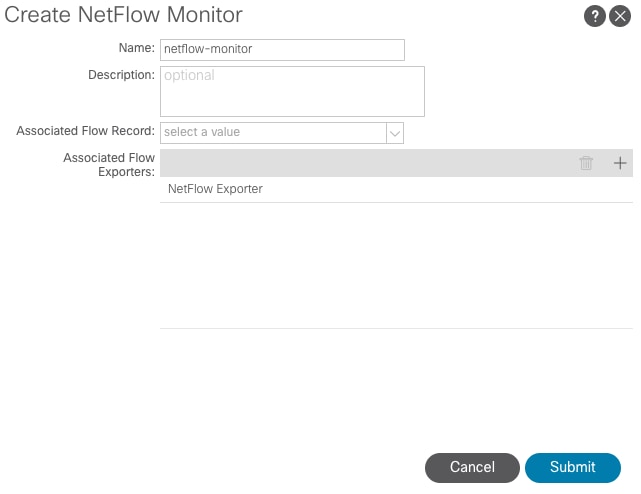
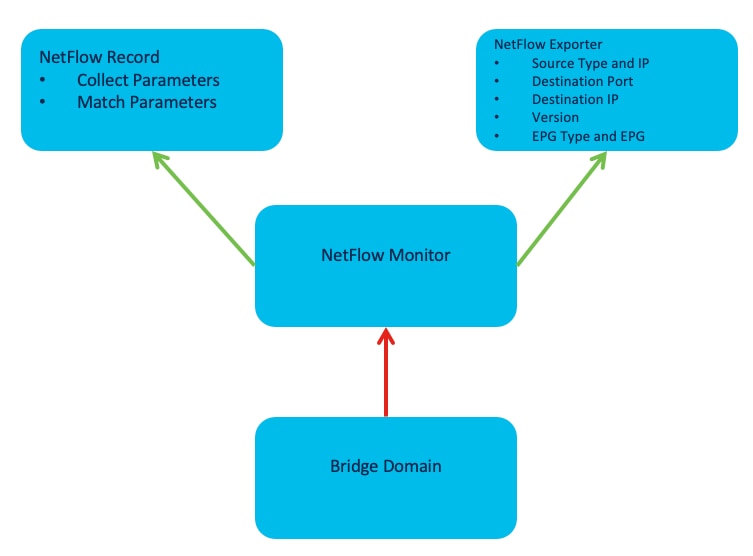
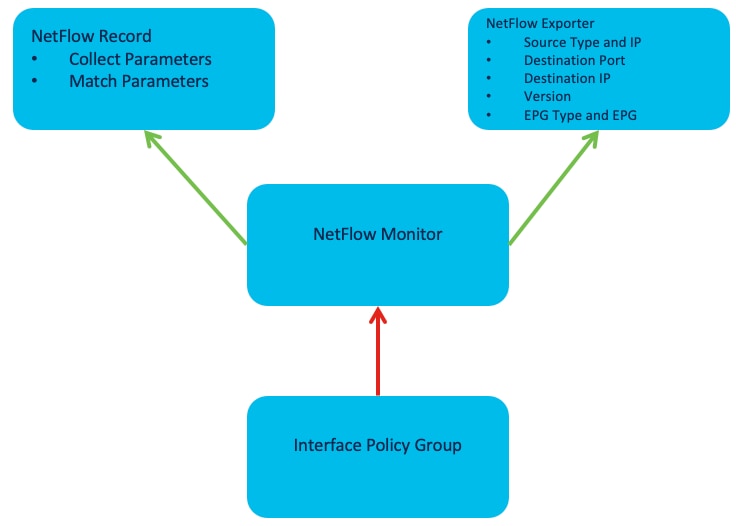
The high level workflow for NetFlow is consistent across tenant NetFlow and access policy NetFlow. The workflow consists of a NetFlow record policy that defines what to collect and matching what fields in the headers and a NetFlow Exporter that defines the source and destination IP address, NetFlow version, and EPG where the destination can be reached. Finally, the NetFlow record policy and NetFlow exporter is referenced by the NetFlow monitor policy, which is then applied to a bridge domain or interface policy group.
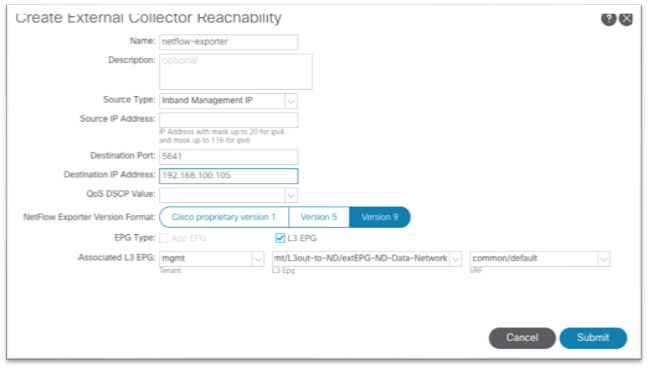
Specifically for Cisco Nexus Dashboard Insights, the destination port to be used in the NetFlow Exporter is 5641.
Specific configuration steps are out of the scope of this document. For more information on NetFlow and Cisco ACI, see the Cisco APIC and NetFlow technote.
Below are examples of each of the required policies:
Use the drop-down list to choose the necessary options. 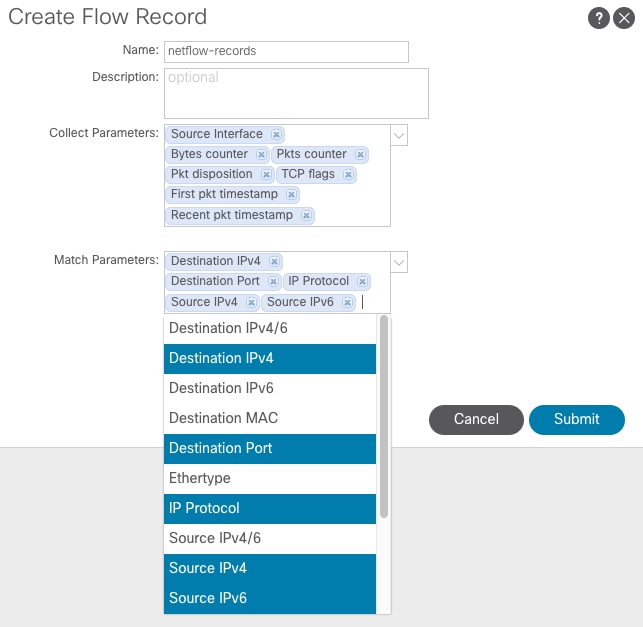
We recommend that you use Source Type = Inband Management IP. With this option, there is no need to input any IP address manually in the Source IP Address field. Ensure that destination port 5641 and Version 9 is used. Also, NetFlow in Cisco ACI requires that the exporter IP address be in a user VRF instance or common/default VRF instance. The L3out can be in the mgmt tenant.
You must create a minimum of 3 exporter policies that align with the 3 collector IPs in Nexus Dashboard Insights. The collector IP addresses should match the IP addresses entered in the destination IP part of the exporter policy.
The NetFlow monitor policy simply ties the record policy and monitoring policy together to be used by the desired object, such as a bridge domain or interface policy group.
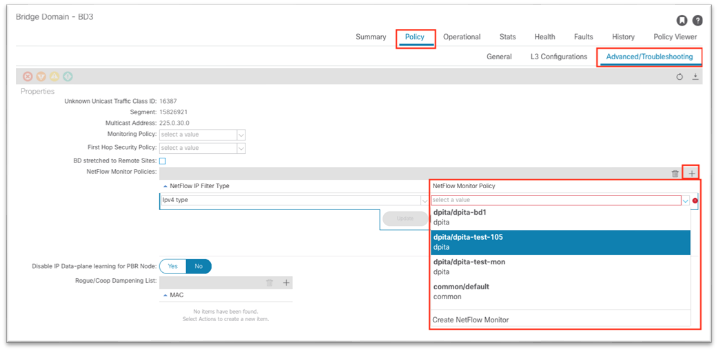
This configuration can be found under Tenant > Policies > NetFlow.
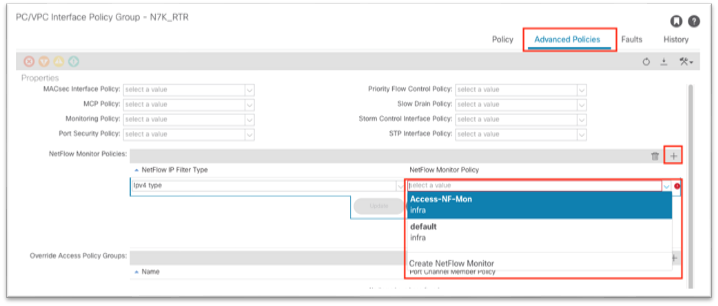
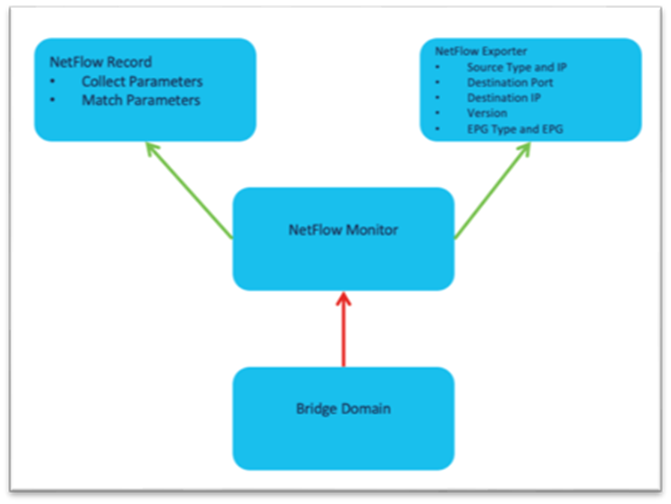
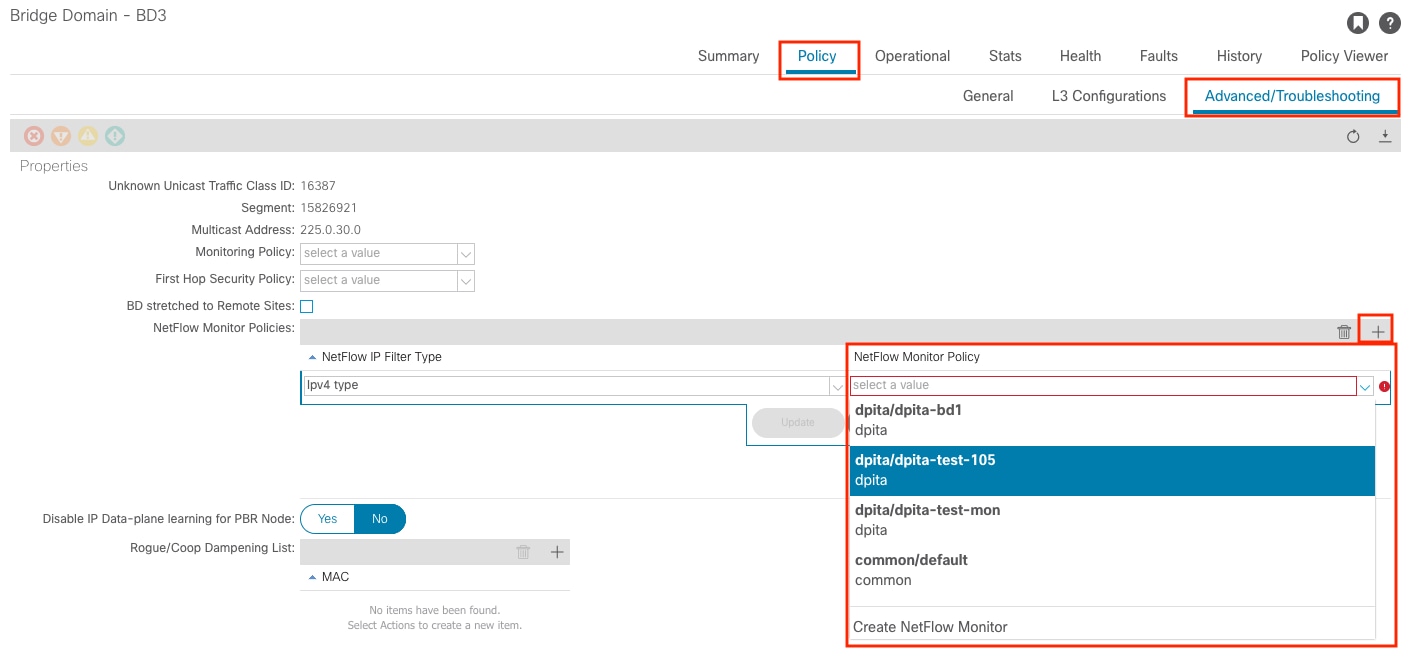
As shown, the NetFlow monitor is then attached to the bridge domain under Policy > Advanced/Troubleshooting.
The following screenshot shows how to apply a NetFlow monitor policy on an existing bridge domain in Cisco APIC release 5.2:
This configuration can be found under Fabric > Access Policies > Policies > Interface > NetFlow.
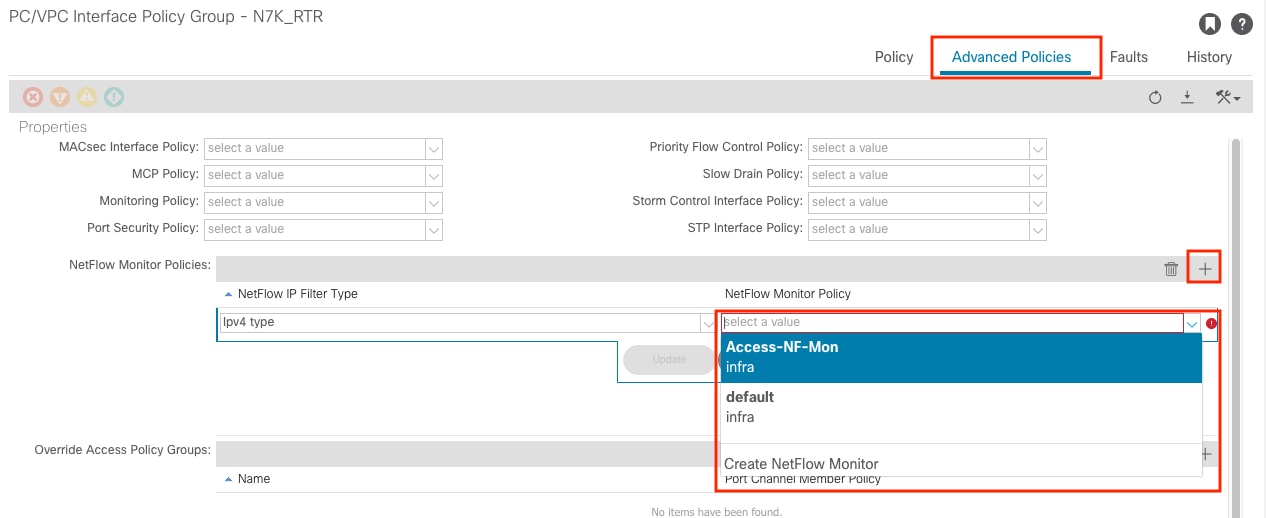
As shown, the NetFlow monitor is then attached to the interface policy group.
The following screenshot shows how to apply a NetFlow monitor policy on an existing vPC interface policy group in Cisco APIC release 5.2:
In-band Verification
As with any configuration in Cisco ACI, the first thing to do is check for faults. In this case, check the mgmt tenant or the system level for faults.
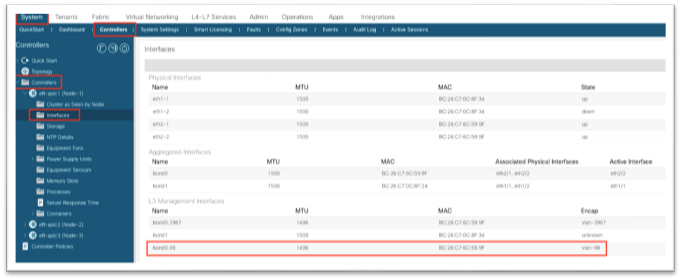
From the Cisco APIC GUI, navigate to System > Controllers > Controllers > Interfaces and ensure there is a new entry under L3 Management Interfaces. There should be a new bond0 with the VLAN configured in the VLAN pool and in the node management EPG.
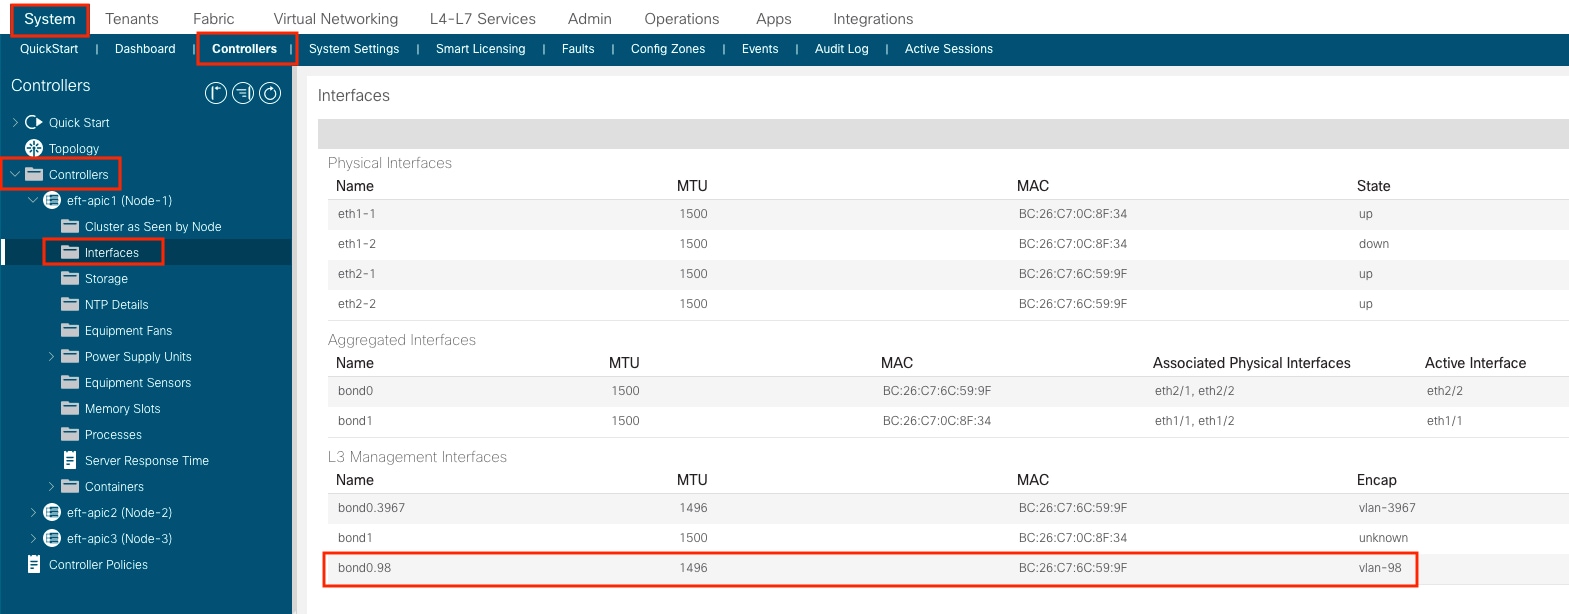
From the Cisco APIC CLI, run ifconfig bond0.98 and verify the IP address on the in-band interface:
From the Cisco APIC, you can run the show switch command to check in-band IP configuration quickly:
For connectivity, connect to a leaf switch either through the Cisco APIC or out-of-band management, run the show ip int brief vrf mgmt:inb command:
With that output, we can determine that VLAN14 on this leaf switch is the SVI for the in-band bridge domain. Running the show ip int VLAN14 command shows the gateway as secondary, and the primary is the static node address for the switch itself:
Finally, test connectivity with iping. Send a ping to the Cisco APIC in-band address:
Connectivity to Cisco Nexus Dashboard Data Interface Verification
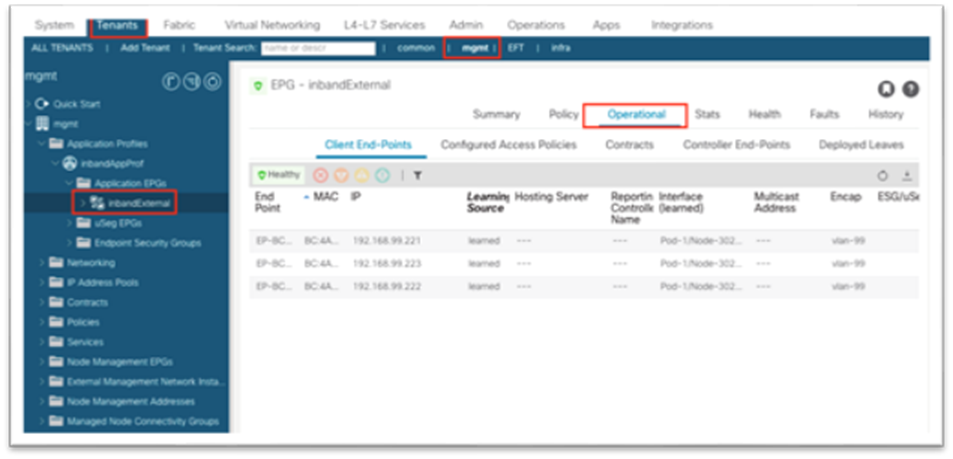
This test can be performed from the Cisco APIC or from the leaf switch. To start, looking at the EPG where Cisco Nexus Dashboard is configured is an easy way to confirm whether Cisco ACI has learned the Cisco Nexus Dashboard at all.
Navigate to Tenants > mgmt > Application Profiles > [name] > Application EPGs > [name] > Operational to view the endpoints.
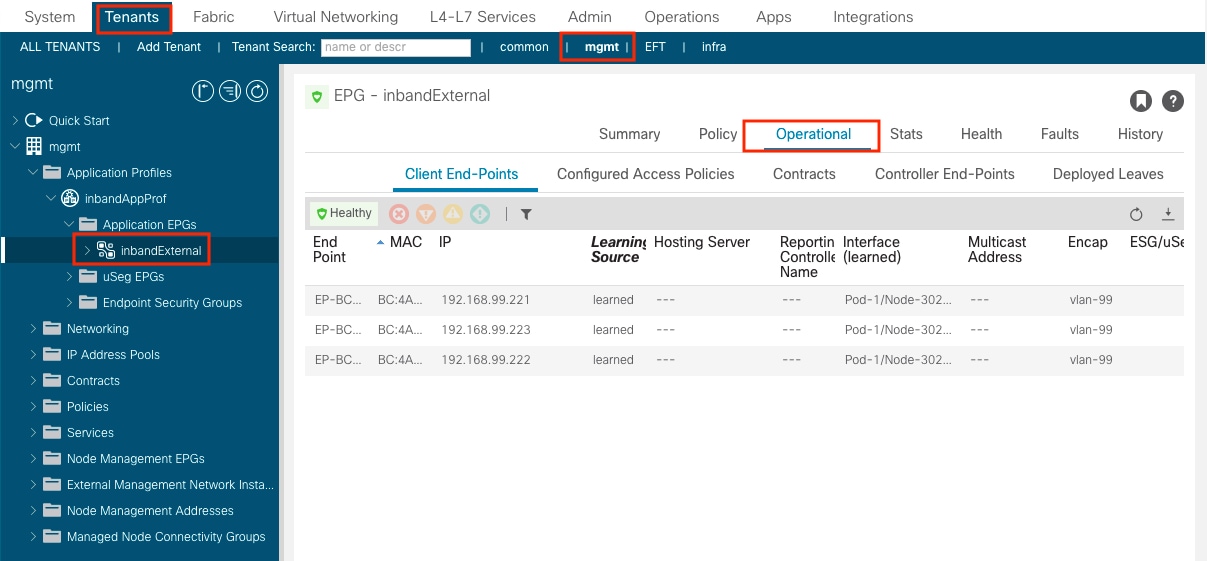
From the Cisco APIC CLI, issue a ping to each of the IP addresses listed.
If the ping fails, ensure there is a contract in place between the in-band EPG and the Cisco Nexus Dashboard EPG.
Network Time Protocol Verification
Cisco APIC Network Time Protocol Verification
From the NX-OS-style CLI, run the show ntp command to display the Cisco APICs' configuration and status:
Switch Network Time Protocol Verification
The standard NX-OS commands apply, as well as some Linux commands:
● show clock
● show ntp peers
● show ntp peer-status
● show ntp statistics peer ipaddr
● date
● cat /etc/timezone
Precision Time Protocol Verification
The standard NX-OS commands apply:
● show ptp parent
● show ptp counters all
● show ptp clock
With single-pod Cisco ACI, all switches should have the same parent clock:
Fabric Node Control Verification
The basic verification on the switch to ensure the node control policy was correctly applied is show analytics hw-profile, and it should output "Telemetry" as the feature priority:
After Cisco Nexus Dashboard Insights has been configured and enabled for the site, running show analytics exporter will show the data interface IP addresses of the Cisco Nexus Dashboard as export destinations:
The basic verification on the switch to ensure the flow exporters are configured correctly, flows are being collected in the cache, and if NetFlow packets is being generated and exported by the CPU:
· show flow exporter
· show flow monitor
· show flow cache
· tcpdump -i kpm_inb port 5641
F1-P1-Leaf-104# show flow exporter
Flow exporter dpita:dpita-flow-exp:
Destination: 192.168.100.104
VRF: common:default (1)
Destination UDP Port 5641
Source: 192.168.99.104
DSCP 44
Export Version 9
Sequence number 262
Data template timeout 0 seconds
Exporter Statistics
Number of Flow Records Exported 974
Number of Templates Exported 171
Number of Export Packets Sent 262
Number of Export Bytes Sent 56740
Number of Destination Unreachable Events 0
Number of No Buffer Events 0
Number of Packets Dropped (No Route to Host) 0
Number of Packets Dropped (other) 0
Number of Packets Dropped (Output Drops) 0
Time statistics were last cleared: Never
Flow exporter dpita:dpita-test-exp2:
Destination: 192.168.100.105
VRF: common:default (1)
Destination UDP Port 5641
Source: 192.168.99.104
DSCP 44
Export Version 9
Sequence number 262
Data template timeout 0 seconds
Exporter Statistics
Number of Flow Records Exported 974
Number of Templates Exported 171
Number of Export Packets Sent 262
Number of Export Bytes Sent 56740
Number of Destination Unreachable Events 0
Number of No Buffer Events 0
Number of Packets Dropped (No Route to Host) 0
Number of Packets Dropped (other) 0
Number of Packets Dropped (Output Drops) 0
Time statistics were last cleared: Never
Feature Prio: NetFlow
F1-P1-Leaf-104# show flow monitor
Flow Monitor default:
Use count: 0
Flow Record: default
Flow Monitor dpita:dpita-test-mon:
Use count: 1
Flow Record: dpita:dpita-test-record
Bucket Id: 1
Flow Exporter: dpita:dpita-flow-exp
Flow Monitor dpita:dpita-test-105:
Use count: 1
Flow Record: dpita:dpita-test-record
Bucket Id: 1
Flow Exporter: dpita:dpita-test-exp2
Feature Prio: NetFlow
F1-P1-Leaf-104# show flow cache
IPV4 Entries
SIP DIP BD ID S-Port D-Port Protocol Byte Count Packet Count TCP FLAGS if_id flowStart flowEnd
192.168.1.100 192.168.4.100 537 0 0 1 86814 63 0x0 0x16000000 1217618386 1217638714
F1-P1-Leaf-104# tcpdump -i kpm_inb port 5641
tcpdump: verbose output suppressed, use -v or -vv for full protocol decode
listening on kpm_inb, link-type EN10MB (Ethernet), capture size 262144 bytes
11:47:40.116456 IP 192.168.99.104.52255 > 192.168.100.104.5641: UDP, length 220
11:47:40.116588 IP 192.168.99.104.39779 > 192.168.100.106.5641: UDP, length 220