Cisco Nexus Dashboard Insights White Paper, Release 6.0.1
Available Languages
Bias-Free Language
The documentation set for this product strives to use bias-free language. For the purposes of this documentation set, bias-free is defined as language that does not imply discrimination based on age, disability, gender, racial identity, ethnic identity, sexual orientation, socioeconomic status, and intersectionality. Exceptions may be present in the documentation due to language that is hardcoded in the user interfaces of the product software, language used based on RFP documentation, or language that is used by a referenced third-party product. Learn more about how Cisco is using Inclusive Language.
- US/Canada 800-553-2447
- Worldwide Support Phone Numbers
- All Tools
 Feedback
 Feedback
Visibility, troubleshooting, root-cause analysis, and remediation of network issues are common challenges for day-to-day network operations. With the legacy networking operation tools, these tasks are manual, time consuming, and reactive. They require network operators to have years of experience, extensive domain expertise, and the ability to correlate different events in complex IT environments to prevent or fix issues while upholding the infrastructure uptime with minimum disruption.
Cisco Nexus Dashboard Insights, a modern networking operation service, aims to simplify and automate these operation tasks. By ingesting real-time streamed network telemetries from all devices, it provides pervasive infrastructure visibility. Starting with its 6.0 release, Nexus Dashboard Insights incorporates the Cisco Network Assurance Engine (NAE) application as a part of the integrated services. With its powerful assurance and analytics engines, it can continuously verify and validate the operational states of the network while proactively detecting any drifts from the operators’ intent, detect different types of anomalies throughout the network, root cause the anomalies, and identify remediation methods. It is a tool to modernize the operation of networks, helping the network team to reduce troubleshooting efforts, increase operation efficiency, and proactively prevent network outages.
Note: The documentation set for this product strives to use bias-free language. For the purposes of this documentation set, bias-free is defined as language that does not imply discrimination based on age, disability, gender, racial identity, ethnic identity, sexual orientation, socioeconomic status, and intersectionality. Exceptions may be present in the documentation due to language that is hardcoded in the user interfaces of the product software, language used based on RFP documentation, or language that is used by a referenced third-party product.
Modern data centers are managed through controllers such as Cisco ACI™ or Cisco DCNM which capture the intents of network to deliver an automated, consistent policy framework across the data center. The same intent-based policies can be extended to multiple data center sites, branches, and the public cloud, to provide centralized control. Cisco Nexus Dashboard Insights helps with Day 2 Operations of these network sites to provide visibility, assurance, proactive detection of anomalies with correlated network, and application view. This helps identify issues, accelerate troubleshooting, thereafter remediating issues on these sites. Cisco Nexus Dashboard Insights was designed with the following network characteristics and architecture in mind.
Inbuilt automation: The network configuration is centrally managed by a controller, therefore the network operators no longer need to manage the device configuration on a box-by-box basis. With the centralized controller method, it is easier to maintain features and configuration consistency across the network.
Scalable architecture: Driven by different reasons, such as scale, disaster avoidance or disaster recovery, modern data centers often expand beyond a single site to multiple geographically dispersed locations, sometimes even to the public cloud. As data centers scale out, the complexity of collecting and analyzing data to understand the operational state of the networks increases. At the same time, with the increasingly distributed application workload, a data center infrastructure can be running anywhere between a few thousands to a few million flows at a time. In addition, at times there may be a few hundred messages or events being logged every second. Manually correlating these flows, logs, switch by switch in order to troubleshoot issues can be very challenging and time consuming.
Operations Challenges: The challenge faced by operators is to comprehend and correlate the data collected from each switch in the fabric to a particular problem, such as slowness in a web application. This implies a stringent expectation that an operator has the required knowledge and expertise (which usually takes time to build) about most if not everything happening in the infrastructure.
Cisco Nexus Dashboard Insights addresses these challenges to bring about the following benefits:
● Increase operational efficiency and network availability with proactive monitoring and alerts: Cisco Nexus Dashboard Insights learns and analyzes the network behaviors to recognize anomalies before the end users do, then generates proactive alerts useful in preventing outages. Cisco Nexus Dashboard Insights also proactively identifies vulnerability exposure of the networks to known defaults, PSIRTs or field notices and recommends the best course for proactive remediation.
● Shorten the mean time to resolution(MTTR) for troubleshooting: Cisco Nexus Dashboard Insights minimizes critical troubleshooting time through automated root-cause analysis of data-plane anomalies, such as packet drops, latency, workload movements, routing issues, ACL drops, etc. Additionally, Cisco Nexus Dashboard Insights provides assisted auditing and compliance checks using searchable historical data presented in time-series format.
● Increase speed and agility for capacity planning: Cisco Nexus Dashboard Insights detects and highlights components exceeding capacity thresholds through fabric-wide visibility of resource utilization and historical trends. The captured resource utilization shows time-series-based trends of capacity utilization so that the network operation team can plan for resizing, restructuring, and repurposing.
● Increase efficiency and reduce risks in network operations such as configuration change management or software upgrade. Starting with the 6.0 Release, Nexus Dashboard Insights provides a dry-run place for network operators to test and validate their intended configuration changes against a snapshot of the actual network, understanding the impacts of the changes to the network, having the opportunity to catch and correct any errors in the changes before entering them into the production network. It minimizes the risk of the network configuration changes.
Cisco Nexus Dashboard Insights Overview
Cisco Nexus Dashboard Insights is a micro-services-based modern service for network operations. It is hosted on Cisco Nexus Dashboard where Cisco ACI and Cisco DCNM sites are onboarded and respective data from these sites is ingested and correlated by Cisco Nexus Dashboard Insights.
Cisco Nexus Dashboard Insights directs operators' attention to the significant matters that are relevant to the task at hand, such as troubleshooting, monitoring, auditing, planning, vulnerabilities, etc. All anomalies and analytics results in Cisco Nexus Dashboard Insights can be accessed by an external system via its REST-APIs, or exported using Kafka where the users can subscribe to relevant topics. Users can also choose to receive email notifications on anomalies with the option to customize which anomaly types they want to see along with severity and cadence.
While network monitoring, analytics and assurance are the core functions of Nexus Dashboard Insights, it offers many other capabilities and tools to increase the efficiency of network operations and to reduce the risks in network operations. Below captures the key componets of the Nexus Dashboard Insights.
Network Telemetry Based Full Visibility and Analytics
Nexus Dashboard Insights receives the network telemetry data from the network devices. It obtains the fine-grained visibility through the telemetry data, including both the control plane and the data plane operations and performance. It analyzes and learns about the baseline behavior of the network and detects anomalies in the network. The anomalies are reported to the network operations team through the Insights UI or email notification, and can be sent to other tools via programatic methods, such as Kafka export or direct API calls.
Snapshot-Based Network Assurance Through Mathematical Modeling
In its 6.0 release, Nexus Dashboard Insights inherited the assurance analysis engine from the original Network Assurance Engine (NAE) application. The assurance engine continuously takes full snapshots of the network on a regular interval, builds a mathematical model for each snaphot that represents the network and how it operates at the point of time. It then analyizes the network behaviors against this model. It checks the network configuration for any errors, examines the consistency between the network configuration and its actual operational states. Any configuration issues, any inconsistencies between the configuration and the operational states, or any incorrect behaviors of the network components will be reported as network anomalies. It assures the network configuration, the policy space, connectivity as well as the endpoint space. The assurance functions are a comprehensive collection of automated troubleshooting processes, developed based on the deep knowledge base that is acculmulated through years of network design, deployment, and support experiences.
Centralized Network Insights with One View
Organizations scale out their data centers by deploying multiple data center sites that often are geographically dispersed. This creates a fragmented view of the network infrastructure that creates challenges for Day-2 operations teams leading to slower incident detection, correlation, and resolution. Starting with Nexus Dashboard 2.1 release, users can link their multiple Nexus Dashboard clusters together to operate their network sites from this one central point and obtain an aggregated view of the operations of all their network sites. Enabled by the “One View” capability on Nexus Dashboard, the Insights service itself can now provide its users with the centralized visibility across all the network sites on the linked Nexus Dashboards and enable the smooth navigation among the different sites on the same Insights UI.
Pre-Change Analysis for Risk-Free Configuration Change Management
Network Configuration Change management has been considered as an operation with risks by nature because the network team did not have a good tool to fully qualify the changes before implementing the changes into the product network. Pre-Change Analysis is a function originally offered by Cisco Network Assurance Engine (NAE) to tackle this challenge by giving the network team a tool to fully test drive their intended configuration changes. Cisco NAE is integrated into Cisco Nexus Dashboard Insights Release 6.0. Now the Insights users can take full advantage of the same pre-change verification capability to proactively validate the configuration changes against the latest snapshot of the network. This is a long-desired capability by the network operations team. Now, they can simply submit their intended changes to the Insights service. The Insights service will analyze the impacts of the changes to the network, calling out any errors or potential issues if there are any. The network team gets an opportunity to review and correct the errors and only implement the fully qualified configuration changes to the network. This pre-change analysis function removes the guess work from network configuration change management, minimizes the risks of the change management and therefore increases the availability of the entire network.
Automated Continuous Compliance Assurance
Most organizations have some types of compliance requirements for their networks. It can be industry regulatory compliance requirements, or the organizations’ internal requirements for security or business functions. Additionally, the network teams often have their own established best practices, standard configuration, or standardized naming conventions that they would like to implement or enforce during the ongoing network operation. All these requirements can be assured by Nexus Dashboard Insights through its compliance assurance functions. These capabilities are originally in the Cisco NAE application, and now become a part of the Insights service since its 6.0 release.
The compliance assurance functions in the Insights service gives the network team one more place to directly describe and submit their intents for the network, then automatically and continuously verifies and validates the intents in the network for them. Any deviation from the intents will be captured as compliance violation anomalies and reported to the network team immediately. With the automated, continuous security, and configuration compliance analysis, Nexus Dashboard Insights enables true intent-based network operation.
Query your Network Like a Database Using Natural Language
Explorer, originally from the Cisco NAE application, is now a part of Nexus Dashboard Insights since its 6.0 release. It is a tool for the network teams to conveniently explore the entire network like a database using natural-language-based queries. Explorer can answer questions such as “Can EPG A talk to EPG B?” “How can they talk?”, “What VRFs are deployed in my tenant space X?”, “What endpoints are attached to the leaf switch 101 port 1/1?”. It is a highly efficient way to find the objects and discover how the objects are associated with one another in the network.
Network operators can easily create natural language queries to get their discovery tasks done efficiently. For example, they can quickly locate a specific object, such as a particular endpoint out of thousands of them in the entire network , or just simply get a per-device or network-wide inventory of certain network object types in the network, or find out the communication relationship between different objects throughout the network that can either communicate or are isolated from each other using past or present snapshots of the network.
Explorer is an effective tool to assist in the troubleshooting of the network configuration, operational states, and network change planning, etc.
Network Software Upgrade Made Easy and Safer
Starting with its 6.0 release, Nexus Dashboard Insights offers software upgrade analysis to ease and reduce the risk of a software upgrade workflow. It can assist the network team to choose the right target software version for the upgrade. Based on the pre-upgrade analysis results, the network team can prepare for the upgrade by clearing up the identified issues or faults in the network if any, get a clear expectation of what issues will be solved by the update, and be aware if the target version would introduce any new caveats. The post-upgrade analysis shows the network team the differences in the network state (endpoints, routes, interface status, etc.) before and after the upgrade, so they can quickly tell if the network has come through the upgrade without any issues, or if something is missing. The pre and post upgrade analysis makes the software upgrade operation easier and safer.
Key Components of Cisco Nexus Dashboard Insights
The sections below introduce the key components of Cisco Nexus Dashboard Insights. These options (with sub categories) are available on the left panel of the service.
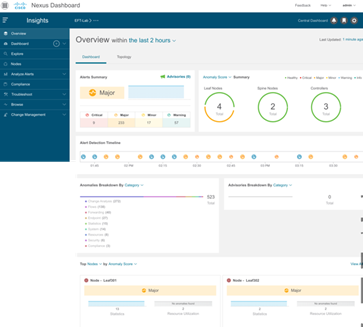
Cisco Nexus Dashboard Insights Site Overview
It provides a direct view into the site level anomalies (issues) that need attention, all of which are calculated by Cisco Nexus Dashboard Insights. The anomalies are consolidated into the Overview screen and sorted by category and severity. The Insights service further groups the anomalies by top nodes, timeline view, site health score, and advisories. Lastly a node inventory by roles, and corresponding health score, allows click access to the in-depth node-level visibility which gives all details on the nodes including trends of anomalies observed.
Cisco Nexus Dashboard Insights also allows users to create Custom Dashboards for any charts as seen in the service.
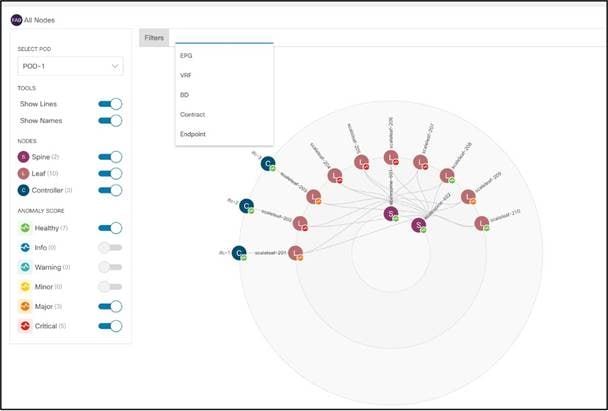
Interactive Network Topology Overlayed with Operational States
Provides a graphical representation of the fabric and how nodes are connected. Allows user to select filters based on switch role, score of the node, VRF,EPG,BD etc. to locate issues in a topological view.
In addition to the rolled up summary presentation of the anomalies and alerts, Nexus Dashboard Insights users can also interactively browse, search, and analyze the anomalies and advisory alerts generated by the service.
Anomalies are the issues found around the following network operations:
o Resource utilization
o Environmental issues like power failure, memory leaks, process crashes, node reloads, CPU, memory spikes
o Interface and Routing protocol issues such as CRC errors, DOM anomalies, interface drops, BGP issues like lost connectivity with an existing neighbor, PIM, IGMP flaps, LLDP flaps, CDP issues etc. Also provides a view into microbursts with offending and victim flows
o Flow drop with location and reason of drop, abnormal latency spikes of flows using hardware telemetry and direct hardware export. Flows impacted due to events in a switch-like buffer, policer, forwarding drops, ACL or policy drops, etc. using Flow Table Events (FTE) which is another form of hardware telemetry
o Endpoint duplicates, rapid endpoint movement, rogue endpoints
o Issues in the network configuration --- detected and reported as change analysis anomalies
o Violations to the compliance requirements for compliance assurance --- detected and reported as compliance anomalies
o Issues found in the network forwarding analysis and assurance --- detected and reported as forwarding anomalies
o Application issues as calculated by AppDynamics and Cisco Nexus Dashboard Insights (AppD Integration required)
Also consists of indication of being affected by known Cisco caveats and best practice violations at a node level.
Advisories – Nexus Dashboard Insights can identify Field Notices, software/hardware products EOL/EOS announcements, as well as PSIRTs that can potentially impact the network sites that it is monitoring, and generate advisory alerts to the network operations team. The alerts consiss of relevant impacts of the identified Field Notices, EOL/EOS or PSIRTs, as well as the affected devices in the network. Nexus Dashboard Insights also performs targeted bug scanning to alert the network operations team about the known defects that are relevant to their specific network environment based on its hardware/software versions, features that are enabled in the network, as well as network configuration. This helps the network team to carry out the remediation actions on the affected switches quickly or to form a software or hardware upgrade plan accordingly.
Starting with the 6.0 release, Nexus Dashboard Insights can run network delta analysis. It is a capability inherited from the Cisco NAE application. Users of the Insights service now can select any two snapshots of the network site and ask Insights to analyze the differences between them, including configuration differences, and differences in anomalies and advisories that reveal the differences in how the network was operating at the two points in time.
Understanding the differences in the network configuration and operations is important and extremely helpful for many different scenarios. When troubleshooting a network incidence, the differences in the network configuration or operations can often help identify the cause of the issue. When performing network maintenance, such as configuration changes, software upgrade or hardware replacement, it is helpful to check the differences in the network before and after the maintenance task. It can tell whether the network has converged or restored to how it should be after the task, or whether the task has resolved the issues that it is supposed to resolve, or if it has introduced any new issues. The Delta Analysis function increases network operation efficiency for these maintenance tasks, and helps reduce the Mean Time to Resolution (MTRR) for troubleshooting.
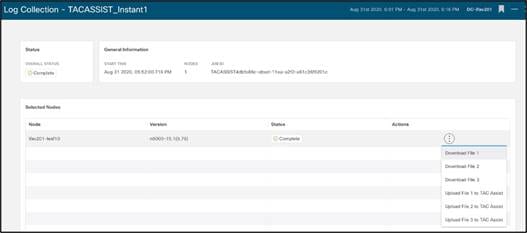
Nexus Dashboard Insights can assist the network team to collect tech-support logs per node. It turns the tedious task into a simple one-step automated job. These logs can be downloaded locally and optionally uploaded to Cisco Cloud to make them available for Cisco Support when opening a Service Request (SR).
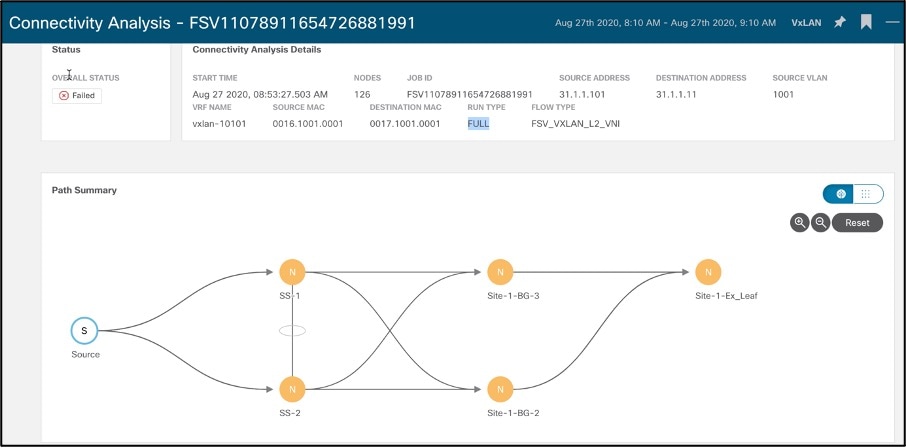
Allows user to run a quick or full analysis for a flow within one NX-OS network site or spanning multiple NX-OS network sites to:
o Trace all possible forwarding paths for a given flow across source to destination endpoints
o Identify the offending device with the issue, resulting in the flow drop
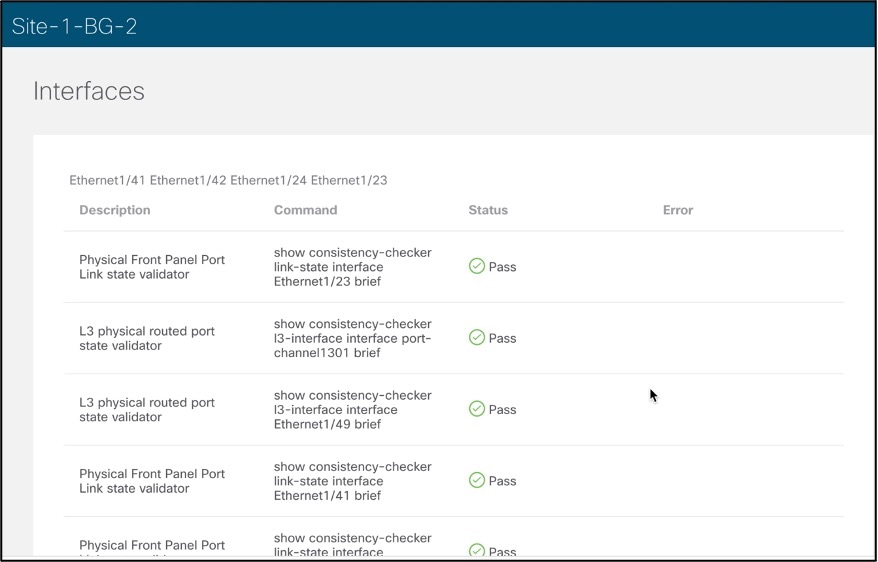
o Help narrow down the root cause of the issue, including running forwarding path checks, software and hardware states programming consistencies through consistency-checkers, and further details related to packets walkthrough and lookup results through packet capture
The following screenshot shows an example of the possible paths a flow can traverse while running thorough consistency checks with respective errors if any. These issues are time consuming to debug and connectivity analysis provides a quick analysis of these issues in a user driven way.
Browsing Cisco Nexus Dashboard Insights
Let’s delve into the Browse functionality available in Cisco Nexus Dashboard Insights. All anomalies observed for any of the below data sets are rolled into the Dashboard view of the respective site to draw your attention.
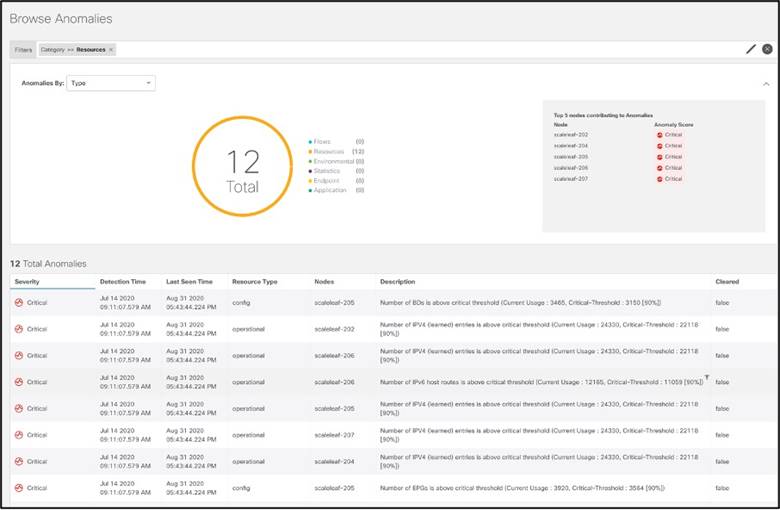
It is tedious to keep track of software verified scale per release, per resource and what scale the hardware in your network supports. Moreover, keeping track of utilization of resources per node over time, setting static thresholds for these resources to be notified on violation does not scale for dynamically growing networks. To resolve this, Cisco Nexus Dashboard Insights baselines utilization of resources, monitors trends, and generates anomalies on abnormal usage of resources across nodes to help a user plan for capacity in their networks.
Resource utilization shows time-series based trends of capacity utilization by correlating Software Telemetry data collected from nodes in each site. Persistent trends help identify burdened pieces of infrastructure and plan for resizing, restructuring, and repurposing.
Resource utilization categorizes capacity utilization as follows:
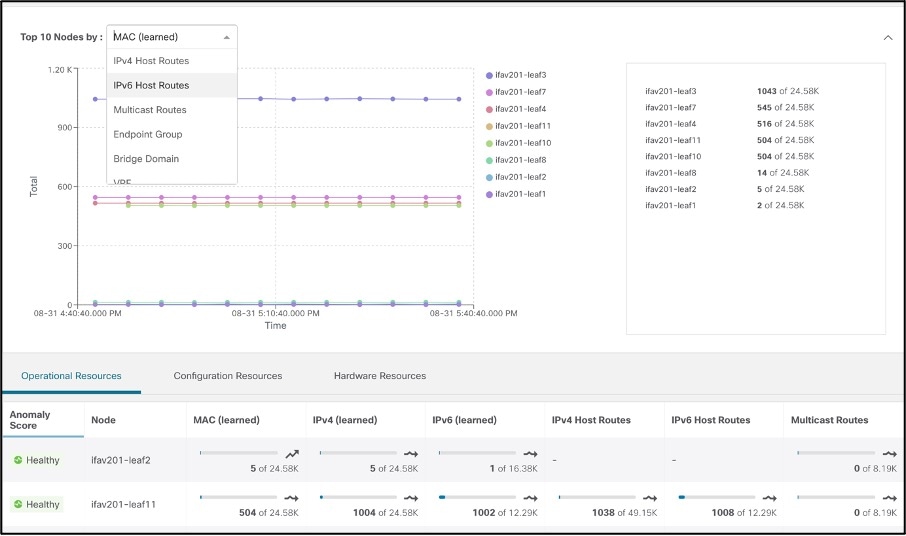
● Operational resources: Displays the capacity of transient resources that are dynamic in nature and expected to change over short intervals. Examples are routes, MAC addresses, security TCAM, etc
● Configuration resources: Displays the capacity utilization of resources that are dependent on configurations, such as the number of VRFs, bridge domains, VLANs, EPGs, etc
● Hardware resources: Displays port and bandwidth-capacity utilization
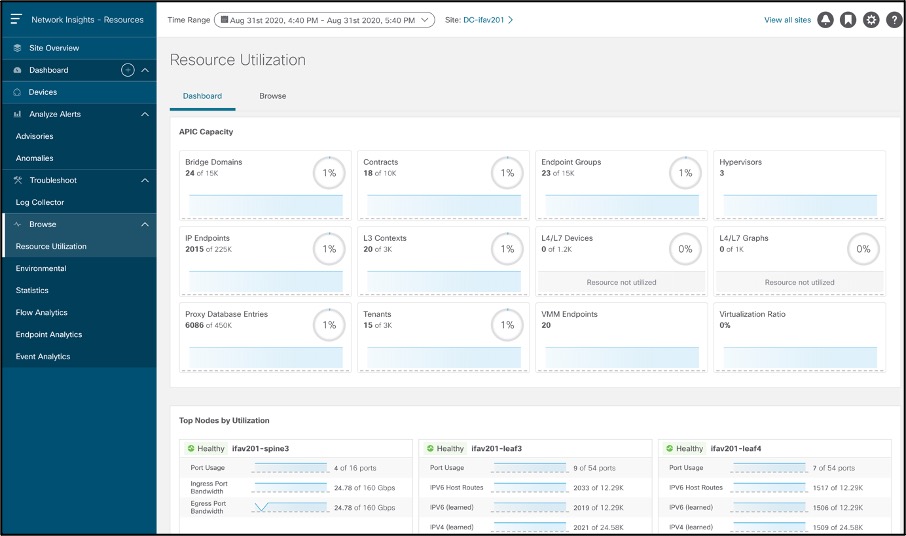
Drilling down on any device shows the details of processes that are high consumers of resources. Once resource utilization crosses a 70 percent capacity threshold, it is color-coded yellow; beyond 80 percent, it is color-coded orange, beyond 90 percent, it is color-coded red. This proactively alerts the network operators about the specific resources that need their attention.
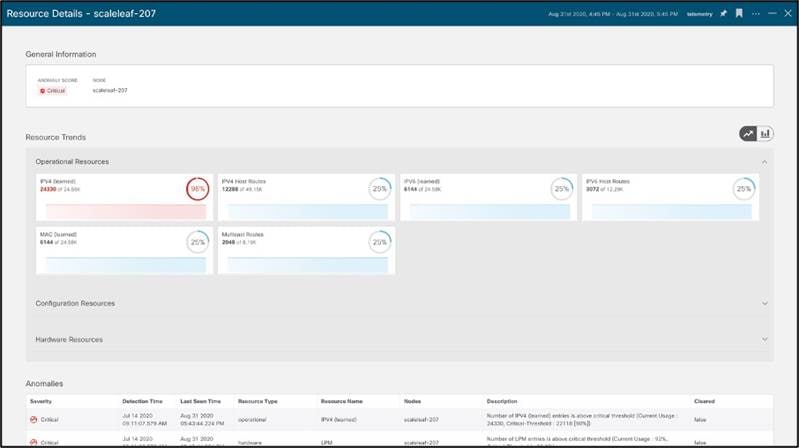
This also helps predict anomalies based on historical trends and rates of change and forecasts resource shortages. See the screenshot below for an example.
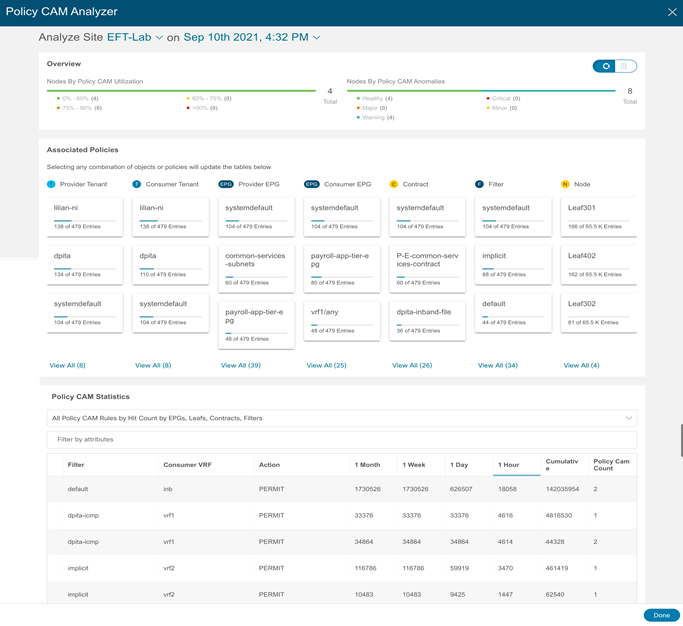
When it comes to policy TCAM analysis for an ACI network site, Nexus Dashboard Insights not only monitors it but also gives the network team the ability to analyse the per-contract/per-filter usage at a site or switch level. This allows the network team to easily understand which contracts are the ones using the most TCAM (globally or at a switch level) as well as understanding how much a contract is used by real traffic. This allows the network team to remove un-used contracts or optimize the high TCAM consumption contracts.
Most often, environmental data is monitored using traditional applications like SNMP, CLI etc. Data from these applications are difficult to post process, is device specific, not historical in nature, and requires manual checks. Hence, monitoring environmental anomalies becomes very reactive and cumbersome. Cisco Nexus Dashboard Insights consumes environmental data using streaming Software Telemetry, baselines trends and generates anomalies every time the utilization exceeds pre-set thresholds. It enables the user to determine which process is consuming CPU, hogging memory, when storage is overfilled, process crashes or whether there are memory leaks – providing all this data over time with historical retention per node, to allow users to delve into specific anomalies while having full visibility.
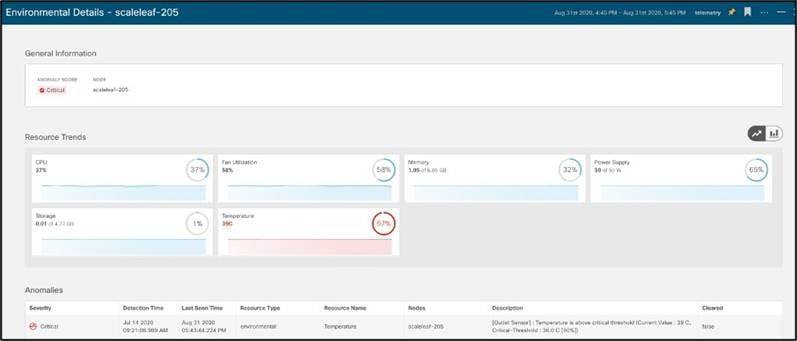
Environmental data provides anomaly-detection capabilities in hardware components such as CPU, memory, temperature, fan speed, temperature, power, storage etc. As in the other screens, it highlights components exceeding thresholds and requiring the operator’s attention.
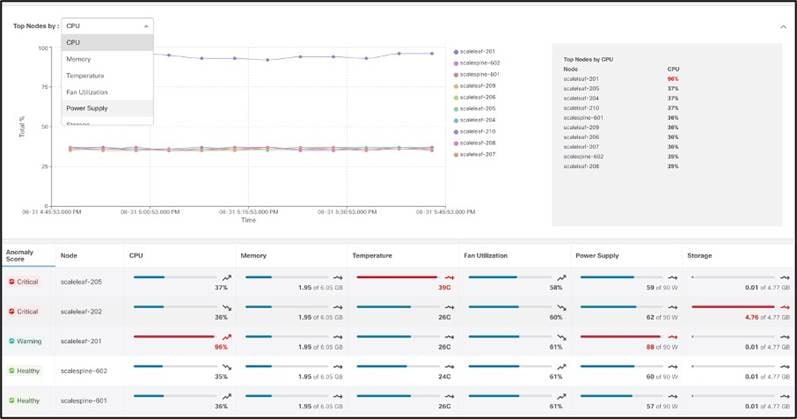
Screens with more details provide additional visibility into hardware component anomalies.
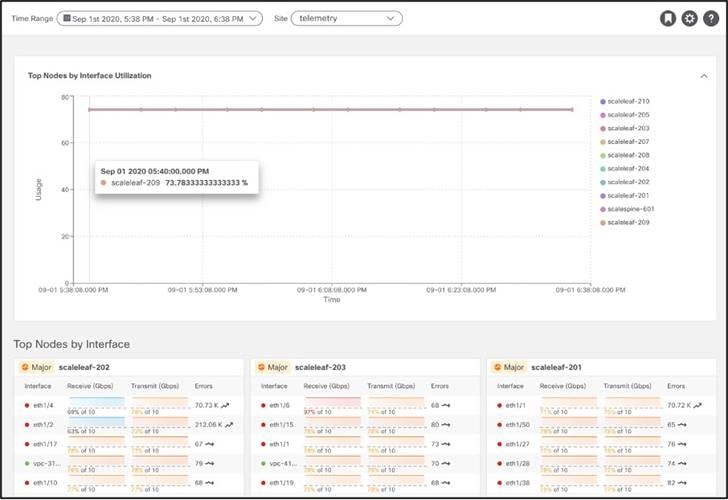
Statistics is all about interfaces and routing protocols. Cisco Nexus Dashboard Insights ingests data from each node in the fabric using streaming Software Telemetry. The data is then baselined to derive trends and identify when any of these data sets suddenly show a rapid decline (for example) in interface utilization or rapid increase in drops or CRC errors over time.
Dashboard view presents top nodes by interface utilization and errors thereby allowing the user to quickly identify interfaces to investigate errors.
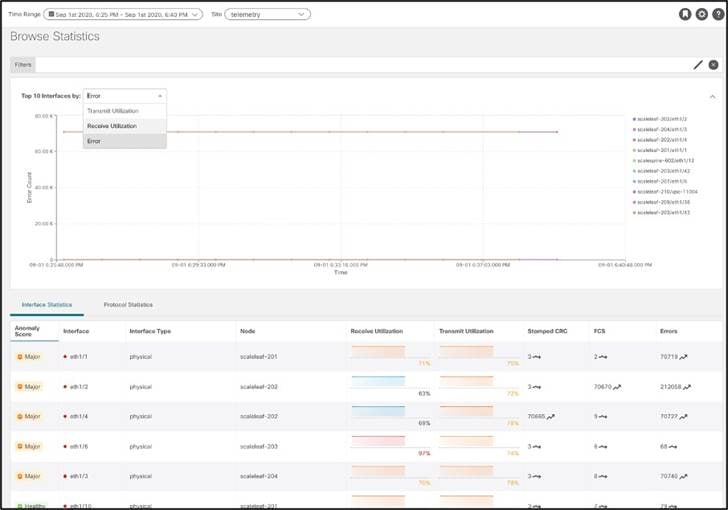
Browse view helps deep dive into Interface and Protocol Statistics.
Interface statistics provide a view into the trend of utilization, errors such as CRC, FCS, Stomped CRC.
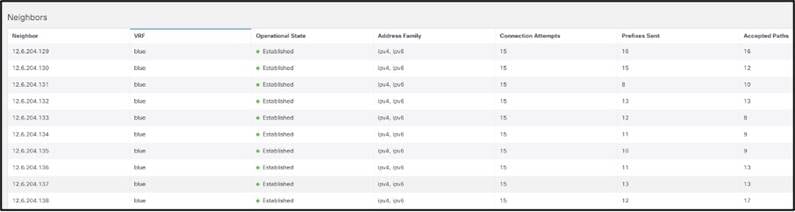
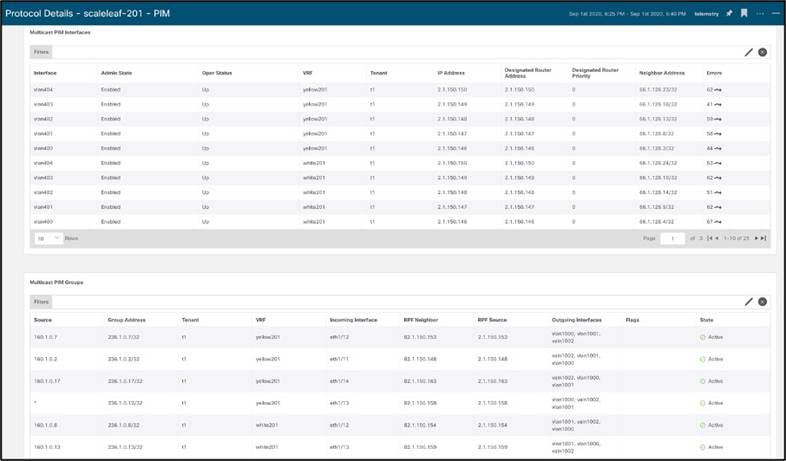
Protocol Statistics provide a view into what interfaces protocols such as CDP, LLDP, LACP, BGP, PIM, IGMP, IGMP snoop are active, protocol details like neighbors, incoming and OIFs for a (*,G), (S,G) entry along with trends of errors like a lost connection or neighbor, OIF flaps, invalid packet etc.
Example of BGP neighbors –
Example of PIM Interfaces and groups –
Statistical data is also used for correlation in Cisco Nexus Dashboard Insights. For instance, if there is a CRC error, Cisco Nexus Dashboard Insights will use other data sets to find out the estimated impact (like impacted endpoints) and provide a recommendation based on other anomalies seen at that time (like a DOM anomaly which could potentially be causing CRC errors).
Application problem or network problem? This is a frequently asked question in the data center world. If anything, it always begins with the network. The time to innocence and mean time to resolution become imperative as we deal with business critical applications in the data center. The tools for network operations today often have very limited insights on data plane counters, flows, latency, and drops. Even if we can get the data plane flow data from the network switches, how can the data from the inviditual switches be pieced together to form an end-to-end view of a flow while it is traversing the network? How can the end-to-end network latency of a flow be extracted from the flow data ? It used to be the network team that had to do all of these complex flow analysis tasks with limited helping tools, which means a lot of man hours. With Cisco Nexus Dashboard Insights, using Flow Telemetry, the service consumes flow records and respective counters, correlates this data over time to provide end to end flow path and latency. Cisco Nexus Dashboard Insights understands what is the “normal” latency of each flow. When the latency exceeds this normal, it alerts the users and shows the abnormal latency increase as an anomaly on the dashboard.
Flow analytics dashboard attracts operator attention to key indicators of infrastructure data-plane health. Time-series data offer evidence of historical trends, specific patterns, and past issues and help the operator build a case for audit, compliance, and capacity planning or infrastructure assessment. The flow analytics dashboard provides a time-series-based overview, as shown below, with the capability to drill down on specific functions by clicking on the graph.
● Top Nodes by Average latency: Shows top nodes by highest average end to end latency. This results in egress nodes with flows having maximum end to end latency.
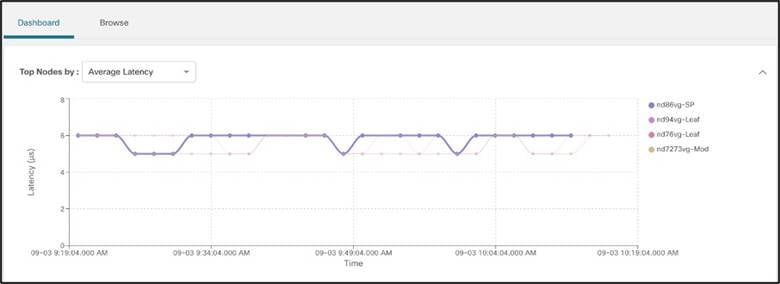
Clicking on a node results in all flows with that node as an Egress node, thereby allowing the user to drill into top flows that have high latency passing through a particular egress node.
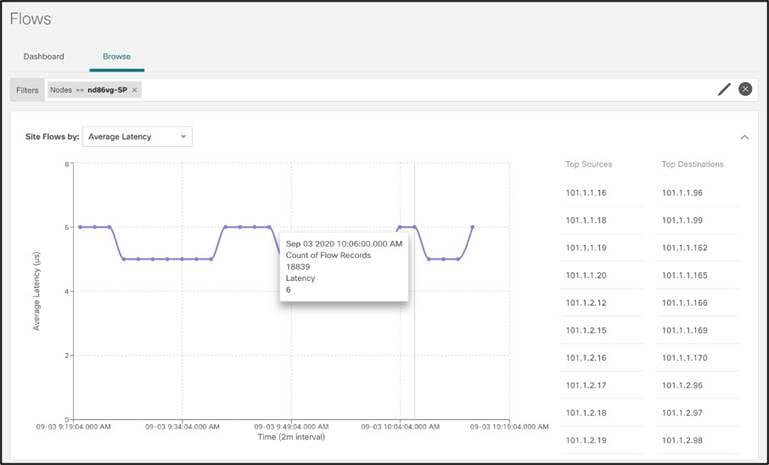
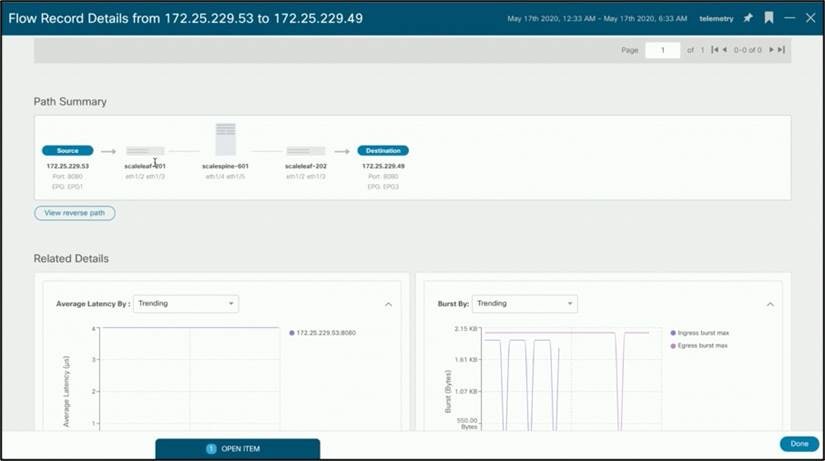
● Top flows by Average Latency: Shows time-series-based latency statistics. Clicking on a particular flow drills down to detailed flow data, including latency numbers, the exact path of the flow in the fabric, and the end-to-end latency. This takes away trial-and-error and manual steps otherwise required to pinpoint latency hot spots in the infrastructure. This leads operators to focus on the root causes of the latency and remediate them. Historical trends help operators identify persistent problems and re-evaluate the infrastructure capacity.
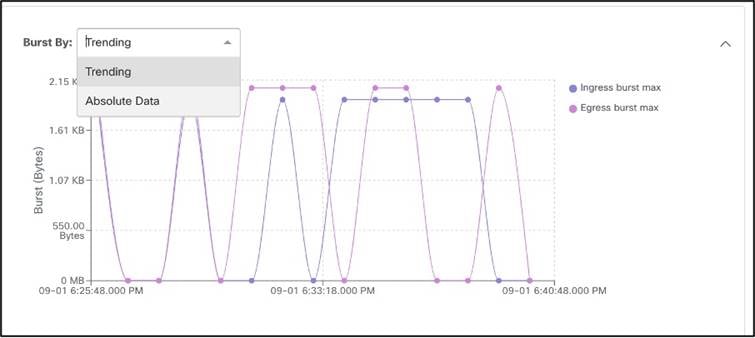
Double-clicking on the flow shows the flow level details.
Details of the flow, such as burstiness, help identify and remediate bandwidth issues or apply appropriate Quality of Service (QoS) levels.
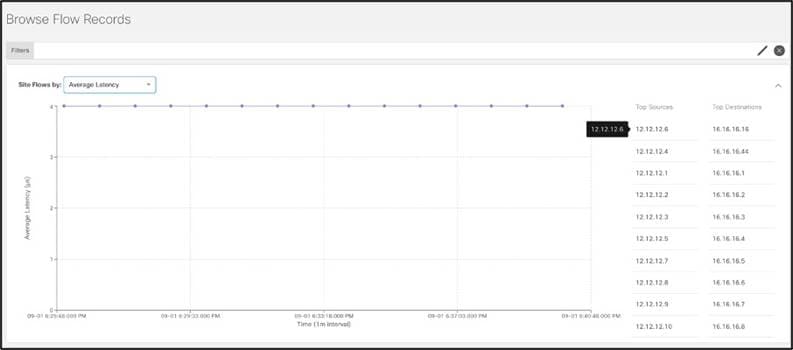
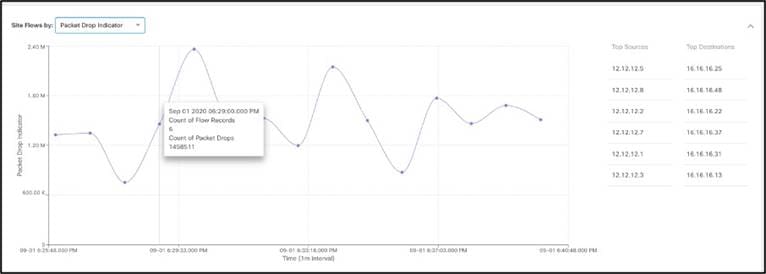
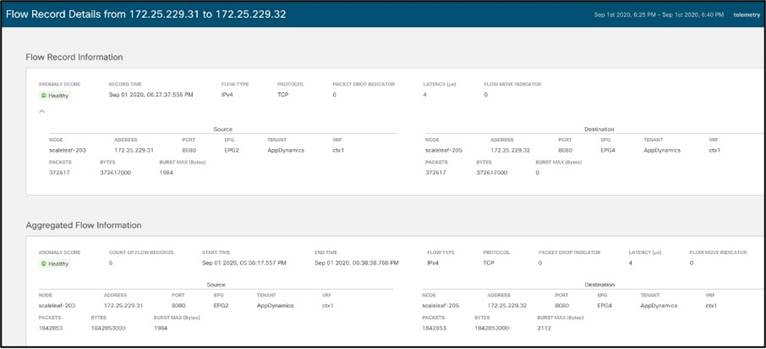
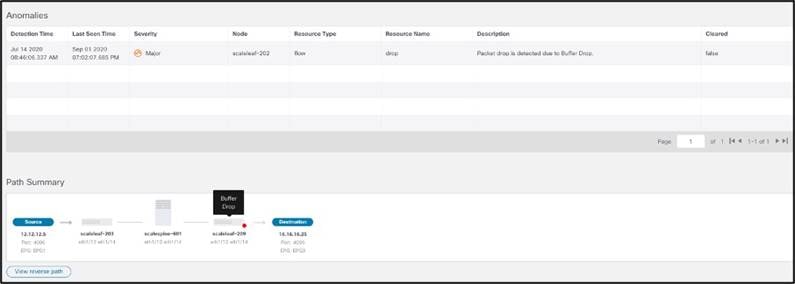
● Top Flows by Packet drop indicator: Shows time-series-based packet drop statistics. Clicking on a particular flow drills down to detailed flow data, including at which exact point in the fabric the drop occurred and why they occurred, as shown in the two graphics below. This saves precious time during troubleshooting and helps operators quickly identify and locate the specific potential problem-points in the infrastructure.
Shows time-series-based endpoint movement in the fabric, with endpoint details, and endpoints with duplicate IPs. In virtualized data center environments, this keeps track of virtual machine movement, which is extremely useful to identify its current location and its historical movements in the fabric. It provides proof points in establishing virtual-machine movements and thus aids constructively in problem solving while working with other IT teams. See the screenshot below.
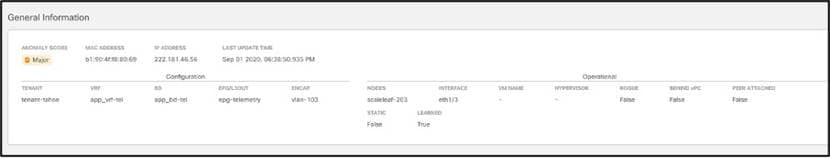
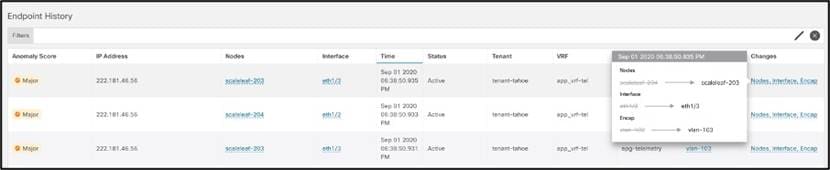
Endpoint health and consistency is also monitored by Nexus Dashboard Insights:
- Duplicated endpoint ? Problem solved. The Insights service will detect them quickly and point the user to the switch and port from where the duplication is present.
- Stale endpoints? The Insights service provides built-in automation to remediate this situation with a single click
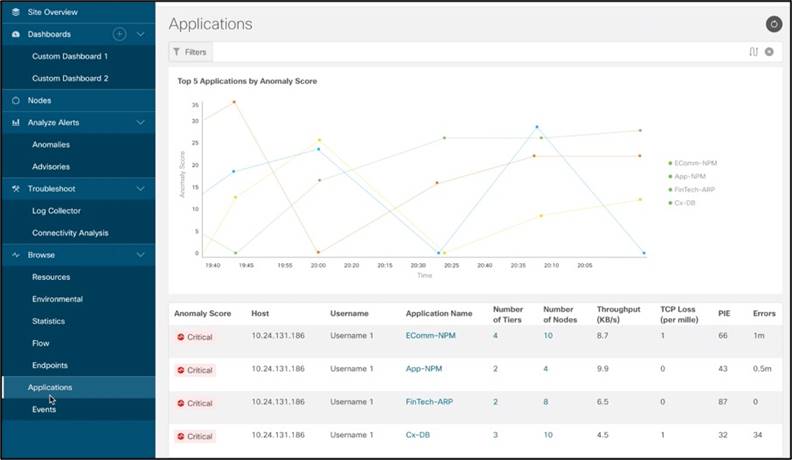
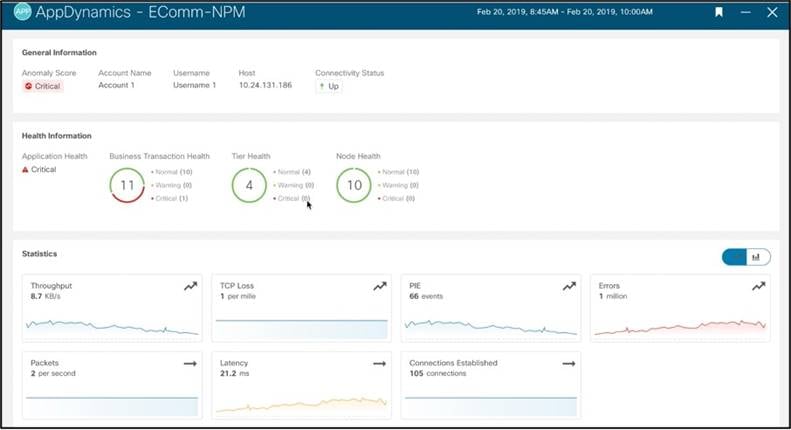
With Cisco AppDynamics and Cisco Nexus Dashboard Insights integration, users get a single pane of glass for application and network statistics and anomalies. Cisco Nexus Dashboard Insights consumes data streamed from AppDynamics controller and in addition to showing application, tier, node health and metrics, Cisco Nexus Dashboard Insights derives baseline of Network Statistics of these applications like TCP loss, Round Trip Time, Latency, Throughput, Performance Impacting Events (PIE) and generates anomalies on threshold violations. For any AppDynamics flows, Cisco Nexus Dashboard Insights also provides an in-depth end of end path, latency, drops if any, and drop reasons to help users identify if app slowness or issues are resulting from network issues.
Application Dashboard showing all applications and respective statistics –
Delve deeper into an application to see health, respective tiers and nodes –
A network link is communication between tiers. Cisco Nexus Dashboard Insights maps links to respective flows traversing the fabric thereby allowing users to see flow details and path with drops if any –
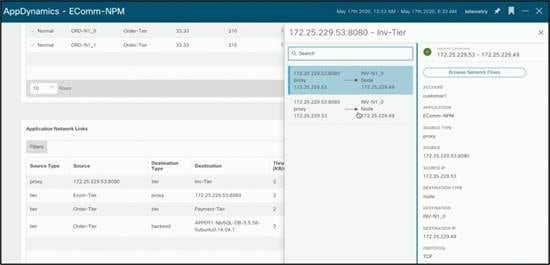
Clicking on the above flow takes you to the detailed flow page to analyze abnormal latency or drops, if they exist.
This integration is vital to blurring the lines of silos inside the organization enabling operators to see the network from the applications point of view. The operator does not need to know which IP is associated to which application or which application flow through which nodes at any given time. Cisco Nexus Dashboard Insights provides all this information, enriches the data, and correlates it for a holistic unified operational view.
Event analytics is tuned for control-plane events in the infrastructure. It performs the following:
● Data collection: configuration changes and control plane events and faults
● Analytics: Artificial Intelligence (AI) and Machine-Learning (ML) algorithms determine the correlations between all changes, events, and faults
● Anomaly detection: output of AI and ML algorithms (unexpected or downtime-causing events)
The event analytics dashboard displays faults, events, and audit logs in a time-series fashion. Clicking any of these points in the history displays its historical state and detailed information. Further, all these are correlated together to identify if deletion of configuration led to a fault.
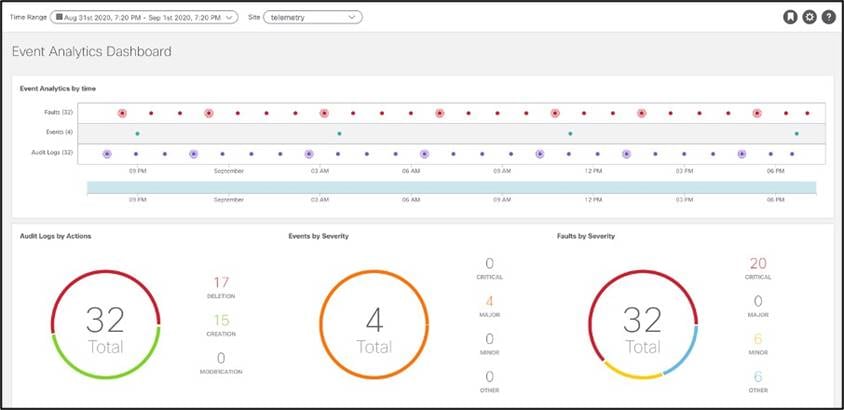
● Audit logs: Shows the creation, deletion, and modifications of any object in Cisco ACI. For example, subnet, IP address, next-hop, EPG, VRF, etc. This is useful for identifying recent changes that may be a potential reason for unexpected behavior. It can aid in reverting changes to a stable state and helps assign accountability. The facility of the filters makes it convenient to narrow focus to specific changes by severity, action, description, object, etc. Drilling down on the audit logs provides details for each log.
● Events: Shows operational events in the infrastructure; for example, IP detach/attach, port attach/detach on a virtual switch, interface state changes, etc.
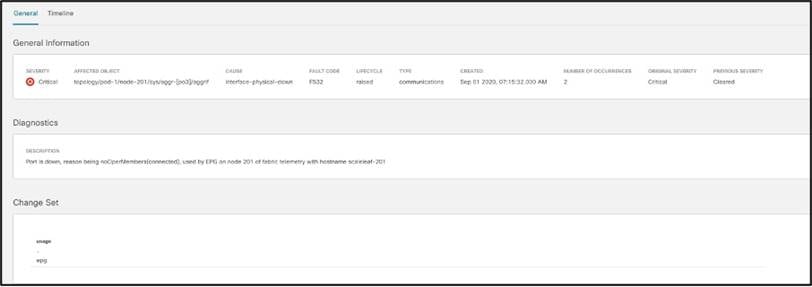
● Faults: Are mutable, stateful and persistent managed objects and show issues in the infrastructure; for example, invalid configurations. This function speeds up operator action toward problem rectification, thus reducing the time lost in root-cause analysis and rectification, which usually requires multiple steps, expertise, correlation of symptoms, and perhaps a bit of trial and error.
The zoom in and out function in the timeline bar helps to quickly contract or expand the timeline under investigation.
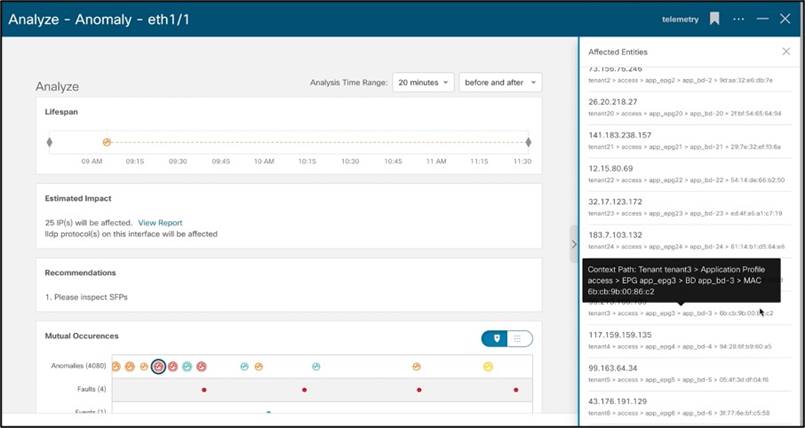
Diagnostics, Impact, Recommendation
Cisco Nexus Dashboard Insights monitors different sets of data from all nodes in the fabric and baselines the data to identify “normal” behavior. Any deviation from this normal is represented as an anomaly in the service dashboard. This helps the operator spend time on resolving the issue instead of finding where in the network the issue really arose. With the correlation algorithms that Cisco Nexus Dashboard Insights has in place, in addition to the anomaly, it can also point to an estimated impact of this anomaly helping the user identify what is the potential impact of a problem. With the impact, the service will also generate a recommendation depending on the nature of the anomaly reducing the Mean Time to Troubleshooting and Resolution.
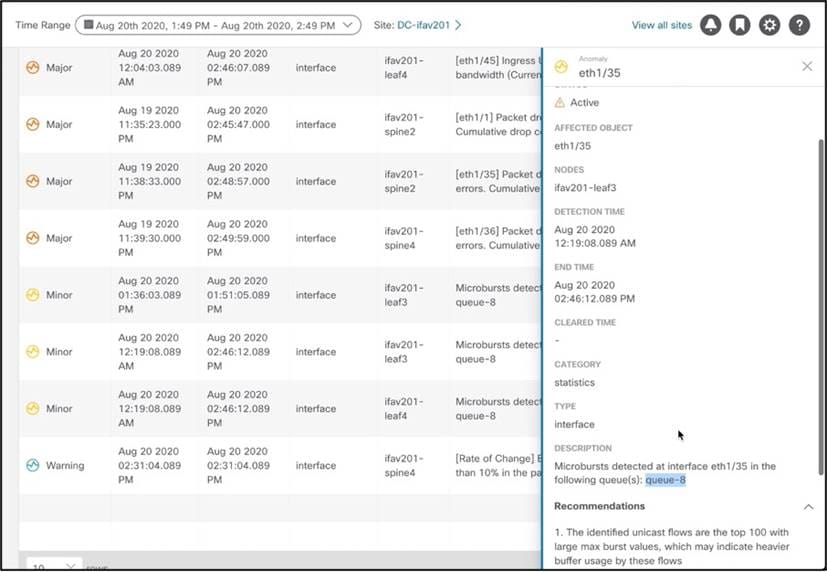
For example, let’s look at this Microburst anomaly. Microbursts are complex to identify and cause a myriad of network issues. For applications that require reliable and low-latency networks, Microbursts can pose serious issues. Since microbursts occur in the order of microseconds, looking at a graph of overall packets-per-second will make the overall transmission appear smooth. Cisco Nexus Dashboard Insights detects these microbursts due to its rapid cadence of gathering data and details what flows could be impacted due to these bursts and even causing the bursts. It makes it easier for the operator to not only detect that a burst occurred on a particular node, interface, and queue but also flows impacted with a recommendation for how to fix this anomaly.
Example of a microburst anomaly –
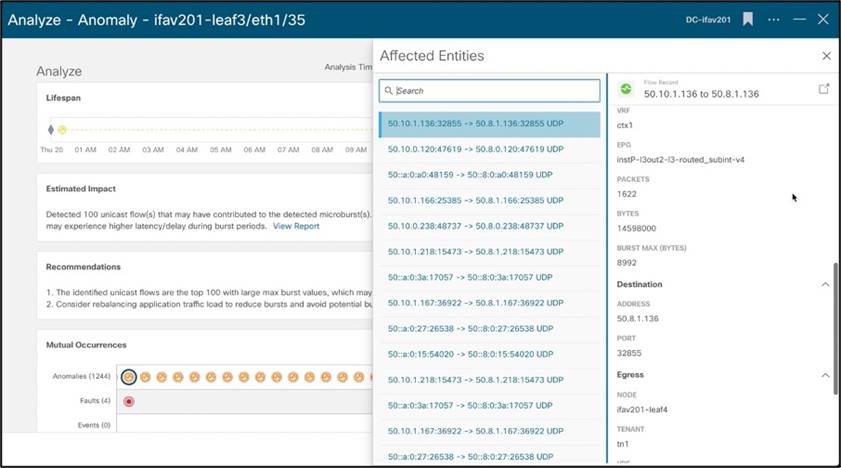
Example of what flows could be experiencing high latency due to the occurrence of microburst at this particular
time span -
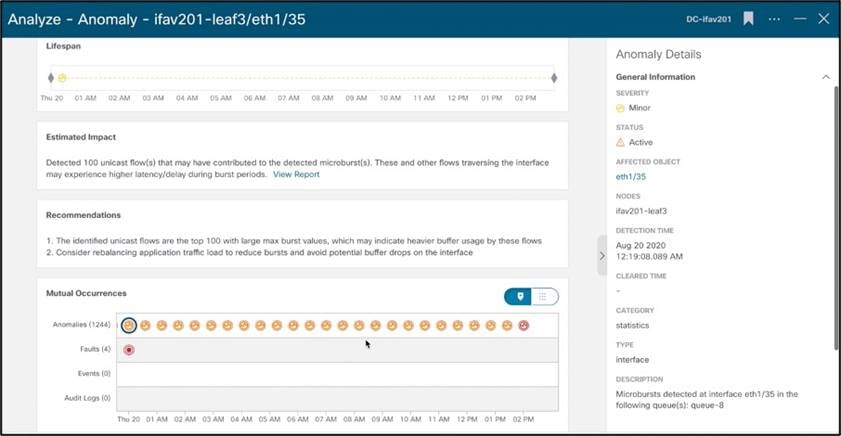
Recommendations for how to remediate this anomaly along with mutual occurrences of other issues in that node as noted by Nexus Insight. It also displays Audit Logs, Events, Faults to keep all the information in one page to allow for quick troubleshooting.
To maintain data center network availability and minimize the downtime, it is critical for network operators to ensure that their network infrastructure is built with up-to-date switch platforms and is running the right versions of software. It requires periodic and thorough audits of the entire infrastructure, which is historically a manual and time-consuming task. Cisco Nexus Dashboard Insights turns this task into an automated process, using digitized signatures to determine the vulnerability exposure of the network infrastructure at the click of a button.
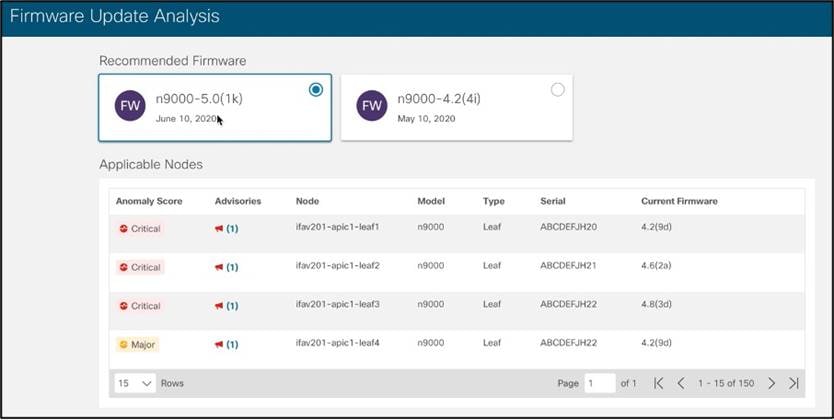
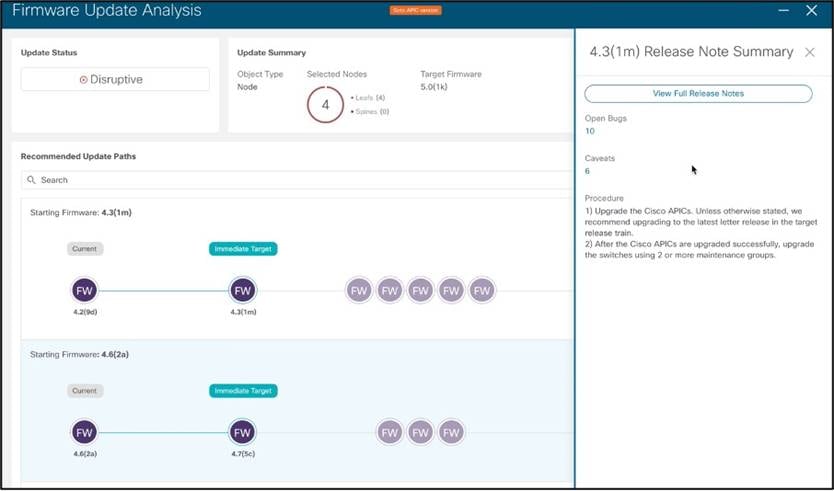
Cisco Nexus Dashboard Insights scans the entire network to collect the complete information on its hardware, software versions, and active configuration. It then runs analysis against the digitalized database of known defects, PSIRTs, field notices to identify the relevant ones that can potentially impact the particular network environment, matching on its hardware and software versions, features and topologies, etc. It then proactively alerts the network operators of the identified vulnerabilities and advises them on the right hardware and/or software versions for remediation. It also analyzes and advises on whether the network is running any out-of-date hardware or software based on Cisco product EoL (End of Life) or EoS (End-of-Sales) announcement and schedule. For any of the discovered issues, Cisco Nexus Dashboard Insights lists the impacted devices, vulnerability details, and mitigation steps aka advisories. With the advisories, it recommends the best software version for the resolution, and the upgrade path, either a single-step upgrade or through intermediate software versions. It also reveals the impact of the upgrade, either disruptive or non-disruptive, so that the operators can proactively plan for the upgrade accordingly.
With the automated scanning, network-context-aware vulnerability analysis, and actionable recommendations, the advisory function in Cisco Nexus Dashboard Insights makes it so much easier for the operation team to maintain an accurate audit of the entire network and avoid the downtime due to product defects or PSIRTS by getting proactive alerts and taking preventive remediation actions.
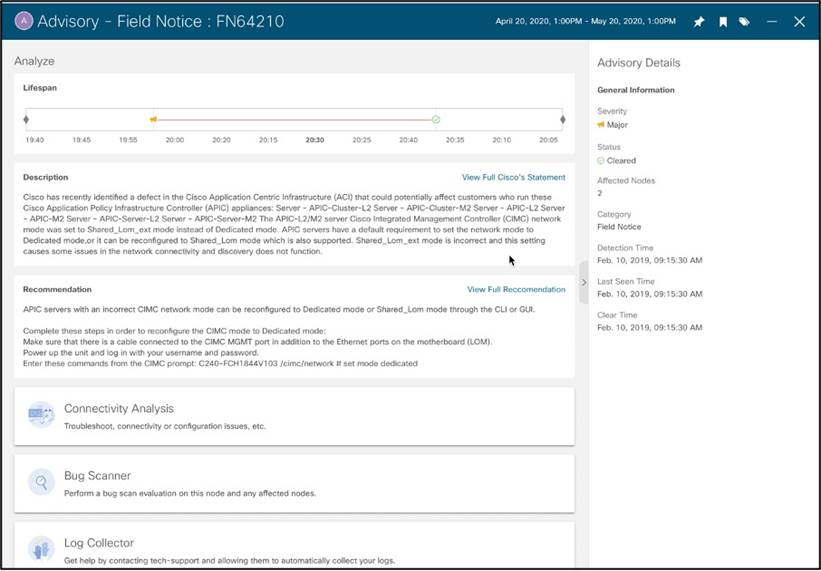
Example of an Advisory on Field Notice –
Example of firmware upgrade recommended by Cisco Nexus Dashboard Insights –
Example of Upgrade Analysis – list of intermittent upgrades to get to the destination software, upgrade impact, release notes for each release linked directly in Cisco Nexus Dashboard Insights –
Cisco introduced Cisco Nexus Dashboard as a central management console for all the onboarded data center sites and a central hosting platform for data center operation services, such as Cisco Nexus Dashboard Insights. It simplifies the operation and life cycle management of various applications and reduces the infrastructure overhead to run the different applications by providing a common platform and application infrastructure. Additionally, it provides a central integration point for API-driven 3rd party applications with the services that are hosted on Cisco Nexus Dashboard.
Cisco Nexus Dashboard Insights is a micro-services-based service designed to be hosted on Cisco Nexus Dashboard. Nexus Dashboard provides a cluster of compute nodes which are horizontally scalable. As a service natively hosted on Cisco Nexus Dashboard, the sizing and number of compute nodes required for Cisco Nexus Dashboard Insights depends on the number of fabrics, number of switches in each fabric and the flows/second that the users want the service to support.
See the following documents for more references:
● Cisco Nexus Dashboard Insights Data Sheet
● Cisco Nexus Dashboard Insights User Guide, Release 6.0(1) for Cisco ACI
● Cisco Nexus Dashboard Insights User Guide, Release 6.0(1) for Cisco DCNM
● Cisco Nexus Dashboard Insights FAQ
● Cisco Nexus Dashboard FAQ
Software and Hardware Dependencies with Scale
The Nexus Dashboard Insights service is supported on Cisco ACI and Cisco DCNM. Please refer to Cisco Nexus Dashboard and Services Compatibility Matrix for the latest software compatibility information.
The Cisco Nexus Dashboard Insights service license is included as part of the Cisco ACI or NX-OS Premier license. Customers that have a Cisco ACI or NXOS Essentials license, or Advantage license can purchase the add-on DCN Day2Ops including Cisco Nexus Dashboard Insights.
Both the above licenses are a subscription-only Smart License. For a more detailed overview on Cisco Licensing, go to https://www.cisco.com/go/licensingguide
The number of device licenses required is the total number of leaf switches in the Cisco ACI fabric and/or total number of nodes in the Cisco DCNM based fabric.
Pricing and ordering:
For ordering information, click here. Alternately, contact your Cisco Account team to learn future pricing and get additional details.
Cisco Nexus Dashboard Insights provides actionable insights using predictive analytics, network assurance, and AIOps. It uses a vast range of information, tracking data about the infrastructure, learning new events and determining their cause, and highlighting unexpected occurrences in the network while at the same time helping network operators plan ahead, comply with policies and audits, and keep track of infrastructure capacity and uptime. Cisco Nexus Dashboard Insights attempts to be an extension of the operator’s brain to prevent failure in the network, or to focus attention on remedial steps to recover faster from failure when it does occur.