
First Published: 2024-02-16
Americas Headquarters
Cisco Systems, Inc.
170 West Tasman Drive
San Jose, CA 95134-1706
USA
http://www.cisco.com
Tel: 408 526-4000
800 553-NETS (6387)
Fax: 408 527-0883
New and Changed Information
The following table provides an overview of the significant changes up to the current release. The table does not provide an exhaustive list of all changes or the new features up to this release.
| Feature | Description | Release | Where Documented |
|---|---|---|---|
|
Multi-Cluster Connectivity |
Consolidate multiple Nexus Dashboard clusters into a single Global View. |
6.4.1 |
This document is available from your Cisco Nexus Dashboard Insights GUI as well as online at www.cisco.com. For the latest version of this document, visit Cisco Nexus Dashboard Insights Documentation.
Overview
Journey
In Nexus Dashboard Insights, use the Journey map to get started. Navigate to Overview > Global View > Journey: Getting Started to access the Journey map.
Let’s learn about the various milestones that you will come across in your Nexus Dashboard Insights journey.
When you first log in to Nexus Dashboard Insights, you will click through the Meet Nexus Dashboard Insights, where you’re introduced to some of our terminology, and you’re walked through a couple of the features to get an overview of what all Nexus Dashboard Insights has to offer. Keep going until you get to the You’re ready! page.
Finally you see the Journey Map: Getting Started, where by now you’ve already completed the first step in the map! As you complete each step, the map will show you the next step to complete. The My Progress displays your progress as a percentage of tasks and the number of steps you’ve completed.
Click Tell Me More for a brief description about what you will achieve with each step.
Click Go to jump directly to a section.
The following section helps understand the various steps on your Journey of getting started with Nexus Dashboard Insights.
After you add the first site, Global View becomes the default tab whenever you launch Nexus Dashboard Insights. To learn more see, Global View.
Global View
In Nexus Dashboard Insights Global View displays all your site details and key health metrics in a single place. Navigate to Overview > Global View to access Global View. Nexus Dashboard Insights helps aggregate your most important details from site health to traffic all under Global View.
After you add the first site, Global View is your first view every time you launch Nexus Dashboard Insights. You’ll get a bird’s eye view of your global network infrastructure for all your sites and the key health metrics. Nexus Dashboard Insights helps aggregate your most important details from site health to inventory use and access it all by scrolling down.
For multi-cluster deployments see Multi-Cluster Connectivity.
There are two views to the global view, Online Sites and Snapshot Sites. The map visually shows the physical location and total number of your sites in each location. If only one site is present in any location, the name, and type of the site is displayed, however if there are multiple sites in a location, only the total number of sites is displayed. The list of sites in that particular location can be viewed by hovering over the number displayed. Click a site to view the details for that site, or scroll down to the Sites area to navigate to your site. You can also use the the zoom control icons in the page to change your view of the map.
You can find more aggregated information about the sites right below the map.
Anomaly Level Critical shows the aggregated number of anomalies across sites at the maximum level of severity at that time, including how many occurred in the last week. You can view the anomalies at a glance or you can click the card to view the details. You can click View all anomalies to see all the anomalies with different severities.
Advisory Level Critical shows the aggregated number of advisories across sites at the maximum level of severity at that time, including how many occurred in the last week. You can view the advisories at a glance or you can click the card to view the details. You can click View all advisories to see all the advisories with different severities. Note:

The Anomaly Level Critical and Advisory Level Critical is not available for snapshot sites.
Continue scrolling down in Global View to see more. As you scroll further down from the aggregated information you can see how many of the total sites have anomalies and the number of sites which have critical level anomalies.
Below this you can see an at-a-glance summary for each individual site. It includes their anomaly and advisory health levels, external traffic with total data transferred in the last week, connectivity data for endpoints and Layer 3 neighbors and inventory data with the total number of controllers and switches for that site. Click Site Details to view more details about a specific site. See Sites
Connectivity data is not available for snapshot sites.
The Anomalies area shows details about the anomaly count and trend. See The Advisories area shows details about the advisory count and trend. Anomalies and Advisories
Below the at-a-glance summary for each site, you can now view a Trend Chart for Anomalies and Advisories. You can click on either one to view the trend for the last 7 days. The Now bar explains the number of anomalies per severity that are active right now. The various severity levels are Critical, Major, Warning, and Healthy. They are visible by hovering over the bar.
The bars for the last 6 days displays the number of anomalies that were active by the end of that day. So if yesterday at 8 am we had 2 Critical and 3 Warnings and by 11:59 pm, we had 1 Critical and 1 Warning, the bar for yesterday would display 1 Critical and 1 Warning.
It also mentions if the overall trend for Anomalies or Advisories has been up or down.
Trend Chart is not available for snapshot sites.
You can see the External Traffic that your sites have sent and received in the last 7 days. In addition, it tells you the total number of sites sending and receiving traffic. The donut helps view the how much traffic is sent and received by each site. Click information icon to view more information about what External Traffic is and how it can be measured for the different types of sites.
Inventory displays a status of your inventory for controllers, switches, software, and conformance. Messages could include warnings related to hardware or whether your software requires an update. Click Open Inventory view detailed information. See Inventory
You’re caught up! This concludes all we have in Global View. If you’d like to explore more, you can dive into the other sections of Nexus Dashboard Insights for details.
Configuring the Time Zone for Nexus Dashboard Insights
By default the Nexus Dashboard Insights GUI displays the user’s local time zone date and time. You can configure your time zone setting to a different time zone in Nexus Dashboard. The time zone feature is available per user and is stored in your user preferences.
The time zone that you select will be reflected in the time values displayed in your GUI. All the detection timelines and timestamps that are shown in the GUI will be reflect the time values for the time zone you have selected.
Procedure
-
Log in to Nexus Dashboard.
-
Click the User icon on the top right and choose User Preferences.
-
In the User Preferences page, in the Time Zone area, the default time zone value is selected as Automatic.
This is the user’s local time zone.
-
In the Time Zone Preference field, choose Manual.
-
In the Nearest City field, enter your preferred city to populate the appropriate time zone in the Time Zone field.
Alternatively, you can drag the pin in the map to the city of your choice, and it will populate the fields for Nearest City and Time Zone.
-
Click Save.
The time zone that you select will be reflected in the time values displayed in your Nexus Dashboard Insights GUI. All the detection timelines and timestamps that are displayed in the Nexus Dashboard Insights GUI will reflect the time values for the time zone you have selected.
Custom Dashboard
Custom Dashboard
The custom dashboard allows you to organize and collect all your ideas in one place. You an create a custom dashboard and add widgets on to the custom dashboard. The custom dashboard displays the top level information about each widget pinned to the dashboard.
Create a Custom Dashboard
-
Navigate to Overview > Custom Dashboards > Add New Dashboard.
-
Click Let’s get started!.
-
Enter the Name and Description.
-
Click Next step > Go to my Dashboard .
-
Navigate to the page you would like to pin to the custom dashboard.
-
Select a particular object to view the detail page.
-
Click the pin icon.
-
Select the applicable dashboards.
-
Click Save.
View a Widget added to a Custom Dashboard
-
Navigate to Overview > Custom Dashboards
-
Click any pinned view.
Each view in the custom dashboard saves the entire snapshot of the page including the user selected time range for any specific object.
Delete a Widget from a Custom Dashboard
-
Navigate to Overview > Custom Dashboards
-
Select any pinned widget in the custom dashboard.
-
Click the ellipse icon to delete the widget from the custom dashboard.
Multi-Cluster Connectivity
Multi-Cluster Connectivity
In Cisco Nexus Dashboard, the Multi-cluster Connectivity allows you to connect multiple clusters together for a Single Pane of Glass (SPOG) view and administration of the clusters and their sites, services, and configurations. When you add a second cluster, a group of clusters is formed. The cluster from which you create the group becomes the "primary" cluster with a number of unique characteristics that do not apply to other clusters in the group.
See Cisco Nexus Dashboard Infrastructure Management for information on Multi-cluster Connectivity.
View Multi-Cluster Connectivity
In Nexus Dashboard Insights, the Cluster drop-down displays the name of the currently viewed cluster. This is enabled for multi-cluster deployments only and allows you to quickly switch to another connected cluster.
In Nexus Dashboard Insights, Global View displays all your site details, cluster name, and key health metrics in a single place.
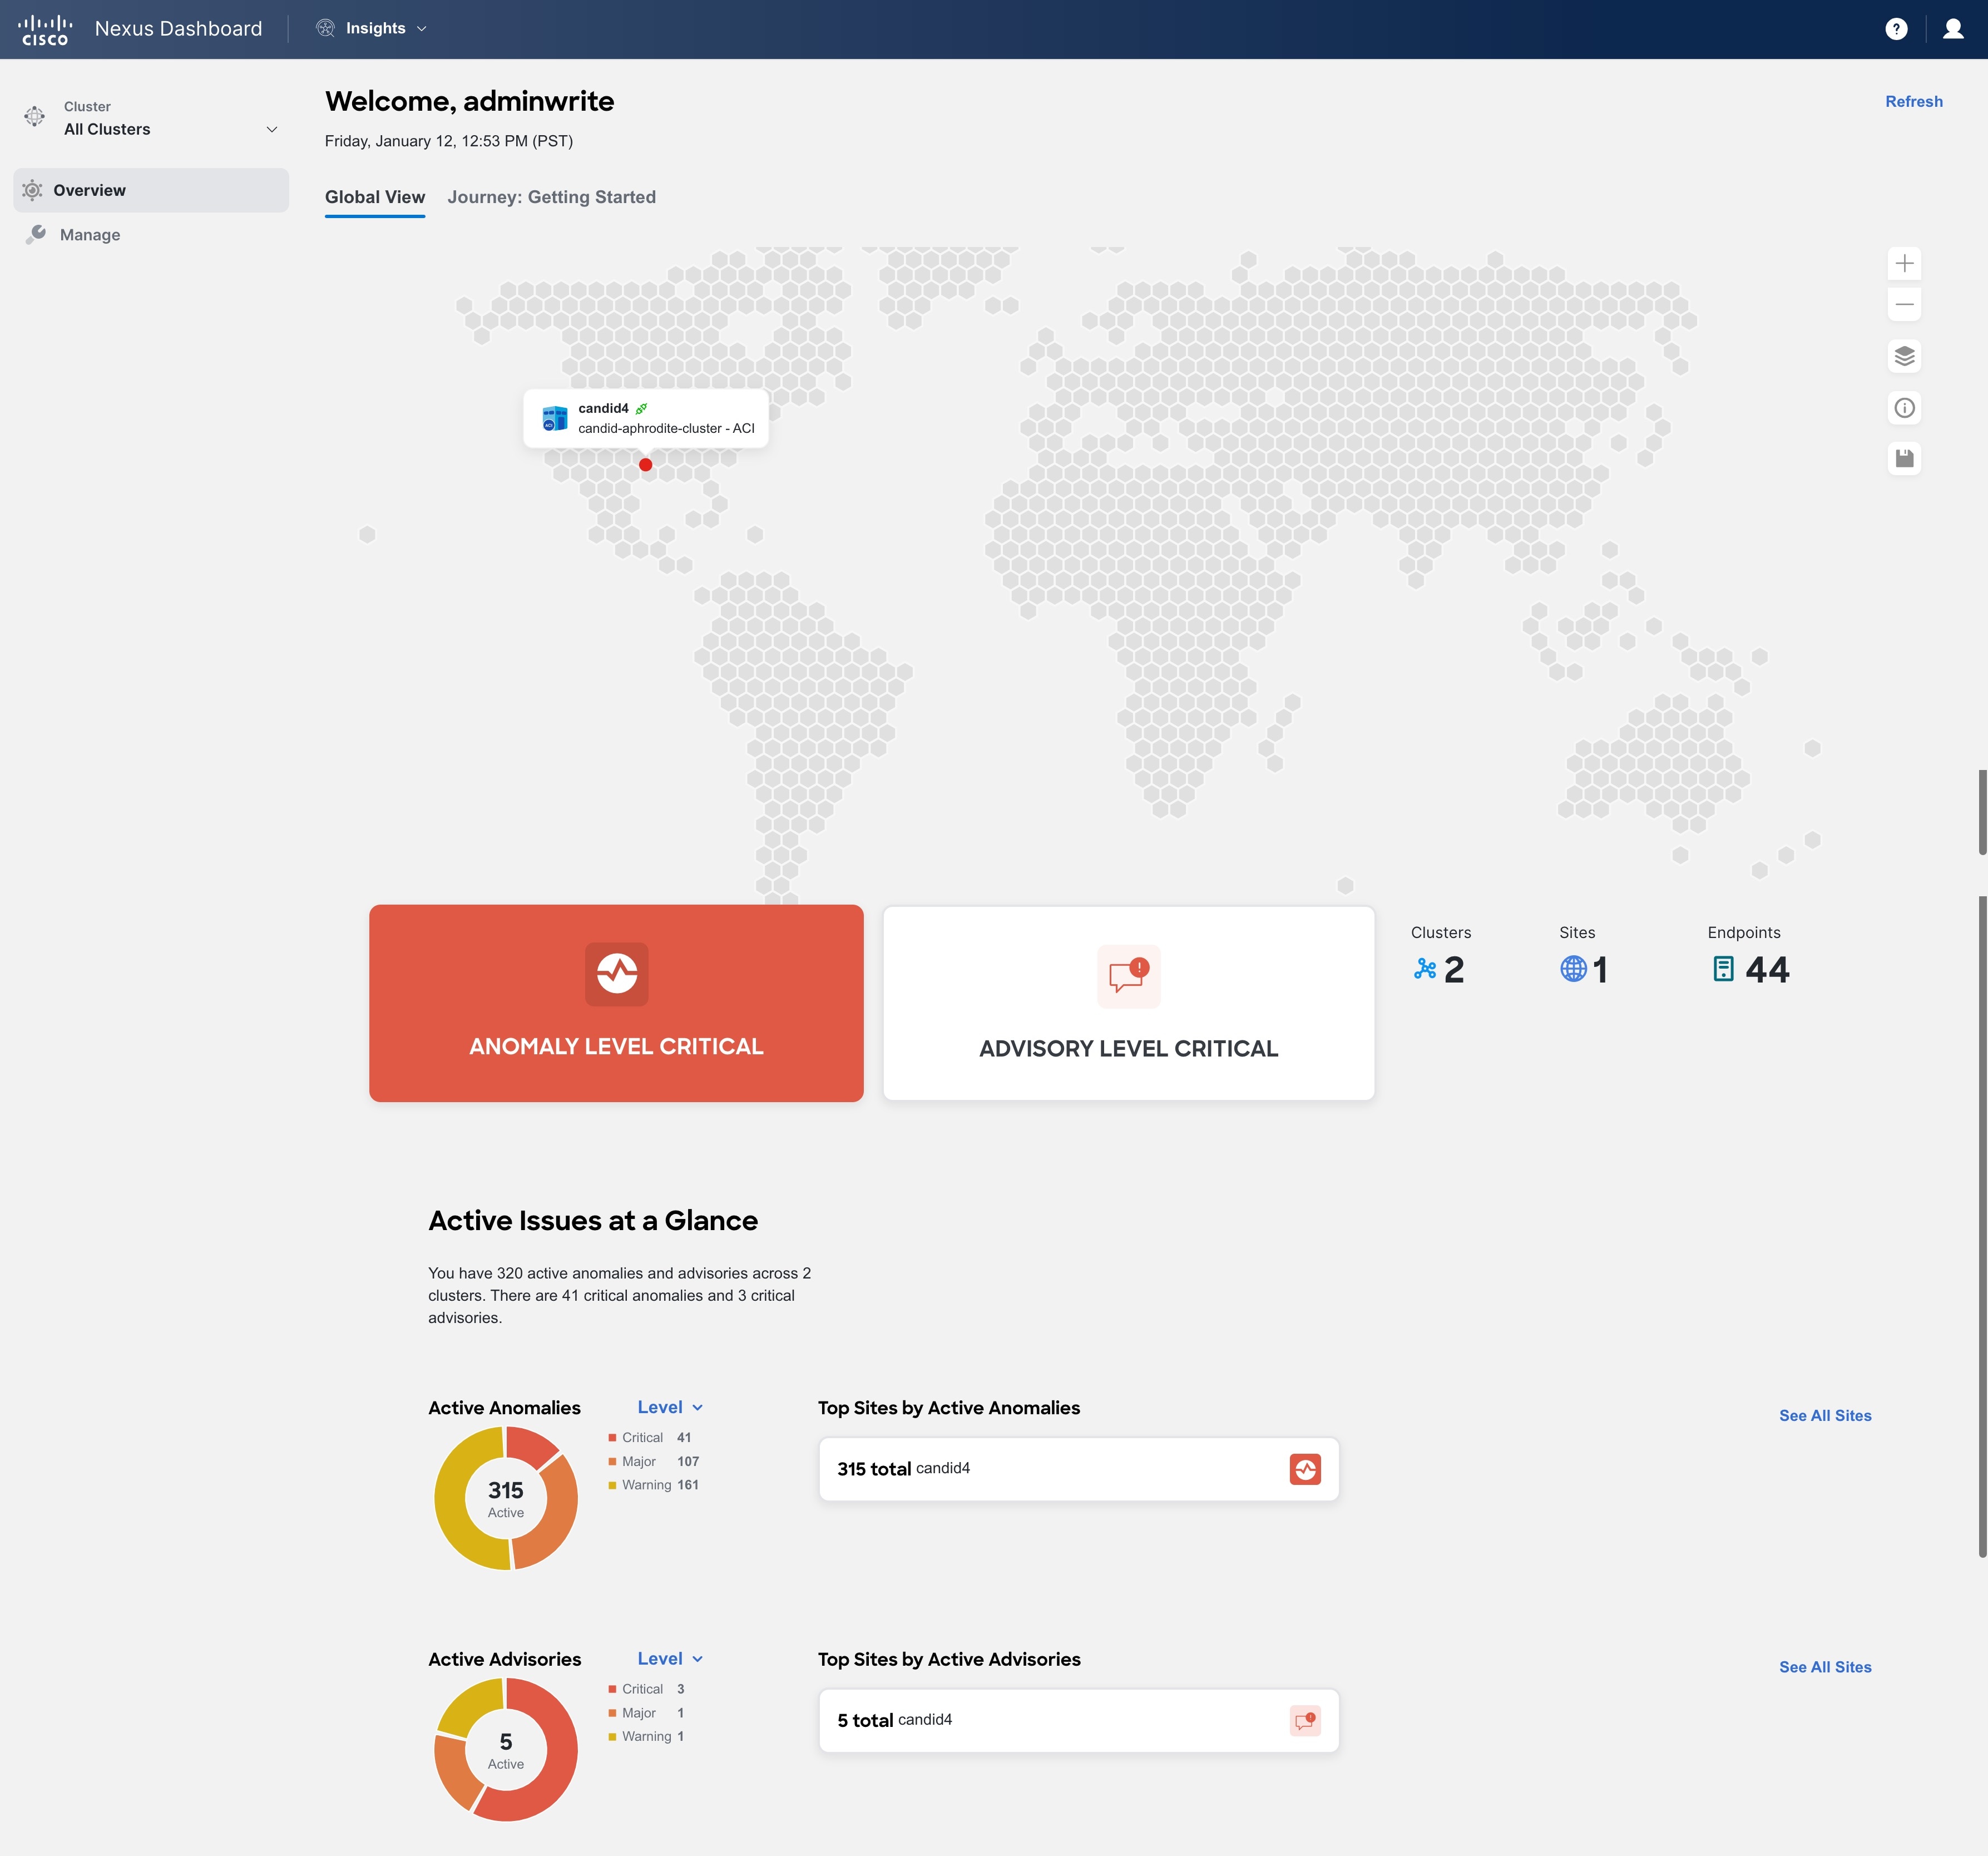
Navigate to Overview > Global View to access Global View. Nexus Dashboard Insights helps aggregate your most important details from site health to active issues and access it all by scrolling down.
The map visually shows the physical location, total number of your sites, and cluster name in each location. If only one site is present in any location, the name, and type of the site is displayed, however if there are multiple sites in a location, only the total number of sites is displayed. The list of sites in that particular location can be viewed by hovering over the number displayed. You can also use the the zoom control icons in the page to change your view of the map.
-
Click a site to view the summary details for that site in the cluster. You can also navigate to Manage > Sites to view all the sites in the cluster.
-
From the Actions menu, select View Details to view additional details overview, inventory, connectivity, anomalies, and advisories, and integrations. In this view you cannot perform any operations on the site.
-
Click View in Cluster to perform operations on a site such as Analyze now, Edit Site, Pause Data Collection. See Sites.
Anomaly Level Critical shows the aggregated number of anomalies across sites at the maximum level of severity at that time. You can click the card to view the anomalies across all the sites in the cluster. Click site name to view all the anomalies with different severities.
Advisory Level Critical shows the aggregated number of advisories across sites at the maximum level of severity at that time. You can click the card to view the advisories across all the sites in the cluster. Click site name to view all the advisories with different severities.
The Anomaly Level Critical and Advisory Level Critical is not available for snapshot sites.
Next to Advisory Level Critical, you can see the total number of clusters, sites, and endpoints.
Continue scrolling down in Global View to see more. The Active Issues at a Glance area displays the active anomalies and advisories across the clusters.
-
In the Active Anomalies area use the drop-down list to view the active anomalies per level or category. In the Top Sites by Active Anomalies click the site to view the anomalies for the selected site. Click See All Sites view the anomalies across all the sites in the cluster. Click site name to view all the anomalies with different severities.
-
In the Active Advisories area use the drop-down list to view the active advisories per level or category. In the Top Sites by Active Advisories click the site to view the anomalies for the selected site. Click See All Sites view the advisories across all the sites in the cluster. Click site name to view all the advisories with different severities.
You’re caught up! This concludes all we have in Global View. If you’d like to explore more, you can dive into the other sections of Nexus Dashboard Insights for details.
Guidelines and Limitations
-
The names of the sites onboarded in the clusters that you plan to connect together must be unique across those clusters.
-
If there are any duplicate site names, then you have to delete the site and create a new site with a different name in Nexus Dashboard.
-
Multi-Cluster connectivity is supported for remote users only.
-
Multi-cluster connectivity between a Nexus Dashboard cluster hosting Nexus Dashboard Insights service and a Nexus Dashboard cluster hosting NDFC service is not supported if at least one site managed by NDFC is also operated by Nexus Dashboard Insights.
-
Multi-Cluster Connectivity is supported on Nexus Dashboard Insights release 6.3.1.40 and later.
-
When you upgrade a cluster to Nexus Dashboard Insights release 6.4.1, Multi-Cluster Connectivity is not supported if any other cluster is runningNexus Dashboard Insights release 6.3.1.15. But Multi-Cluster Connectivity is supported if any other cluster is running Nexus Dashboard Insights release 6.3.1.40 and later.
-
Multi-Cluster connectivity scale limits:
-
Clusters connected via multi-cluster connectivity - 10
-
Sites across all clusters connected via multi-cluster connectivity - 20
-
Switches across all clusters connected via multi-cluster connectivity - 1500
-
Copyright
THE SPECIFICATIONS AND INFORMATION REGARDING THE PRODUCTS IN THIS MANUAL ARE SUBJECT TO CHANGE WITHOUT NOTICE. ALL STATEMENTS, INFORMATION, AND RECOMMENDATIONS IN THIS MANUAL ARE BELIEVED TO BE ACCURATE BUT ARE PRESENTED WITHOUT WARRANTY OF ANY KIND, EXPRESS OR IMPLIED. USERS MUST TAKE FULL RESPONSIBILITY FOR THEIR APPLICATION OF ANY PRODUCTS.
THE SOFTWARE LICENSE AND LIMITED WARRANTY FOR THE ACCOMPANYING PRODUCT ARE SET FORTH IN THE INFORMATION PACKET THAT SHIPPED WITH THE PRODUCT AND ARE INCORPORATED HEREIN BY THIS REFERENCE. IF YOU ARE UNABLE TO LOCATE THE SOFTWARE LICENSE OR LIMITED WARRANTY, CONTACT YOUR CISCO REPRESENTATIVE FOR A COPY.
The Cisco implementation of TCP header compression is an adaptation of a program developed by the University of California, Berkeley (UCB) as part of UCB’s public domain version of the UNIX operating system. All rights reserved. Copyright © 1981, Regents of the University of California.
NOTWITHSTANDING ANY OTHER WARRANTY HEREIN, ALL DOCUMENT FILES AND SOFTWARE OF THESE SUPPLIERS ARE PROVIDED “AS IS" WITH ALL FAULTS. CISCO AND THE ABOVE-NAMED SUPPLIERS DISCLAIM ALL WARRANTIES, EXPRESSED OR IMPLIED, INCLUDING, WITHOUT LIMITATION, THOSE OF MERCHANTABILITY, FITNESS FOR A PARTICULAR PURPOSE AND NONINFRINGEMENT OR ARISING FROM A COURSE OF DEALING, USAGE, OR TRADE PRACTICE.
IN NO EVENT SHALL CISCO OR ITS SUPPLIERS BE LIABLE FOR ANY INDIRECT, SPECIAL, CONSEQUENTIAL, OR INCIDENTAL DAMAGES, INCLUDING, WITHOUT LIMITATION, LOST PROFITS OR LOSS OR DAMAGE TO DATA ARISING OUT OF THE USE OR INABILITY TO USE THIS MANUAL, EVEN IF CISCO OR ITS SUPPLIERS HAVE BEEN ADVISED OF THE POSSIBILITY OF SUCH DAMAGES.
Any Internet Protocol (IP) addresses and phone numbers used in this document are not intended to be actual addresses and phone numbers. Any examples, command display output, network topology diagrams, and other figures included in the document are shown for illustrative purposes only. Any use of actual IP addresses or phone numbers in illustrative content is unintentional and coincidental.
The documentation set for this product strives to use bias-free language. For the purposes of this documentation set, bias-free is defined as language that does not imply discrimination based on age, disability, gender, racial identity, ethnic identity, sexual orientation, socioeconomic status, and intersectionality. Exceptions may be present in the documentation due to language that is hardcoded in the user interfaces of the product software, language used based on RFP documentation, or language that is used by a referenced third-party product.
Cisco and the Cisco logo are trademarks or registered trademarks of Cisco and/or its affiliates in the U.S. and other countries. To view a list of Cisco trademarks, go to this URL: http://www.cisco.com/go/trademarks. Third-party trademarks mentioned are the property of their respective owners. The use of the word partner does not imply a partnership relationship between Cisco and any other company. (1110R)
© 2017-2024 Cisco Systems, Inc. All rights reserved.