
First Published: 2024-03-07
Americas Headquarters
Cisco Systems, Inc.
170 West Tasman Drive
San Jose, CA 95134-1706
USA
http://www.cisco.com
Tel: 408 526-4000
800 553-NETS (6387)
Fax: 408 527-0883
New and Changed Information
The following table provides an overview of the significant changes up to the current release. The table does not provide an exhaustive list of all changes or the new features up to this release.
New Features and Changed Behavior in the Cisco Nexus Dashboard Insights
| Feature | Description | Release | Where Documented |
|---|---|---|---|
|
Navigation Update |
Inventory is now accessible from Manage > Inventory |
6.4.1 |
|
|
Support of LACP/PIM/IGMP/IGMP Snooping/OSPF protocols |
LACP, PIM, IGMP, IGMP-Snooping, BGP, and OSPF protocols are supported for switches. |
6.4.1 |
|
|
Real Time Visualization |
Real Time Visualization (RTEV) feature facilitates real-time event rendering within a user interface (UI) environment. |
6.4.1 |
This document is available from your Cisco Nexus Dashboard Insights GUI as well as online at www.cisco.com. For the latest version of this document, visit Cisco Nexus Dashboard Insights Documentation.
Inventory
About Inventory
Inventory provides information on controllers and switches in Nexus Dashboard Insights.
Click Manage > Inventory to access Inventory.
At the top of Inventory, choose whether you want to view the inventory from Online Sites or Snapshot Sites.
Click Controllers to see high-level information on the controllers. Click Switches to see high-level information on the switches.

If a switch or hostname is modified, it takes around 2 hours for the updated switch or hostname to be reflect in Inventory.
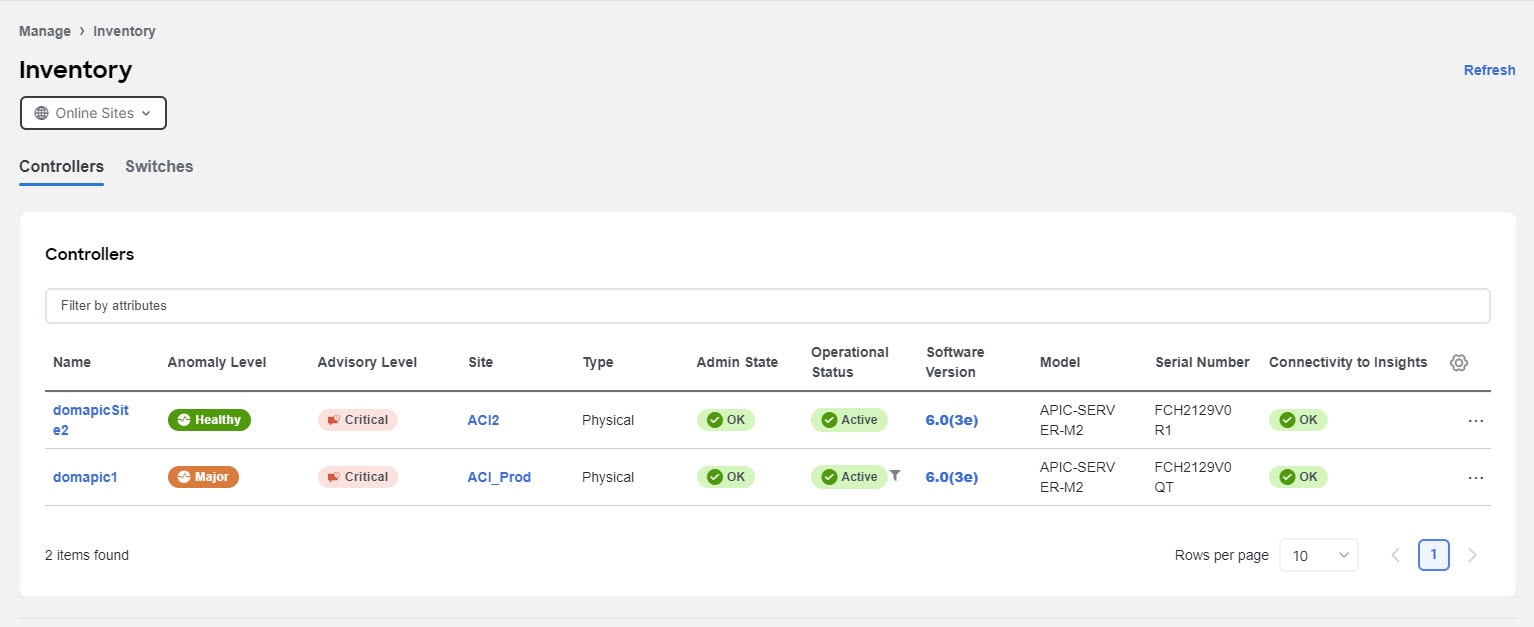
Controllers
About Controllers
Controllers provides the following high-level information on all of the controllers in Nexus Dashboard Insights. Click on the site name to be redirected to all the site details. See Sites for more information. The gear icon allows you to customize the table by hiding some of the columns. By default, all columns are visible. Use the ellipse icon to Launch APIC directly from the controllers page.
To get additional information on any single controller, click that controller under the Name column. The table can also be filtered based on the columns available.
Launch APIC is only available for online sites.
| Field | Description |
|---|---|
|
Name |
The name of each controller |
|
Anomaly Level |
The anomaly levels experienced by each controller |
|
Advisory Level |
The advisory levels experienced by each controller |
|
Site |
The site where each controller resides |
|
Type |
The type for each controller (physical or virtual) |
|
Admin State |
The administrative state for each controller to Nexus Dashboard Insights |
|
Operational Status |
The operational status for each controller to Nexus Dashboard Insights |
|
Software Version |
The version of the software on the controller |
|
Model |
The model type for each controller |
|
Serial Number |
The serial number for the specific switch |
|
Connectivity to Insights |
The connectivity of the switches |
Controller Details
You’ll see Overview, Anomalies and Advisories that will provide more information on the controller, with Overview shown first by default.
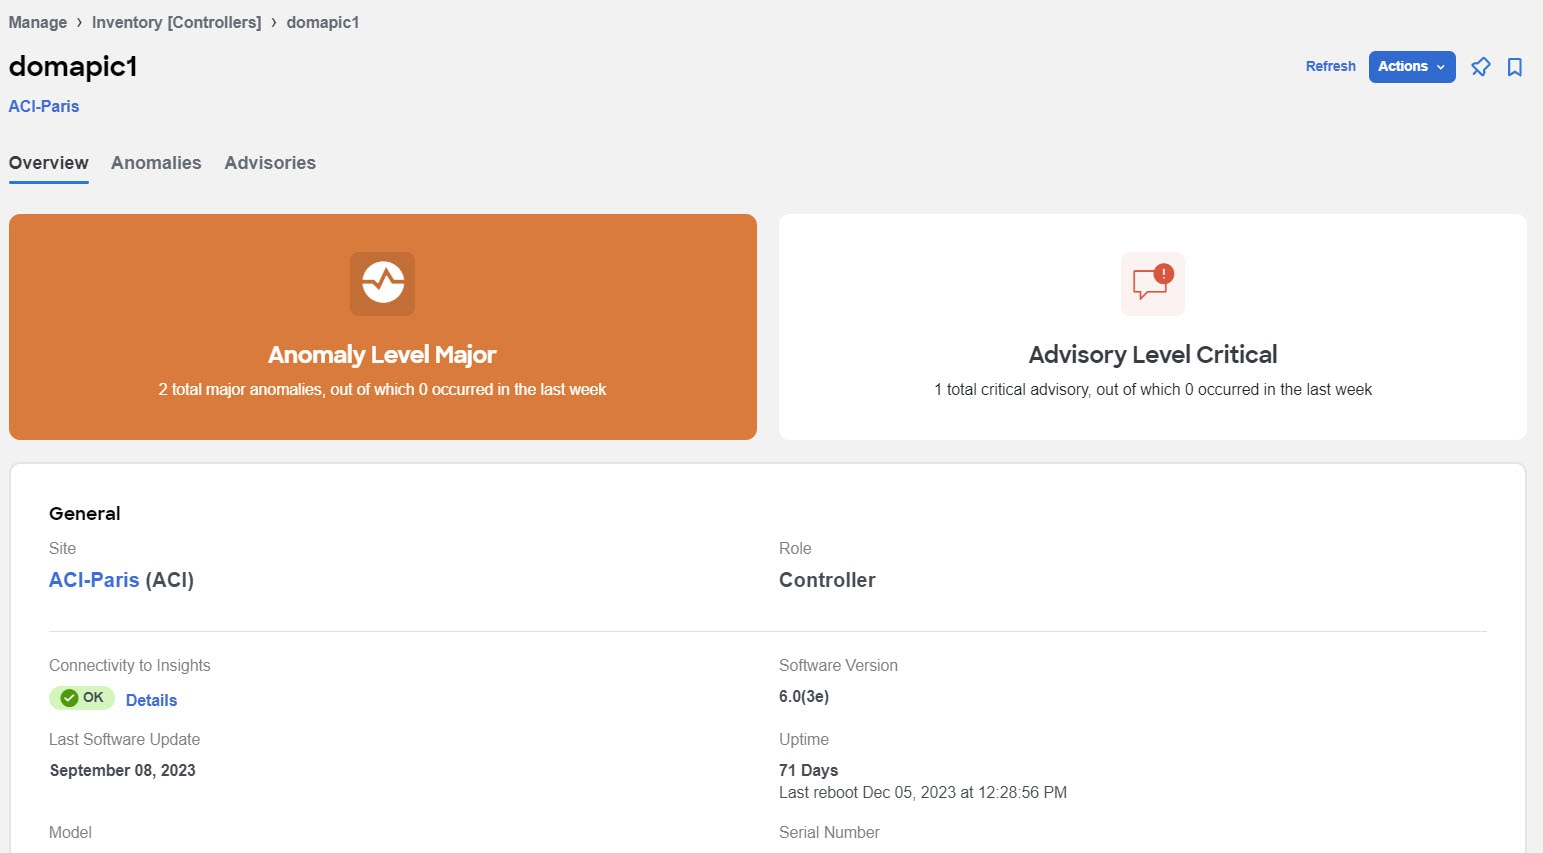
Overview
Overview has the following additional information.
-
Anomaly Level :
Click Anomaly Level to get more specific information on the anomalies present for this controller. A slide-in appears, showing all the anomalies that occurred for this controller. See Anomalies to understand how to navigate across the anomalies.
-
Advisory Level :
Hover over the Advisory Level to see what category the advisories belong to. Click Advisory Level to get more specific information on the advisories present for this controller. A slide-in appears, showing all the advisories that occurred for this controller. See Advisories to understand how to navigate across the advisories.
-
General :
General displays the following information:
Field Description Site
The site where each controller resides
Role
The role defines what the device is
Connectivity to Insights
This shows the connectivity of the controller.
Software Version
The version of the software on the controller
Last Software Update
The date when the software was last updated on this controller.
Uptime
The amount of time that this controller has been up. You will also see when the controller was last rebooted.
Model
The model type for each controller
Serial Number
The serial number for this controller.
Out-of-Band IPv4 Address
The IP address for the out-of-band management of this controller.
Out-of-Band IPv6 Address
The IP address for the out-of-band management of this controller.
In-Band IPv4 Address
The IP address for the in-band management of this controller.
In-Band IPv6 Address
The IP address for the in-band management of this controller.
Type
The type for each controller (physical or virtual)
Created At
The date when the controller was created.
Anomalies
The Anomaly level shows the total number of anomalies that have occurred and the number of anomalies that have occurred in the last week.
Hover over the Anomaly Level to view the category of the anomalies occurred. Click the Anomaly Level to get specific information on the anomalies present for the specific controller or switch.
See Anomalies to understand how to navigate across the anomalies.
Advisories
The Advisories displays several levels of advisory severity for controller hardware and software in your network. To see an overall advisories dashboard for this controller, click Advisories. An advisories dashboard appears for this controller.
See Advisories to understand how to navigate across the advisories. See Filtering Information for filter refinement using certain operators.
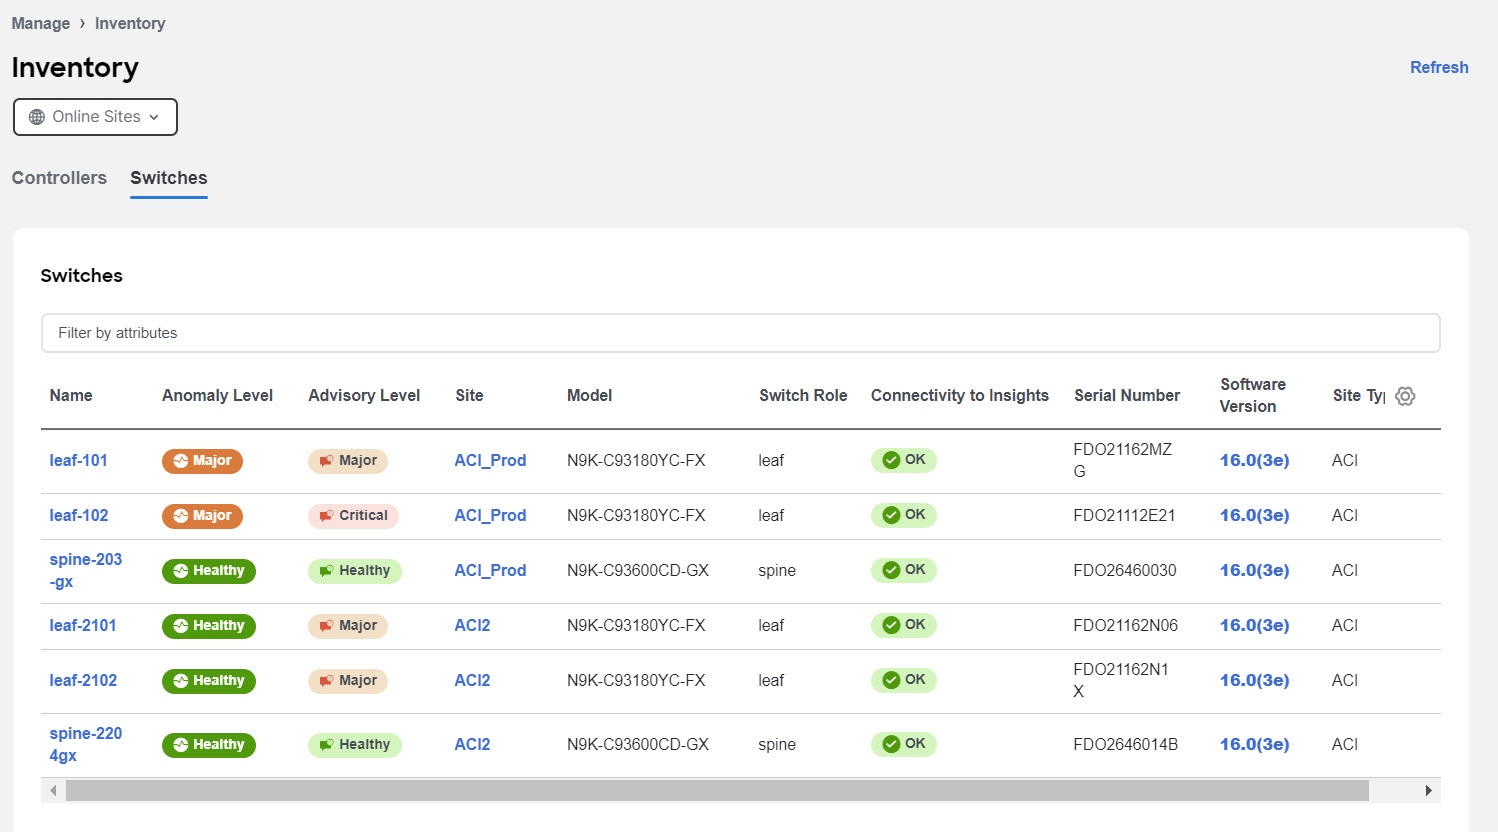
Switches
About Switches
Switches provides the following high-level information on the switches. The gear icon allows you to customize the table by hiding some of the columns. By default, all columns are visible. The table can also be filtered based on the columns available. Click on the site name to be redirected to all the site details. See Sites for more information.
To get additional information on any single switch, click that switch under the Name column.
| Field | Description |
|---|---|
|
Name |
The name of each switch |
|
Anomaly Level |
The anomaly levels experienced by each switch |
|
Advisory Level |
The advisory levels experienced by each switch |
|
Site |
The site where each switch resides |
|
Model |
The model type for each switch |
|
Switch Role |
Displays the role of switch. |
|
Connectivity to Insights |
The connectivity of the switches |
|
Serial Number |
The serial number for the specific switch |
|
Software Version |
The software version in which the switch is available |
|
Site Type |
Displays the type of switch:
|
Switch Details
You’ll see Overview, Connectivity, Anomalies, and Advisories that will provide more information on the switch, with Overview shown first by default.
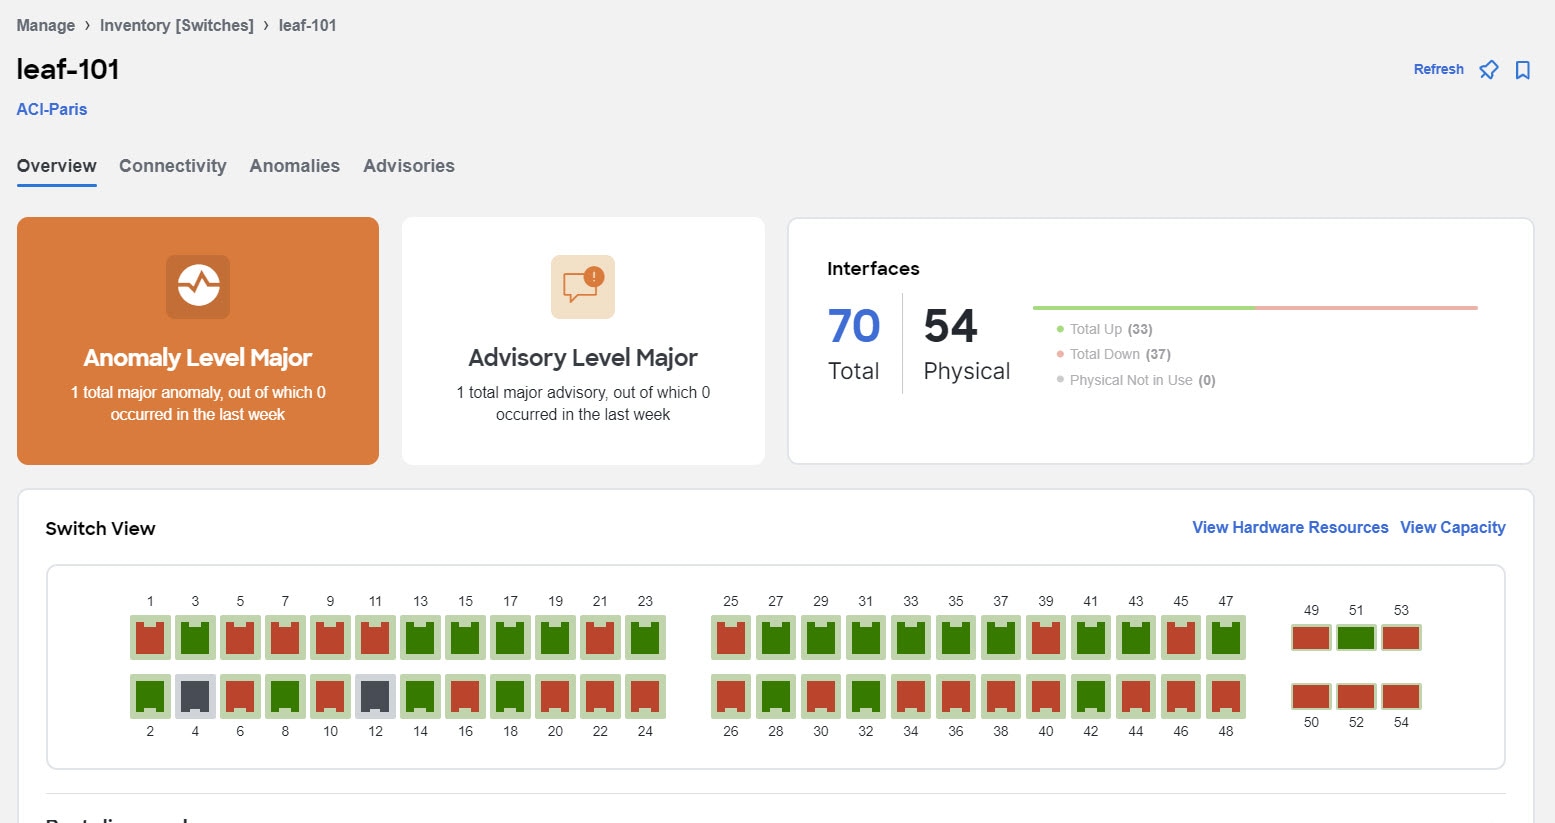
Overview
The Overview tab shown first by default when you view switch details. The following appear below Overview.
-
Anomaly Level :
Hover over the Anomaly Level to see what category the anomalies belong to. Click the Anomaly Level to get more specific information on the anomalies present for this controller. A slide-in appears, showing all the anomalies that occurred for this controller. See Anomalies to understand how to navigate across the anomalies.
-
Advisory Level :
Hover over the Advisory Level to see what category the advisories belong to. Click the Advisory Level to get more specific information on the advisories present for this switch. A slide-in appears, showing all the advisories that occurred for this switch. See Advisories to understand how to navigate across the advisories tab.
-
Interfaces :
Interfaces provides the following information:
-
The total number of interfaces in this switch
-
The number of physical interfaces
-
The overall status of the interfaces in the switch (the number of interfaces that are up, down, or physical not in use)
Click on the number above the Total text to get additional information on the interfaces in this switch.
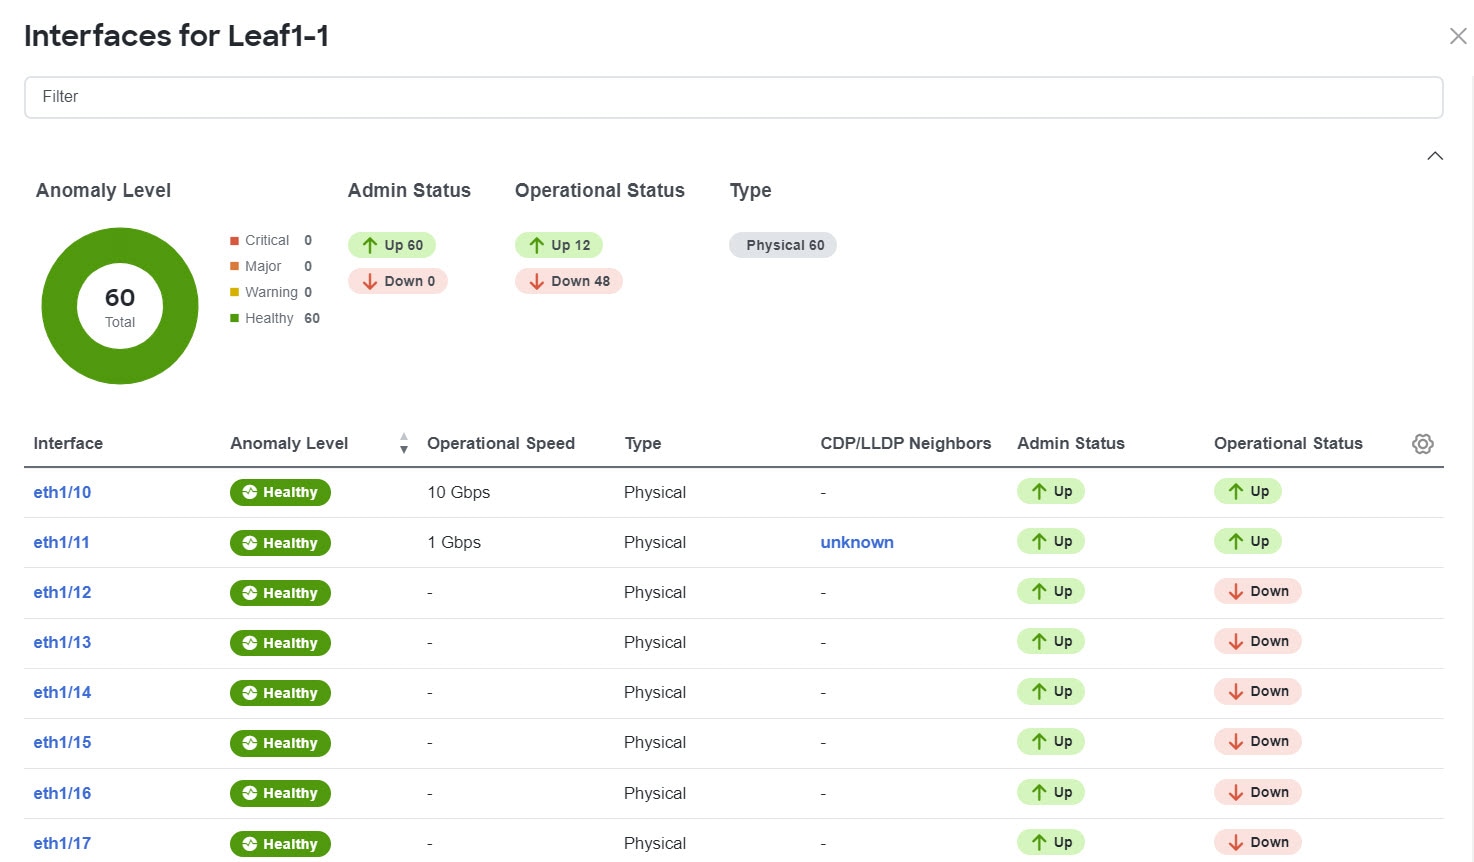
You can filter the list of interfaces based on Anomaly Level, Interface, Type, Operational status and Admin status. Click on a specific interface listed under the Interface column to get additional information on that particular interface. See Interfaces for more information.
-
-
Switch View :
Within the Switch View, you can see the status of the interfaces, where the state could be Up (green),Down (red), or Not in Use (gray).
If the switch has multiple modules installed, you can switch the views between the different modules. Click View All to see the switch view for all modules installed.
Real Time Visualization (RTEV) feature facilitates real-time event rendering within a user interface (UI) environment. This feature allows for the smooth integration of real-time events directly into the UI, ultimately enhancing the user experience and delivering the most up-to-date information in real-time. RTEV supported features provide the current data in 1 minute when the change happens which otherwise takes 5 minutes to get updated via the regular pipeline.
Real-time values are shown to the right of the vertical bar. Historical values (past 2 hours) are shown to the left of the bar and may have larger gaps between data points.
Controller events are not real time and RTEV is limited to switches only. Only 10 sessions per pod can have real-time data for physical and virtual deployment profiles. If there are more than 10 sessions then the data will be sent via regular pipeline. All other deployment profiles support 20 sessions.
Click these links in the Switch View to get additional information:
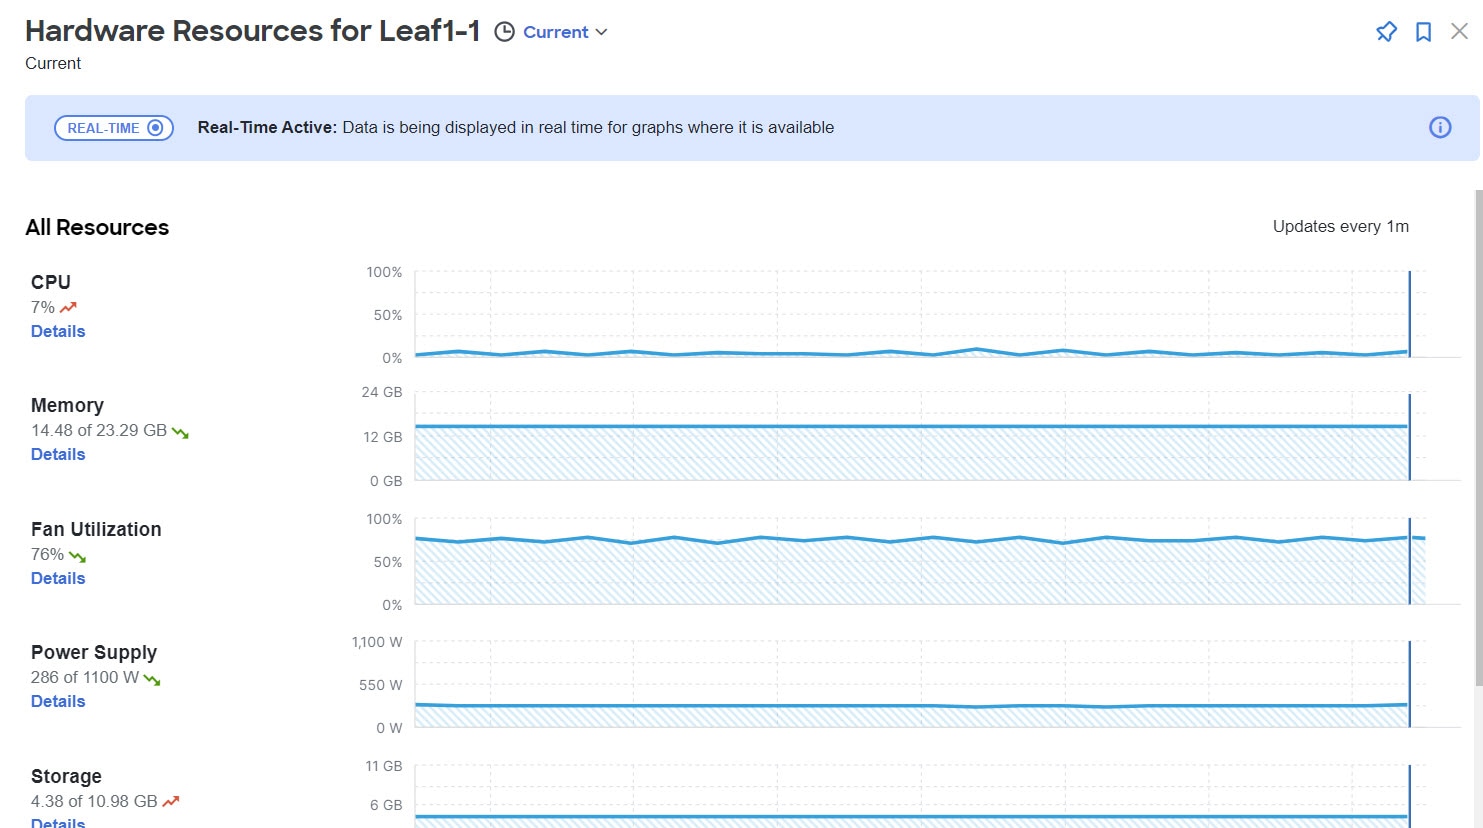
View Hardware Resources -
Click View Hardware Resources to view a slide-in which appears with information on the hardware resources for this switch in real time. Real Time Visualization helps view up to date information about the resources. Hardware resources shows the variations in the hardware resources over the time range selected. The hardware resources displayed with the percentage utilized per component are CPU, Fan Utilization, Memory, Power Supply, Storage, and Temperature. Click any resource to view further details about it.
For hardware resources all parameters are updated in real-time based on the cadence from the switch when it sends the data.
View Capacity -
Click View Capacity to view the capacity information for the switch. Capacity details shows the variations in operational, configuration and interface resources over the time range selected.
| Type of Resource | List of resources |
|---|---|
|
Operational Resources |
|
|
Configuration Resources |
|
|
Interface Resources |
|
The port diagram key helps understand the switch view. Click any interface in the switch view to get more details about the interface. See Interfaces for more information.
-
General :
General provides the following information :
| Field | Description |
|---|---|
|
Site |
The site where each switch resides |
|
Role |
The role defines what the device is |
|
Type |
The type defines the type of switch |
|
Connectivity to Insights |
Connectivity status for switch |
|
Telemetry Collection Status |
Telemetry collection status provides insights into the health and performance of the switches and devices in your network. The different telemetry collection statuses at the site level include:
|
|
Software Version |
The version of the software on the switch |
|
Last Software Update |
The date when the software was last updated on this switch |
|
Uptime |
The amount of time that this switch has been up. You will also see when the switch was last rebooted |
|
Model |
The model type for this switch |
|
Serial Number |
The serial number for this switch |
|
Out-of-Band IPv4 Address |
The IPv4 address for the out-of-band management of this switch |
|
Out-of-Band IPv6 Address |
The IPv6 address for the out-of-band management of this switch |
|
In-Band IPv4 Address |
The IPv4 address for the in-band management of this switch |
|
Switch ID |
The ID of the switch |
|
Created At |
The date and time the switch was created |
-
Connectivity :
Connectivity provides the following information:
| Field | Description |
|---|---|
|
Endpoints |
The number of endpoints associated with this switch |
|
L3 Neighbors |
The number of Layer 3 neighbors associated with this switch |
Click on the number shown in either of these areas to get additional information on the endpoints or the Layer 3 neighbors.
Connectivity
Click Connectivity to view connectivity information for this switch. The following appear below Connectivity, with Interfaces shown first by default.
Click any of these to view additional connectivity information for this switch:
-
Interfaces :
Click Interfaces to view the Interfaces for this switch. The following information is available in Interfaces:
-
Anomaly level (Only interface down anomaly is in Realtime)
-
Admin Status (Real time visualization)
-
Operational status (Real time visualization)
-
Type
The Interfaces are listed in a tabular form with the following data available:
-
Anomaly level
-
Operational speed
-
Type
-
CDP/LLDP
-
Admin Status
-
Operational Status
There are various other columns that are optional and can be added to the table by clicking on the gear icon using the toggle to show or hide. See Interfaces for more information.
-
-
L3 Neighbors :
Click L3 Neighbors to view L3 Neighbors for this switch. You can filter the results based on Neighbor, Local Switch, routing protocol, VRF, and Operational Status. BGP and OSPF protocols can now be viewed in real time. The switch will report the interface logical neighbor event immediately upon modification or change or properties. OSPF support includes OSPF statistics, operational statistics, interface statistics, and neighbor statistics. Click the IP address in the Neighbor column to view details on this neighbor.
-
Endpoints
Click Endpoints to view the Endpoints for this switch. You can filter the results based on Anomaly Level, MAC Address, IP Addresses, Hostname, Connected To, Interface, Time, Status, Tenant, VRF, BD, EPG/l3out, Search Deleted IPs, VM Name, and Hypervisor.
Click a MAC address in the MAC column to get additional information on that endpoint. You can view Overview, Endpoint History and Anomalies for the selected endpoint.
You can also click the IP address or the hostname (if clickable) to view additional information about them.
-
vPC Domains :
Click vPC Domains to view the vPC Domain for this switch. You can filter the results based on Domain ID.
The table lists the domain ID, the primary switch, the secondary switch and the number of vPCs up and down. Click a domain in the Domain ID column to view vPC domain details on that domain.
-
Multicast :
The Multicast card lists the IGMP, IGMP snooping and the PIM details for the switch. The Instances table shows the following information:
Protocol Type Fields for Instances Table IGMP DETAILS
-
Interface
-
Admin State
-
Operational Status
-
Tenant
-
VRF
-
IP Address
-
Querier Address
-
Membership Count
-
Querier Version
-
Errors
-
View Stats
IGMP SNOOPING DETAILS
-
Tenant
-
VRF
-
BD
-
Admin State
-
Querier Version
-
Multicast Routing State
-
Site Querier State
-
Errors
-
View Stats
PIM DOMAINS DETAILS
-
Tenant
-
VRF
-
Admin State
-
Border Leaf Node
-
Rendezvous Point Addresses
-
-
Multicast Routes :
Click Multicast Routes to view the Multicast PIM Groups for this switch. You can filter the information by Source, Multicast Group, Tenant, VRF, Incoming Interface, Outgoing Interface, RPF Neighbor, RPF Source, and Flags.
Interfaces
Supported Interface Types (Real time visualization)
-
Physical Interface: To view the interface details of the node such as, node name, physical interface name, operational status, and admin state. The page also displays protocols, QoS, and DOM properties of the physical interface.
-
Port Channel Interface: The port channel is an aggregate of physical interfaces and they can be statistically channeled or can be dynamic using LACP protocols. The statistical data that collects the counters for packets, bytes and various errors are similar to that of physical interface. The 150 sourcename differentiates the physical interface from port-channel (aggregated interfaces). The operational data is obtained by looking at an additional set of objects that gives the admin-status, oper-status and list of member interfaces for both PC and vPC.
-
vPC Interface: The vPC is a logical interface that spans across two physical switches for fault tolerance. For a vPC interface type, the Logical Neighbors information is also displayed. The categories that are supported are L3Out, IPN, ISN, L4-L7.
-
SVI Interface: An SVI is a virtual routed interface that connects a VLAN on the device to the Layer 3 router engine on the same device. Specific information such as Member Interfaces over which the SVI is deployed, VLAN ID, VLAN Type, Encap VLAN are displayed for the SVI interface.
Click an interface to view more details about it.
Overview
The Anomaly level is available at the top. The fields for overview change depending on the type of interface supported.
-
INTERFACE TYPE : PHYSICAL
Section General
-
Interface
-
Type (Host Port, Fabric Port, L3 Port)
-
Operational Speed
-
IP Address
-
Admin Status
-
Operational Status
-
CDP/LLDP neighbors
-
Total Endpoints
-
SFP Diagnostics (You can click on 'View SFP Diagnostics' to view further details)
If LLDP is disabled, the tag will show 'LLDP disabled', otherwise it will show the count. This is applicable for CDP neighbors as well.
EPGSs with Active Endpoints (This is available for Host Ports)
-
Tenant name
-
Endpoints in EPG
-
EPG Name
-
Mapped Domains
-
VLAN
L3 Neighbors (This is available for L3 Ports with SVI)
In this area, details are displayed such as IP, Operational Status, Routing Protocol, and Type.
-
-
INTERFACE TYPE : PORT CHANNEL
Section General
-
Interface
-
Description
-
Type (Host Port, L3 Port)
-
Aggregation Type
-
Bandwidth
-
IP Address
-
Admin Status
-
Operational Status
-
CDP/LLDP neighbors (Real time visualization)
-
Total Endpoints
-
SFP Transceiver (You can click on 'View SFP Diagnostics' to view further details)
If LLDP is disabled, the tag will show 'LLDP disabled', otherwise it will show the count. This is applicable for CDP neighbors as well.
LACP Details
-
Interface
-
Admin Status
-
Operational Status
-
LACP Packets received
-
LACP Packets transmitted
-
Errors
EPGSs with Active Endpoints (This is available for Host Ports)
-
Tenant name
-
Endpoints in EPG
-
EPG Name
-
Mapped Domains
-
VLAN
Associated L3 Out (For L3 Port)
-
L3 Out Name
-
Switch
-
Port
-
Routing protocol
-
External EPGs
SFP Diagnostics (DOM)
-
Lane
-
Voltage
-
Temperature
-
Current
-
Transmit Power Value
-
Receive Power Value
An interface must be active for you to be able to view the neighbor details.
Configured 'IP Unnumbered' will show as “unassigned” in IP address field.
-
-
INTERFACE TYPE : vPC
Section General
-
Interface
-
Description
-
Type (vPC)
-
vPC Domain
-
Aggregation Type
-
Bandwidth
-
IP Address
-
Admin Status
-
Operational Status
-
CDP/LLDP neighbors (Real time visualization)
-
Total Endpoints
-
SFP Transceiver (You can click on 'View SFP Diagnostics' to view further details)
If LLDP is disabled, the tag will show 'LLDP disabled', otherwise it will show the count. This is applicable for CDP neighbors as well.
Members
-
Switch
-
Port Channel
-
Aggregation Type
-
Interface
-
Operational Status
EPGSs with Active Endpoints (This is available for Host Ports)
-
Tenant name
-
Endpoints in EPG
-
EPG Name
-
Mapped Domains
-
VLAN
SFP Diagnostics (DOM)
-
Lane
-
Voltage
-
Temperature
-
Current
-
Transmit Power Value
-
Receive Power Value
-
-
INTERFACE TYPE : SVI
Section General
-
Interface
-
Description
-
Type
-
Encap
-
Admin Status
-
Operational Status
-
SFP Transceiver (You can click on 'View SFP Diagnostics' to view further details)
Associated L3 Out (For L3 Port)
-
L3 Out Name
-
Switch
-
Port
-
Routing protocol
-
External EPGs
L3 Logical Neighbors (For L3 ports with SVI)
-
IP
-
Operational State
-
Routing Protocol
-
Switch
-
Interface
-
Type
-
Multicast
Click Multicast to view details for multicast routes on this interface.
| Field | |
|---|---|
|
General |
|
|
Multicast Groups |
|
For any interface, you can choose to view either the IGMP details or the PIM details.
IGMP DETAILS -
-
General Information
-
Fast-leave
-
Allow V3 ASM
-
Report Link-local Groups
-
-
Statistics
-
V2 Leave Received
-
V2 Leave Sent
-
V2 Query Received
-
V2 Query Sent
-
V2 Report Received
-
V2 Report Sent
-
V3 Query Received
-
V3 Query Sent
-
V3 Report Received
-
V3 Report Sent
-
PIM DETAILS -
-
Neighbor Details
-
Neighbor
-
BFD Config
-
Bi-Dir Config
-
-
Statistics
-
Authentication failed
-
Bad Version Packet
-
Checksum Errors
-
Invalid Packet Received
-
Invalid Packet Sent
-
Join No RP
-
Join Wrong RP
-
Packet from Self
-
Packet Length Error
-
Packet on Passive Interface
-
Trends and Statistics
Click Trends and Statistics to view trends and statistics information on this specific interface in this switch. You see information about the admin and operational status, traffic that is flowing over the interface, the bandwidth and various statistics for congestion and errors. All of the information is now available in real time. Real Time Visualization helps view up-to-date information.
-
Admin Status (Real time visualization)
-
Operational Status (Real time visualization)
-
Errors
-
Traffic (by bytes or by packets) (Real time visualization)
-
Flood
-
Multicast
-
Unicast
-
Total
-
-
Bandwidth
-
Utilization
-
Rate
-
-
Microbursts
QoS
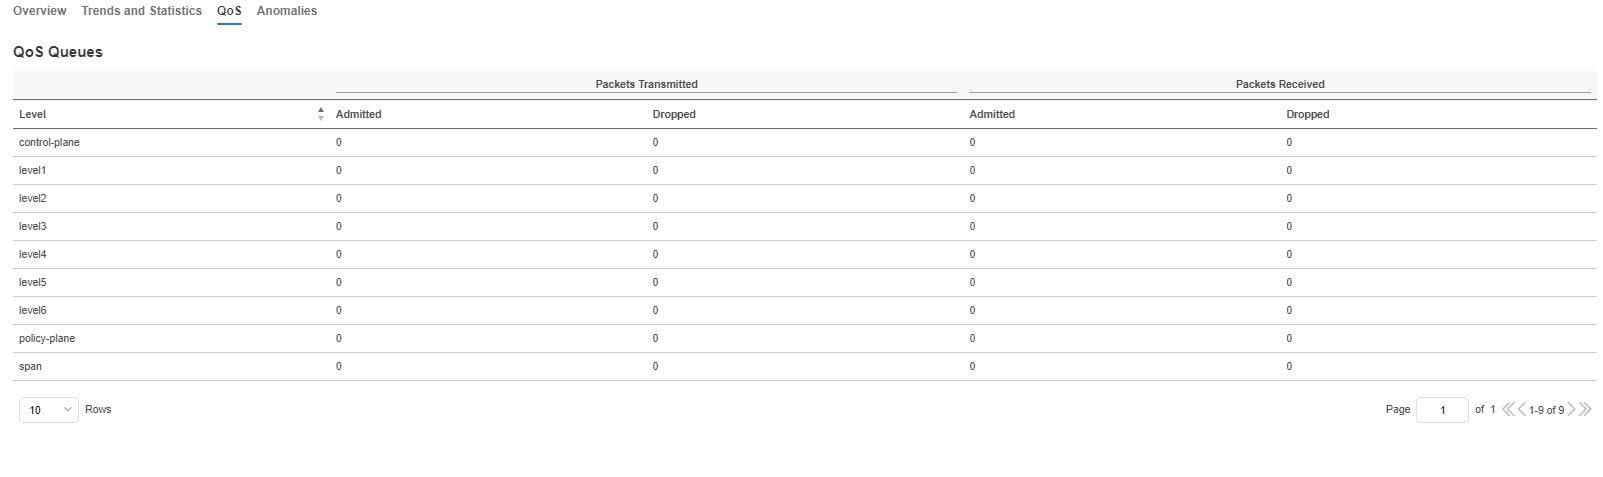
Quality of Service (QoS) in networking is a process that controls traffic to adjust the overall network traffic based on the requirements of specific applications.
Anomalies
Click to view anomaly information on this specific interface in this switch. See Anomalies for more information.
The Anomaly level shows the total number of anomalies that have occurred and the number of anomalies that have occurred in the last week.
Hover over the Anomaly Level to view the category of the anomalies occurred. Click the Anomaly Level to get specific information on the anomalies present for the specific controller or switch.
The View all anomalies takes you to the Anomalies tab. See Anomalies to understand how to navigate across the anomalies.
Microbursts
Microbursts
Click Switches > Any switch > Connectivity > Interfaces > Any interface > Trends and Statistics to view Microbursts in Inventory.
A burst of traffic impacts the output buffer of a physical interface port given the channel is already subscribed with line-rate flows. These bursts are often hard to detect with just given queuing parameters, such as buffer cells used and buffer cells unused as there is a high variance of usage of these buffers.
The Cisco Nexus 9000 series switches provide a capability of detecting this by issuing an interrupt that is triggered when a queue occupancy rises above x bytes and falls below y bytes. You can configure up to 8 output queues per physical interface port.
To configure Microburst in Nexus Dashboard Insights, navigate to Admin > System Settings > Microburst.
See the Microburst section in Getting Started to view more details.
You can view the microbursts details such as Queue, Start Time, Number of Bursts, Max Duration, Avg. Duration, Max Peak, and Avg Peak in the Microbursts section. A chart view and a tabular view is available.
Anomalies are raised in Nexus Dashboard Insights based on the number of microbursts at the interface level. Microburst anomaly jobs run every 5 minutes in a container environment, which checks for microburst records in microburst database. If the number of microbursts per interface is greater than microburst count threshold at any given point of time, then a minor anomaly is raised per interface in a node.
Nexus Dashboard Insights raises these anomalies:
-
The flows that are displayed in the summary table are gathered from Flow Telemetry data for a corresponding egress interface. Nexus Dashboard Insights matches the egress interface and egress queue to gather the corresponding microburst.
-
Based on the percentage of threshold, microburst is either low, high, or medium. The percentage of threshold is inverse to sensitivity. When the number of microbursts are greater than 100 on a particular interface, an anomaly is raised.
-
If flow telemetry is enabled and microburst is also enabled, then Nexus Dashboard Insights displays the estimated impact of flows for a particular microburst anomaly.
-
If the flow telemetry is disabled and microburst anomaly is enabled, then Nexus Dashboard Insights displays no Estimated Impact for that anomaly.
-
Flows that are contributing or impacted by microburst.
Filtering Information
In some cases, you might be able to filter results to find information more easily.
For example, you might have a situation where there a large number of endpoints under a single leaf switch, but you are only interested in endpoints that have a certain VLAN value.
You could filter the information to show only those specific endpoints in this situation.
Use the following operators for the filter refinement:
| Operator | Description |
|---|---|
|
== |
With the initial filter type, this operator, and a subsequent value, returns an exact match. |
|
!= |
With the initial filter type, this operator, and a subsequent value, returns all that do not have the same value. |
|
contains |
With the initial filter type, this operator, and a subsequent value, returns all that contain the value. |
|
!contains |
With the initial filter type, this operator, and a subsequent value, returns all that do not contain the value. |
|
< |
With the initial filter type, this operator, and a subsequent value, returns a match less than the value. |
|
< = |
With the initial filter type, this operator, and a subsequent value, returns a match less than or equal to the value. |
|
> |
With the initial filter type, this operator, and a subsequent value, returns a match greater than the value. |
|
> = |
With the initial filter type, this operator, and a subsequent value, returns a match greater than or equal to the value. |
Copyright
THE SPECIFICATIONS AND INFORMATION REGARDING THE PRODUCTS IN THIS MANUAL ARE SUBJECT TO CHANGE WITHOUT NOTICE. ALL STATEMENTS, INFORMATION, AND RECOMMENDATIONS IN THIS MANUAL ARE BELIEVED TO BE ACCURATE BUT ARE PRESENTED WITHOUT WARRANTY OF ANY KIND, EXPRESS OR IMPLIED. USERS MUST TAKE FULL RESPONSIBILITY FOR THEIR APPLICATION OF ANY PRODUCTS.
THE SOFTWARE LICENSE AND LIMITED WARRANTY FOR THE ACCOMPANYING PRODUCT ARE SET FORTH IN THE INFORMATION PACKET THAT SHIPPED WITH THE PRODUCT AND ARE INCORPORATED HEREIN BY THIS REFERENCE. IF YOU ARE UNABLE TO LOCATE THE SOFTWARE LICENSE OR LIMITED WARRANTY, CONTACT YOUR CISCO REPRESENTATIVE FOR A COPY.
The Cisco implementation of TCP header compression is an adaptation of a program developed by the University of California, Berkeley (UCB) as part of UCB’s public domain version of the UNIX operating system. All rights reserved. Copyright © 1981, Regents of the University of California.
NOTWITHSTANDING ANY OTHER WARRANTY HEREIN, ALL DOCUMENT FILES AND SOFTWARE OF THESE SUPPLIERS ARE PROVIDED “AS IS" WITH ALL FAULTS. CISCO AND THE ABOVE-NAMED SUPPLIERS DISCLAIM ALL WARRANTIES, EXPRESSED OR IMPLIED, INCLUDING, WITHOUT LIMITATION, THOSE OF MERCHANTABILITY, FITNESS FOR A PARTICULAR PURPOSE AND NONINFRINGEMENT OR ARISING FROM A COURSE OF DEALING, USAGE, OR TRADE PRACTICE.
IN NO EVENT SHALL CISCO OR ITS SUPPLIERS BE LIABLE FOR ANY INDIRECT, SPECIAL, CONSEQUENTIAL, OR INCIDENTAL DAMAGES, INCLUDING, WITHOUT LIMITATION, LOST PROFITS OR LOSS OR DAMAGE TO DATA ARISING OUT OF THE USE OR INABILITY TO USE THIS MANUAL, EVEN IF CISCO OR ITS SUPPLIERS HAVE BEEN ADVISED OF THE POSSIBILITY OF SUCH DAMAGES.
Any Internet Protocol (IP) addresses and phone numbers used in this document are not intended to be actual addresses and phone numbers. Any examples, command display output, network topology diagrams, and other figures included in the document are shown for illustrative purposes only. Any use of actual IP addresses or phone numbers in illustrative content is unintentional and coincidental.
The documentation set for this product strives to use bias-free language. For the purposes of this documentation set, bias-free is defined as language that does not imply discrimination based on age, disability, gender, racial identity, ethnic identity, sexual orientation, socioeconomic status, and intersectionality. Exceptions may be present in the documentation due to language that is hardcoded in the user interfaces of the product software, language used based on RFP documentation, or language that is used by a referenced third-party product.
Cisco and the Cisco logo are trademarks or registered trademarks of Cisco and/or its affiliates in the U.S. and other countries. To view a list of Cisco trademarks, go to this URL: http://www.cisco.com/go/trademarks. Third-party trademarks mentioned are the property of their respective owners. The use of the word partner does not imply a partnership relationship between Cisco and any other company. (1110R)
© 2017-2024 Cisco Systems, Inc. All rights reserved.