
First Published: 2024-02-16
Americas Headquarters
Cisco Systems, Inc.
170 West Tasman Drive
San Jose, CA 95134-1706
USA
http://www.cisco.com
Tel: 408 526-4000
800 553-NETS (6387)
Fax: 408 527-0883
New and Changed Information
The following table provides an overview of the significant changes up to the current release. The table does not provide an exhaustive list of all changes or the new features up to this release.
| Feature | Description | Release | Where Documented |
|---|---|---|---|
|
There were no major changes from the previous release. |
- |
6.4.1 |
- |
This document is available from your Cisco Nexus Dashboard Insights GUI as well as online at www.cisco.com. For the latest version of this document, visit Cisco Nexus Dashboard Insights Documentation.
Anomalies
Anomalies
Nexus Dashboard Insights proactively detects different types of anomalies across the network, analyzes the anomalies, and identifies remediation methods.
Nexus Dashboard Insights monitors different sets of data from all nodes in the fabric and baselines the data to identify “normal” behavior. Any deviation is represented as an anomaly. Your time is better spent in resolving the issue instead of tracking the issue. Additionally, it can estimate the impact of the anomaly and generate a recommendation depending on the nature of the anomaly and thus reducing the Mean Time to Troubleshooting and Resolution (MTTR).
Anomalies allow you to:
-
Shorten the mean time to resolution for troubleshooting.
-
Increase operational efficiency and network availability with proactive monitoring.
-
Remediate
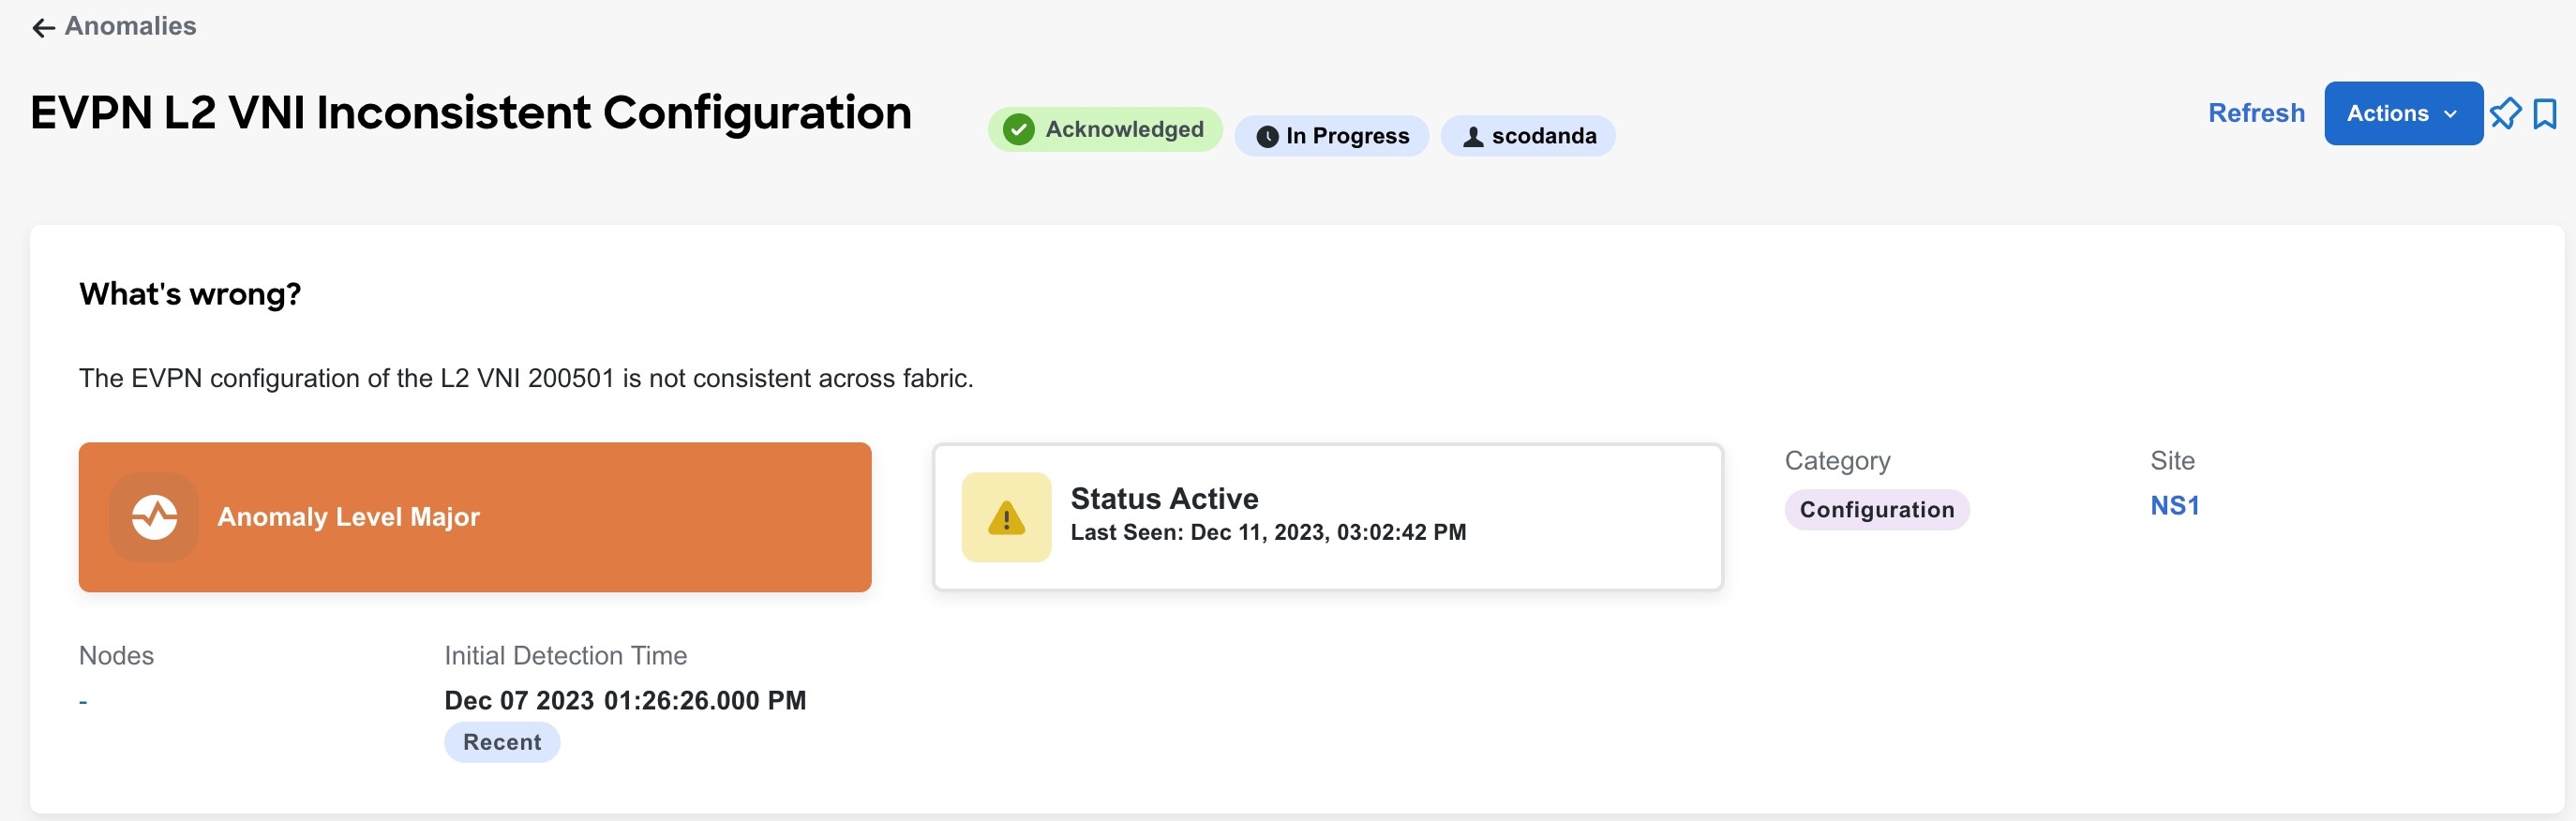
The Anomalies displays the anomalies by Level and Category for a particular site based on the selected time range.
Click a particular anomaly to view Information such as What’s wrong, What’s the impact, and How do I fix it.
Anomalies are classified into 3 Levels: Critical, Major, and Warning.
-
Critical: Anomalies are shown as critical when the network is down. Some of the examples include:
-
When connectivity to a given prefix or endpoint is lost
-
When a site or switch is not operational.
-
-
Major: Anomalies are shown as major when connectivity to a given prefix or endpoint could be compromised. Some of the examples include:
-
Overlapping IP addresses or Subnets
-
-
Warning: Anomalies are shown as warning when the network is impacted. Some of the examples include:
-
When connectivity to a given prefix or endpoint is degraded
-
Anomaly Properties
You can configure the following properties on an anomaly.
-
Assign an user
-
Add tags
-
Add a comment
-
Set verification status
-
Acknowledge an anomaly so that the acknowledged anomalies are not displayed in the Anomalies Table.
To configure properties on an anomaly see Configuring Anomaly Properties.
You can acknowledge anomalies in the following ways:
-
Manually acknowledge an anomaly. See Configuring Anomaly Properties.
-
Manually acknowledge multiple anomalies. Analyze Anomalies.
-
Use anomaly rules to automatically acknowledge anomalies matching anomaly rules. See Creating Anomaly Rules.
View Anomalies
In Nexus Dashboard Insights, you can view anomalies in the following ways:
-
Navigate to Analyze > Anomalies.
OR
-
Navigate to Overview > Global View.
-
Select online sites or snapshot sites from the drop-down menu.
-
Click Anomalies Level card.
-
In the Anomalies page, click View all anomalies.
OR
-
Navigate to Manage > Sites.
-
Select a site.
-
Click Anomalies.
OR
-
Navigate to Manage > Inventory.
-
Click Controllers or Switches.
-
Select a controller or switch.
-
Click Anomalies.
Analyze Anomalies
-
Navigate to Analyze > Anomalies.
-
Select Online sites or Snapshot sites from the drop-down menu.
-
From the Anomalies dropdown menu, select Grouped or Ungrouped.
-
From the Date and Time selector, select the time range. By default, Active Now are displayed.
The Anomalies page displays the anomalies by Level and Category for your sites, based on the selected time range.
-
The Level donut chart displays the total number of anomalies of Critical, Major, and Warning severity.
-
The category donut chart displays the total number of anomalies by various categories, such as Hardware, Capacity, Compliance, Connectivity, Configuration, Integrations, and Active bugs.
-
For the anomalies displayed for a snapshot site, the anomaly levels are across all snapshots and not just the latest snapshot.
-
-
Use the search bar to filter the anomalies. You can also perform a search for affected objects such as interface, VRF, EPG, BD and view the associated anomalies. See Anomaly Filters.
-
The Anomalies table displays the filtered anomalies. By default, the anomalies are sorted by Level . Click the column heading to sort the anomalies in the table.
-
Click the gear icon to configure the columns in the Anomalies table.
By default, the columns Title, Level, Category, and Count are displayed for Grouped Anomalies.
By default, the columns What’s wrong, Level, Category, Site, and Detection Time are displayed for Ungrouped Anomalies.
-
Click an anomaly to view additional details such as What’s wrong?, What’s the impact?, and How do I fix it?.
-
From the Anomalies dropdown menu, select Ungrouped.
-
Select anomalies from the Anomalies table and click Acknowledge Anomalies to acknowledge anomalies.
-
You can also click an anomaly and in the Anomaly page select Acknowledge Anomaly from the Actions menu.
-
By default all the unacknowledged anomalies are displayed in the anomalies table. Once you acknowledge an anomaly, select Acknowledged from the drop-down list to view all the acknowledged anomalies.
-
-
Click an anomaly to view the Anomaly page. Click the bookmark icon to bookmark the anomaly.
-
Click an anomaly to view the Anomaly page. Click the pin icon to pin the anomaly. You can pin an anomaly to add a widget for that anomaly to your custom dashboard.
Guidelines and Limitations
-
In the following scenarios, anomalies are not displayed in the Anomalies page.
-
Anomalies which belong to the category "System" are not displayed in the Anomalies page by default.
-
When there is any collection or login failure, in the Admin > System Settings > System Status Details page, Assurance status is displayed as Healthy. At the same time, in the Admin > System Settings > System Issues page, anomalies related to any collection or login failure are not displayed.
To view the anomalies, perform the following steps:
-
To view these anomalies, Navigate to Analyze > Anomalies.
-
Select Online Sites from the drop-down list.
-
Select Ungrouped from the All Anomalies drop-down list.
-
Use the search bar to filter on category == system. All system anomalies are displayed in the anomalies table.
-
-
-
For any site, the data is purged in either of the following scenarios:
-
After the thirty day retention period
-
When the storage threshold is reached
As a result, the anomalies and advisories for that site are not displayed. You have to rerun the analysis to view the anomalies and advisories.
-
Configuring Anomaly Properties
Use the following procedure to configure properties on an anomaly.
-
Navigate to Analyze > Anomalies.
-
Select Online sites or Snapshot sites from the drop-down menu.
-
From the Anomalies dropdown menu, select Ungrouped.
The Ungrouped view displays the individual anomalies raised for your sites.
-
From the Date and Time selector, select the time range. By default, Active Now are displayed.
-
Click an anomaly from the table and then select a property from the Actions menu.
-
Select Acknowledge to acknowledge an anomaly. By default all the unacknowledged anomalies are displayed in the anomalies table. Once you acknowledge an anomaly, select Acknowledged from the drop-down list to view all the acknowledged anomalies.
-
Select Verification Status to set a user defined status such a New, In Progress, or Closed to an anomaly. Select a status from the drop-down list and click Save.
-
Select Assigned To to assign an anomaly to an user. Enter the username and click Save.
-
Select Comment to assign a comment to an anomaly. Enter a comment and click Save.
-
Select Manage to add user-defined tags to an anomaly. Enter the tag name and click Save. You can enter multiple tags. After entering the tag name, press Enter.
In the Anomalies table, the properties assigned to an anomaly are displayed in the Status column.
-
-
To acknowledge multiple anomalies, select anomalies. Click Acknowledge anomalies.
-
To view the the properties assigned to an anomaly, click an anomaly to view the Anomaly page. In the Anomaly page, properties such as Verification Status, Acknowledge, and Assigned To are displayed. To view comments and tags assigned to an anomaly, from the Actions menu, select Comment or Manage Tags.
Anomaly Filters
The search bar allows you to filter the anomalies. In the Anomalies page, you can use the following filters in the ungrouped view to refine the displayed anomalies:
-
Title - Display anomalies with a specific title.
-
Level - Display anomalies of a specific level.
-
Assigned To - Display anomalies assigned to a specific user.
-
Site - Display anomalies for a specific site.
-
Detection Time - Display anomalies with a specific detection time.
-
Cleared Time - Display anomalies with a specific cleared time.
-
Last Seen Time - Display anomalies with a specific last seen time. Last Seen Time indicates the time the anomaly was updated while under active status. If the status of the anomaly is not cleared, then the anomaly is active.
-
Check code - Display anomalies with a specific check code.
-
Category - Display anomalies from a specific category.
-
Nodes - Display anomalies for specific nodes.
-
What’s Wrong - Displays anomalies of a specific affected object.
-
Verification Status - Display anomalies with a specific verification status.
-
IP address - Display anomalies with a specific IP address.
-
MAC address - Display anomalies with a MAC address.
-
Interface - Display anomalies with a specific interface.
-
VPC - Display anomalies with a specific VPC.
-
EPG - Display anomalies with a specific EPG.
-
VRF - Display anomalies with a specific VRF.
-
BD - Display anomalies with a specific BD.
As a secondary filter refinement, use the following operators:
-
== - with the initial filter type, this operator, and a subsequent value, returns an exact match.
-
!= - with the initial filter type, this operator, and a subsequent value, returns all that do not have the same value.
-
contains - with the initial filter type, this operator, and a subsequent value, returns all that contain the value.
-
!contains - with the initial filter type, this operator, and a subsequent value, returns all that do not contain the value.

To search for anomalies using a combination of affected object filters (such as IP address, MAC address, interface, VPC, EPG, VRF), all the provided search objects should be a primary affected object for any given anomaly. The search will not return results if the query contains non primary affected objects.
-
To determine the primary affected object for a particular anomaly, navigate to Analyze Anomalies.
-
Select Ungrouped from the drop-down menu.
-
Select an anomaly from the the Anomalies table.
-
In the What’s the impact? area, the primary affected objects are highlighted in bold.
Anomaly Rules
Anomaly Rules
Anomaly rules feature enables you to acknowledge all new detected anomalies that match the criteria and adjust the anomaly score accordingly. You can also match an alert against an anomaly rule using the match criteria.
It also allows you to customize an anomaly by adding a custom message that will be displayed when an anomaly is raised based on the anomaly rule.
-
An anomaly rule contains the match criteria required to match an anomaly against the rule and the action that should be applied on the matched anomaly.
-
An anomaly rule can contain multiple match criteria.
-
You can use attributes such as severity, category, event name, and object match rule, to define the match criteria for the anomaly rule.
-
A match criteria can contain one attribute or multiple attributes.
-
If a match criteria contains multiple attributes, then the anomalies containing all the attributes will be matched. The AND operator will apply to the attributes.
-
If a match criteria contains multiple affected object match rules, then the anomalies containing all of the affected object match rules will be matched.
-
-
If an anomaly rule contains multiple match criteria, then the anomalies containing the union of the match criteria will be matched. Any anomalies that match any criteria will apply to the rule. The OR operator will apply to the criteria.
-
Anomaly Rules using Match Criteria with Object Match Rule will only support the Equals to regex criteria.
-
An Anomaly rule can be enabled only if it contains at least one match criteria.
-
Anomaly rules are not supported for advisories.
-
If you created multiple anomaly rules, all rules that match get applied.
-
If you specified multiple attributes in an anomaly rule, the conditions of each attribute must be met for the rule to apply.
-
If you specified multiple conditions for an attribute, any of the conditions must be met for the attribute to evaluate as true.
-
If you specified multiple match criteria within an affected object, each criteria must be met.
Guidelines and Limitations
-
Deleting or disabling an anomaly rule containing either Acknowledge or Customize Anomaly action will not delete or disable the anomaly rule from active anomalies. The anomaly rule will not be applied to any new instance of the anomaly only.
-
When you edit an anomaly rule containing either Acknowledge or Customize Anomaly action, the updates are not applied to active anomalies. The anomaly rule updates will be applied to any new instance of the anomaly only.
-
If an anomaly rule contains both Acknowledge and Customize Anomaly action, and you edit the anomaly rule by removing either the Acknowledge and Customize Anomaly action, then the updates are not applied to active anomalies.
-
When you delete or disable an anomaly rule containing Customize Anomaly action, the recommendations are still displayed in the How do I fix it area.
-
You can only manually unacknowledge anomalies, including those that are automatically acknowledged by an anomaly rule. You cannot automatically unacknowledge these anomalies by disabling or deleting the anomaly rules.
-
Maximum anomaly rules supported across all sites is 500.
-
In the following scenario, you cannot use an alert rule to automatically acknowledge existing active anomalies matching the match criteria by selecting the Apply to existing active anomalies check-box in the Create Anomaly Rule page.
-
An anomaly is raised before the alert rule is created and there are no further updates to the anomaly after the alert rule is created.
In this scenario, you can manually acknowledge the anomalies. See Configuring Anomaly Properties.
-
-
After upgrading to this release, some anomaly rules may be updated or deleted. You can manually add these rules after the upgrade based on the new categories and severity.
-
Anomaly rules using match criteria with an object match rule or code rule does not apply to anomalies with the one of the following categories: Active Bugs, Capacity, Hardware, Integrations, or Connectivity.
Creating Anomaly Rules
-
Navigate to Manage > Rules > Anomaly Rules.
-
Click Create Anomaly Rule.
-
Complete the following fields for General.
-
In the Name field, enter the name.
-
In the Description field, enter the description.
-
Choose the state to enable the rule to be active.
-
Click Next.
-
-
Complete the following fields for Settings.
-
Click Add Criteria to define the match criteria for the anomaly rule.
-
From the Site drop-down list, select the site. Only the match criteria for the site running the analysis will be selected and matched with the alerts to perform the action.
-
Select the attributes for the match criteria. You can use category, event title, object match rule, code rule, and severity to define the attribute for the match criteria. Select category and event title from the drop-down list.
-
Click Add Object Match Rule to define the primary affected objects for the match criteria.
-
Click Add Code Rule to define the check code for the match criteria.
-
Select severity from the drop-down list.
-
Click Save.
-
-
Complete the following fields for Actions.
-
Use toggle to choose Acknowledge.
-
Check Apply to existing active anomalies check-box to apply the anomaly rule to existing instance of the anomalies matching the alert anomaly. Uncheck the check-box to apply the anomaly rule to match to new instance of anomalies.
-
-
Use toggle to choose Customize Anomaly.
-
Enter the recommendations to be displayed in the anomaly rule. You can create multiple rules based on different matching criteria to have more than one customized recommendation displayed in the anomaly rule. In the Anomaly page, the recommendations are displayed in the How do I fix it? area.
-
Check Apply to existing active anomalies check-box to apply the anomaly rule to existing instance of the anomalies matching the anomaly rule. Uncheck the check-box to apply the anomaly rule to match to new instance of anomalies.
-
-
-
In the Summary, review your selections and click Add Anomaly Rule. The new anomaly rule is displayed in the Anomaly Rule table.
Managing Anomaly Rules
-
Navigate to Manage > Rules > Anomaly Rules. The anomaly rules are displayed in the Anomaly Rule table.
-
Use the search bar to filter the rules based on Name, Actions, and State.
-
Select an anomaly rule and click Edit Rule to edit.
-
Select an anomaly rule and click Delete Rule to delete the rule from the system.
-
Select an anomaly rule and click ellipse icon. Click Enable to enable the rule. If the state is enabled, the rule will be applied in the next analysis. Before enabling an anomaly rule make sure that at least one match criteria is present in the anomaly rule.
-
Select an anomaly rule and click ellipse icon. Click Disable to disable the rule. If the state is disabled, the rule will not be applied during the next analysis.
Advisories
Advisories
Nexus Dashboard Insights identifies Field Notices, software and hardware End-of-Life and End-of-Sale announcements, as well as PSIRTs that can potentially impact the network sites that it is monitoring, and generate advisories. Advisories provides recommendations to keep your network under support and running in optimal conditions.
Advisories in Nexus Dashboard Insights provide details of relevant impact via Field Notices, PSIRTs, EoL/EoS of Hardware and Software, and Best Practices. You can view the advisories by Level and Category for a particular site based on the selected time range.
Click a particular advisory to view Information such as What’s wrong, What’s the impact, and How do I fix it.
Advisories enable you to stay current with,
-
New software and hardware availability
-
Hardware and software EoS and EoL announcements. You also get lead time for upgrades.
-
PSIRTs and Field Notices. This helps you stay secure and compliant.
-
Instant visibility into applicable bugs
Advisories are classified into 4 Levels: Critical, Major, and Warning.
-
Critical: Advisories are shown as critical when there are unsupported infrastructure and the severity of the bugs associated with notices is Severity1. Some of the examples include:
-
When switches in a site are running under End-of-Life conditions. When a critical (Severity1 ) Field Notice or PSIRT has been issued for a switch or software version currently running in your network.
-
-
Major: Advisories are shown as major when the severity of the bugs associated with notices is Severity2. Some of the examples include:
-
When a critical (Severity2) Field Notice or PSIRT has been issued for a switch or software version currently running in your network.
-
-
Warning: Advisories are shown as warning when there is support for potentially at risk infrastructure and the severity of the bugs associated with notices is Severity3. Some of the examples include:
-
When switches in a site are approaching End-of-Life conditions. When a Severity3 Field Notice or PSIRT has been issued for a switch or software version currently running in your network.
-
View Advisories
In Nexus Dashboard Insights, you can view advisories in the following ways:
-
Navigate to Analyze > Advisories.
OR
-
Navigate to Overview > Global View.
-
Select online sites or snapshot sites from the drop-down menu.
-
Click Advisories Level card.
-
In the Advisories page, click View all advisories.
OR
-
Navigate to Manage > Sites.
-
Select a site.
-
Click Advisories.
OR
-
Navigate to Manage > Inventory.
-
Click Controllers or Switches.
-
Select a controller or switch.
-
Click Advisories.
Analyze Advisories
-
Navigate to Analyze > Advisories.
-
Select Online sites or Snapshot sites from the drop-down menu.
-
Click the Date and Time selector to select the time range.
-
Use the search bar to filter the advisories.
-
The Advisories table displays the filtered advisories. The advisories are sorted by Level by default. Click the column heading to sort the advisories in the table.
-
Click the gear icon to configure the columns in the Advisories table. By default, the columns Title, Level, Category, Site, and What’s Impacted, are displayed.
-
Click an advisory to view the additional details such as What’s wrong?, What’s the impact?, and How do I fix it?.
-
Select advisories from the Advisory table and click Acknowledge Advisories to acknowledge advisories.
-
You can also click an advisory and in the Advisory page select Acknowledge Advisory from the Actions menu.
By default all the unacknowledged advisories are displayed in the advisories table. Once you acknowledge an advisory, select Acknowledged from the drop-down list to view all the acknowledged advisories.
-
-
Click an advisory to view the Advisory page. Click the bookmark icon to bookmark the advisory.
-
Click an advisory to view the Advisory page. Click the pin icon to pin the advisory.
Advisory Filters
The search bar allows you to filters the advisories. In the Advisories page, you can use the following filters to refine the displayed advisories:
-
Title - Display advisories with a specific title.
-
Advisory Level - Display advisories of a specific level.
-
Detection Time - Display advisories with a specific detection time.
-
Last Seen time - Display only advisories with a specific last seen time. Last Seen Time indicates the time advisory was updated while under active status. If the status of the advisory is not cleared, then the advisory is active.
-
Category - Display advisories from a specific category.
-
Site - Display advisories for a specific site.
-
Nodes - Display advisories for specific nodes.
-
What’s wrong? - Display advisories of a specific affected object.
As a secondary filter refinement, use the following operators:
-
==- with the initial filter type, this operator, and a subsequent value, returns an exact match. -
!=- with the initial filter type, this operator, and a subsequent value, returns all that do not have the same value. -
contains- with the initial filter type, this operator, and a subsequent value, returns all that contain the value. -
!contains- with the initial filter type, this operator, and a subsequent value, returns all that do not contain the value.
Metadata Support
Nexus Dashboard Insights uses metadata bundles to detect new bugs, PSIRTs, Field Notices, and End of Life Notices. Metadata packages are constantly updated by us and posted to the Cisco Intersight Cloud after validation. Nexus Dashboard Insights connects to the Cisco Intersight Cloud through a device connector that is embedded in the Nexus Dashboard platform and that pulls periodically updated metadata packages. With metadata support for air-gap environment, if Nexus Dashboard is not connected to Cisco Intersight Cloud, you can manually upload the latest metadata to Nexus Dashboard Insights in a secure and trusted way. You can download the bundle updates from the Cisco DC App Center.
Navigate to Admin > System Settings > Metadata to view the metadata version.
-
In the General area, the Metadata Version is displayed.
-
In the Update Metadata Version area, you can upload metadata for air-gapped environments.
Metadata Support for Air-Gap Environment
With metadata support for air-gap environment, if Nexus Dashboard is not connected to Cisco secure cloud, you can upload the latest metadata to Nexus Dashboard Insights periodically in a secure and trusted way.
You can download the encrypted metadata file from the Cisco DC App Center and upload it to Nexus Dashboard Insights to get decrypted updates on exposure to Bugs, PSIRTs, Defects, Field Notices, and End of Life Notices.
Update Metadata Version
Use this procedure to update the latest metadata version in an Air-Gap or offline environment.
-
Log in to Cisco DC App Center.
-
From the User drop-down menu, select My Account.
-
Click Config Files Requests tab.
-
Click Request Config File.
-
From the Choose App ID drop-down list, select Nexus Dashboard.
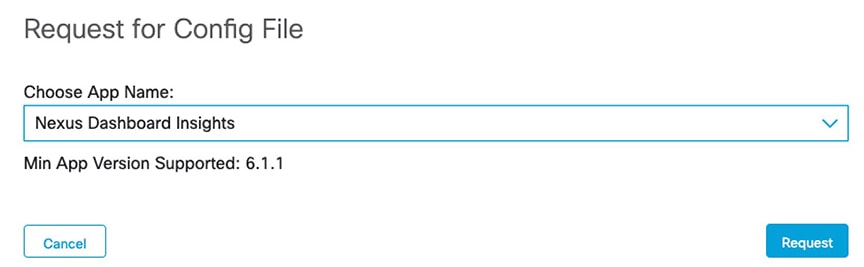
-
Verify the minimum supported app version and click Request.
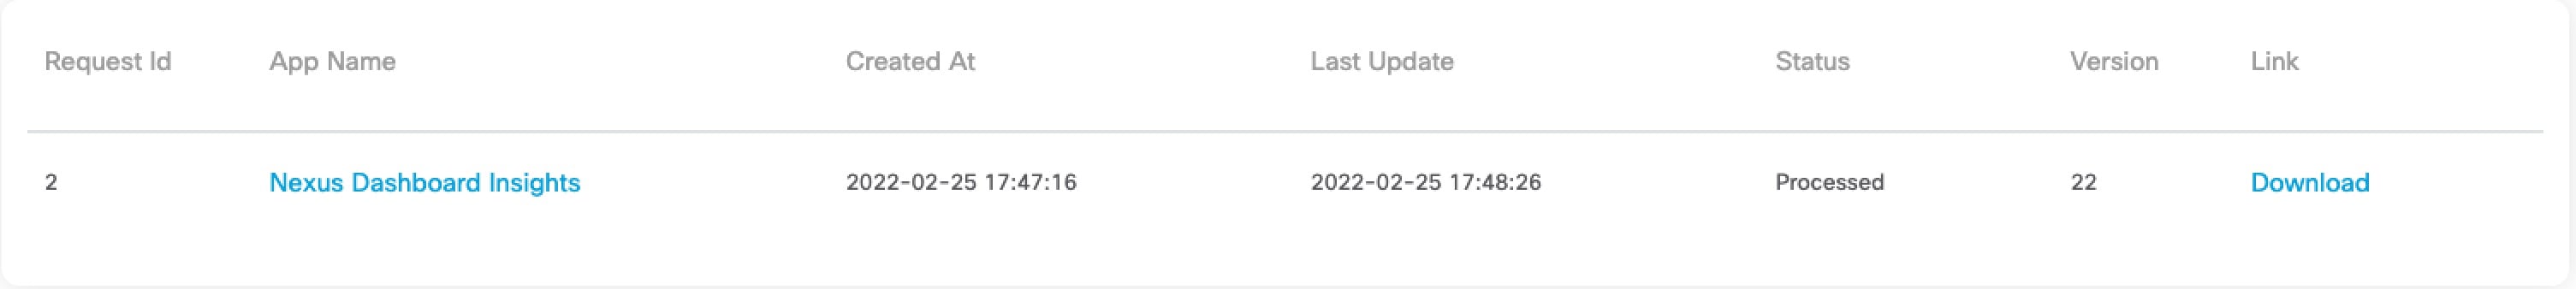
It takes approximately 15 minutes for the request to be completed. In the Config Files Request page, the generated file is displayed in the table below.
-
Select the file and click Download to download the file locally.
-
Log in to Cisco Nexus Dashboard Insights.
-
Navigate to Admin > System Settings > Metadata to view the metadata version.
-
In the Update Metadata Version area, upload the file you have downloaded from the Cisco DC App Center.
-
Click Done to upload the latest metadata.
Copyright
THE SPECIFICATIONS AND INFORMATION REGARDING THE PRODUCTS IN THIS MANUAL ARE SUBJECT TO CHANGE WITHOUT NOTICE. ALL STATEMENTS, INFORMATION, AND RECOMMENDATIONS IN THIS MANUAL ARE BELIEVED TO BE ACCURATE BUT ARE PRESENTED WITHOUT WARRANTY OF ANY KIND, EXPRESS OR IMPLIED. USERS MUST TAKE FULL RESPONSIBILITY FOR THEIR APPLICATION OF ANY PRODUCTS.
THE SOFTWARE LICENSE AND LIMITED WARRANTY FOR THE ACCOMPANYING PRODUCT ARE SET FORTH IN THE INFORMATION PACKET THAT SHIPPED WITH THE PRODUCT AND ARE INCORPORATED HEREIN BY THIS REFERENCE. IF YOU ARE UNABLE TO LOCATE THE SOFTWARE LICENSE OR LIMITED WARRANTY, CONTACT YOUR CISCO REPRESENTATIVE FOR A COPY.
The Cisco implementation of TCP header compression is an adaptation of a program developed by the University of California, Berkeley (UCB) as part of UCB’s public domain version of the UNIX operating system. All rights reserved. Copyright © 1981, Regents of the University of California.
NOTWITHSTANDING ANY OTHER WARRANTY HEREIN, ALL DOCUMENT FILES AND SOFTWARE OF THESE SUPPLIERS ARE PROVIDED “AS IS" WITH ALL FAULTS. CISCO AND THE ABOVE-NAMED SUPPLIERS DISCLAIM ALL WARRANTIES, EXPRESSED OR IMPLIED, INCLUDING, WITHOUT LIMITATION, THOSE OF MERCHANTABILITY, FITNESS FOR A PARTICULAR PURPOSE AND NONINFRINGEMENT OR ARISING FROM A COURSE OF DEALING, USAGE, OR TRADE PRACTICE.
IN NO EVENT SHALL CISCO OR ITS SUPPLIERS BE LIABLE FOR ANY INDIRECT, SPECIAL, CONSEQUENTIAL, OR INCIDENTAL DAMAGES, INCLUDING, WITHOUT LIMITATION, LOST PROFITS OR LOSS OR DAMAGE TO DATA ARISING OUT OF THE USE OR INABILITY TO USE THIS MANUAL, EVEN IF CISCO OR ITS SUPPLIERS HAVE BEEN ADVISED OF THE POSSIBILITY OF SUCH DAMAGES.
Any Internet Protocol (IP) addresses and phone numbers used in this document are not intended to be actual addresses and phone numbers. Any examples, command display output, network topology diagrams, and other figures included in the document are shown for illustrative purposes only. Any use of actual IP addresses or phone numbers in illustrative content is unintentional and coincidental.
The documentation set for this product strives to use bias-free language. For the purposes of this documentation set, bias-free is defined as language that does not imply discrimination based on age, disability, gender, racial identity, ethnic identity, sexual orientation, socioeconomic status, and intersectionality. Exceptions may be present in the documentation due to language that is hardcoded in the user interfaces of the product software, language used based on RFP documentation, or language that is used by a referenced third-party product.
Cisco and the Cisco logo are trademarks or registered trademarks of Cisco and/or its affiliates in the U.S. and other countries. To view a list of Cisco trademarks, go to this URL: http://www.cisco.com/go/trademarks. Third-party trademarks mentioned are the property of their respective owners. The use of the word partner does not imply a partnership relationship between Cisco and any other company. (1110R)
© 2017-2024 Cisco Systems, Inc. All rights reserved.