
Cisco Nexus Hyperfabric — IP SLA Tracking
IP SLA tracking
Internet Protocol Service Level Agreement (IP SLA) tracking is a feature that simulates network traffic generation to measure network performance and verify service reachability. It works by sending out small test packets (probes) to check if a specific service or device is responding. By tracking metrics like reachability or response times, the network can automatically adjust its routing to bypass failures or slow paths. These tracking results influence the routing table, allowing for routes to be dynamically removed when tracking results are negative and restored once the service becomes healthy again.
IP SLA tracking in Nexus Hyperfabric
Within Cisco Nexus Hyperfabric, IP SLA tracking monitors the health of specific services and automatically manages static routes. Examples of these services include database services or web servers listening on a specific port. IP SLA tracking ensures that traffic is only directed to destinations where the required service is active by verifying that the specific port is open and responding.
IP SLA tracking sends TCP probes to a destination IP address with the specific port. The behavior of these probes depends on where the next-hop IP resides:
- Logical network subnets: If the next-hop IP is in a logical network subnet, all switches that have that logical network configured send IP SLA probes.
- Routed interface subnets: If the next-hop IP is in a routed interface subnet, only the switch that has the routed interface sends IP SLA probes.
The switches use a loopback IP address as the source for these probes. The fabric automatically configures these loopback addresses on the switches based on the loopback IP address range that is defined in the VRF. For these probes to succeed, the destination device must have a proper route to reach the loopback IP address of the switches.
The system automatically manages the routing table based on the IP SLA probe result. If the probe verifies that the service is available, the associated static route remains in the routing table. If the probe determines that the service is unavailable, the system automatically removes the static route to prevent traffic from using the failed next-hop service.
Use case: IP SLA tracking for anycast services
This use case demonstrates how IP SLA tracking ensures high availability for anycast services connected to Nexus Hyperfabric. It illustrates the progression from initial infrastructure setup to automated route management during a service failure. By using IP SLA tracking, traffic is only directed to the next-hops where the tracked port is responding, which prevents traffic loss if the next-hop is reachable but the specific service fails.
Anycast service with ECMP
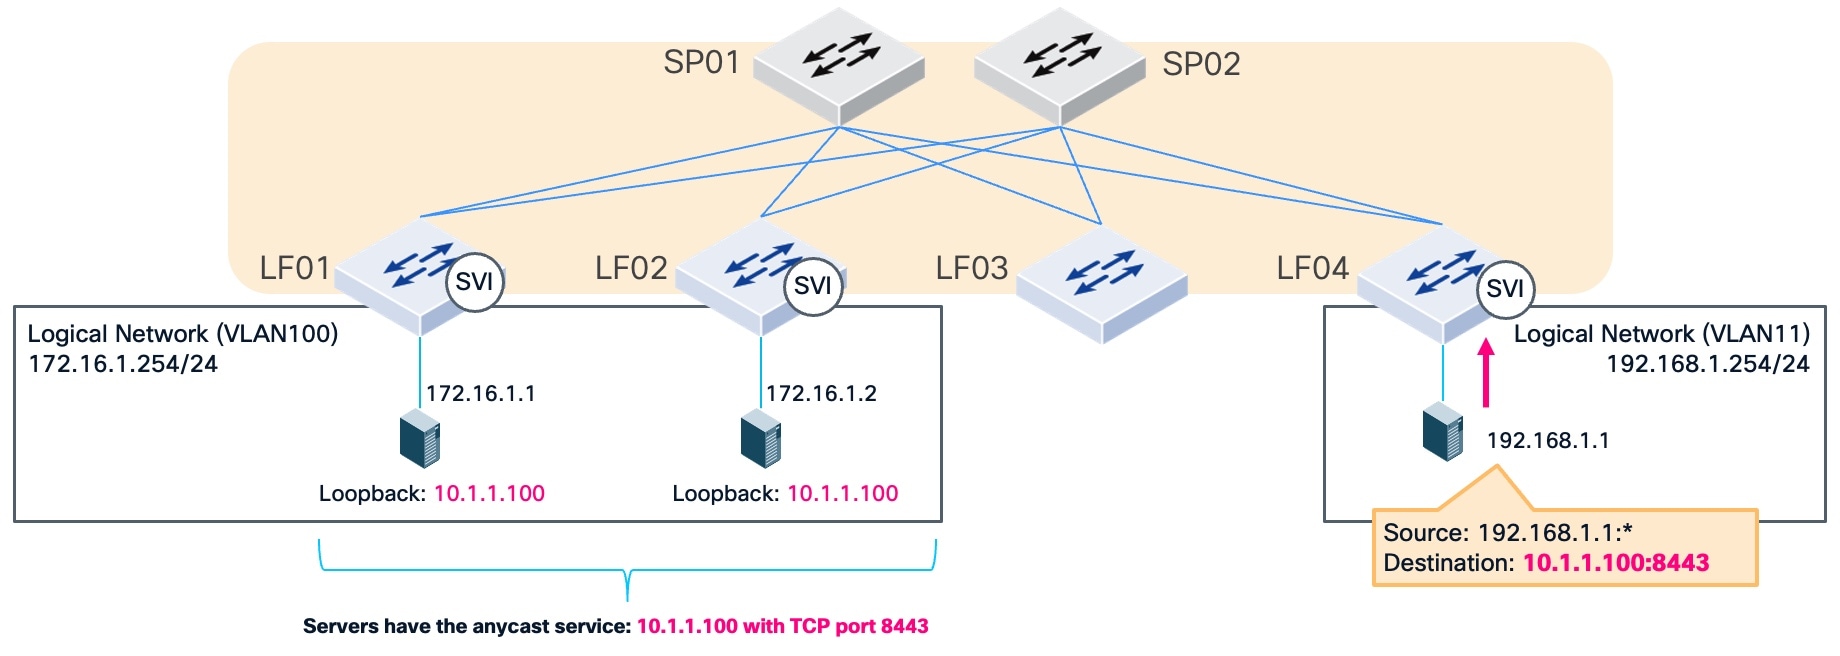
This figure illustrates the logical and physical infrastructure for an anycast service. This topology exemplifies Equal-Cost Multi-Path (ECMP) based simple load balancing by using multiple next-hop paths to distribute traffic across the fabric. In this example, an anycast service at IP address 10.1.1.100 using TCP port 8443 is reachable via IP addresses 172.16.1.1 and 172.16.1.2 as the next-hop addresses. The fabric uses a logical network (VLAN 100) and Switch Virtual Interfaces (SVIs) to provide reachability between the leaf switches and these destinations.
Routing topology
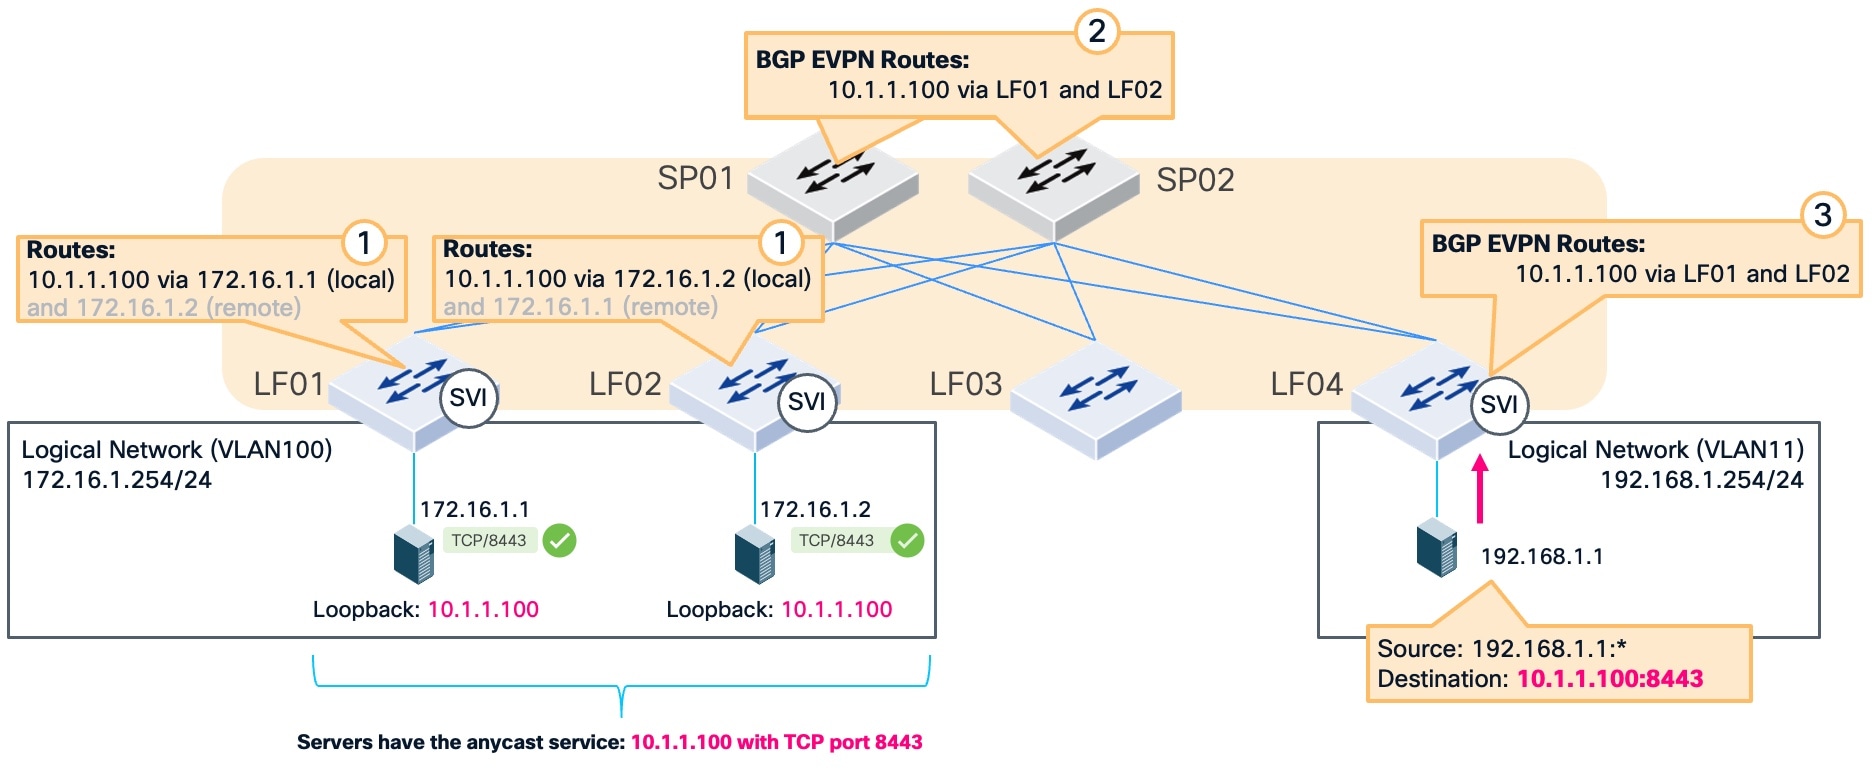
This figure illustrates how the fabric distributes the reachability information defined in the infrastructure. In this topology, traffic from source IP address 192.168.1.1 enters the fabric at leaf switch LF04. This traffic is destined for the anycast service at IP address 10.1.1.100 on TCP port 8443.
The circled numbers in the topology indicate the sequence of route advertisement that enables ECMP routing across the fabric:
- Leaf switches LF01 and LF02 redistribute the static routes for the anycast service into the fabric.
- The spine switches (SP01 and SP02) learn these redistributed routes and advertise them to the other switches in the fabric.
- The leaf switch (LF04) learns the routes from the spine switches.
In a normal operational state, the specific service on port 8443 is active on IP addresses 172.16.1.1 and 172.16.1.2, as indicated by the green check marks.
Service monitoring without IP SLA tracking
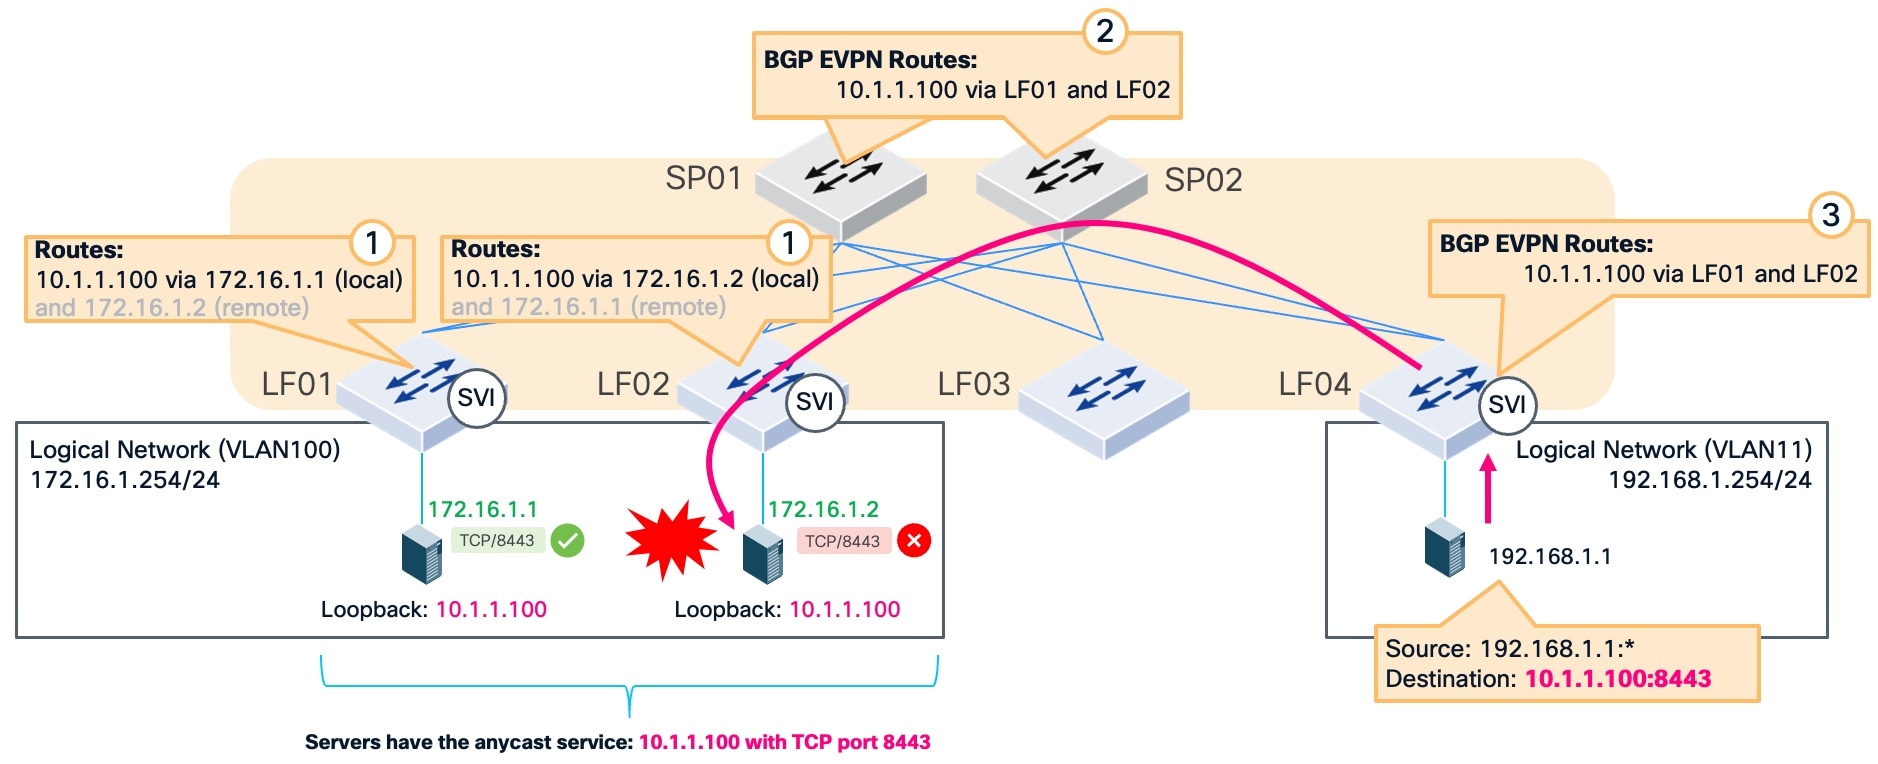
In this example, traffic from source IP address 192.168.1.1 enters the fabric at leaf switch LF04. This traffic is destined for the anycast service at IP address 10.1.1.100 on TCP port 8443. The service listening on TCP port 8443 fails on the server at IP address 172.16.1.2. Because the fabric does not check the state of the specific service port, it continues to keep the static route in the routing table and sends traffic to the failed port. This results in dropped connections because the fabric is unaware that the service is no longer responding.
Automated static route management with IP SLA tracking
The primary benefit of IP SLA tracking is the ability to detect and avoid using the failed service even if the IP reachability exists.
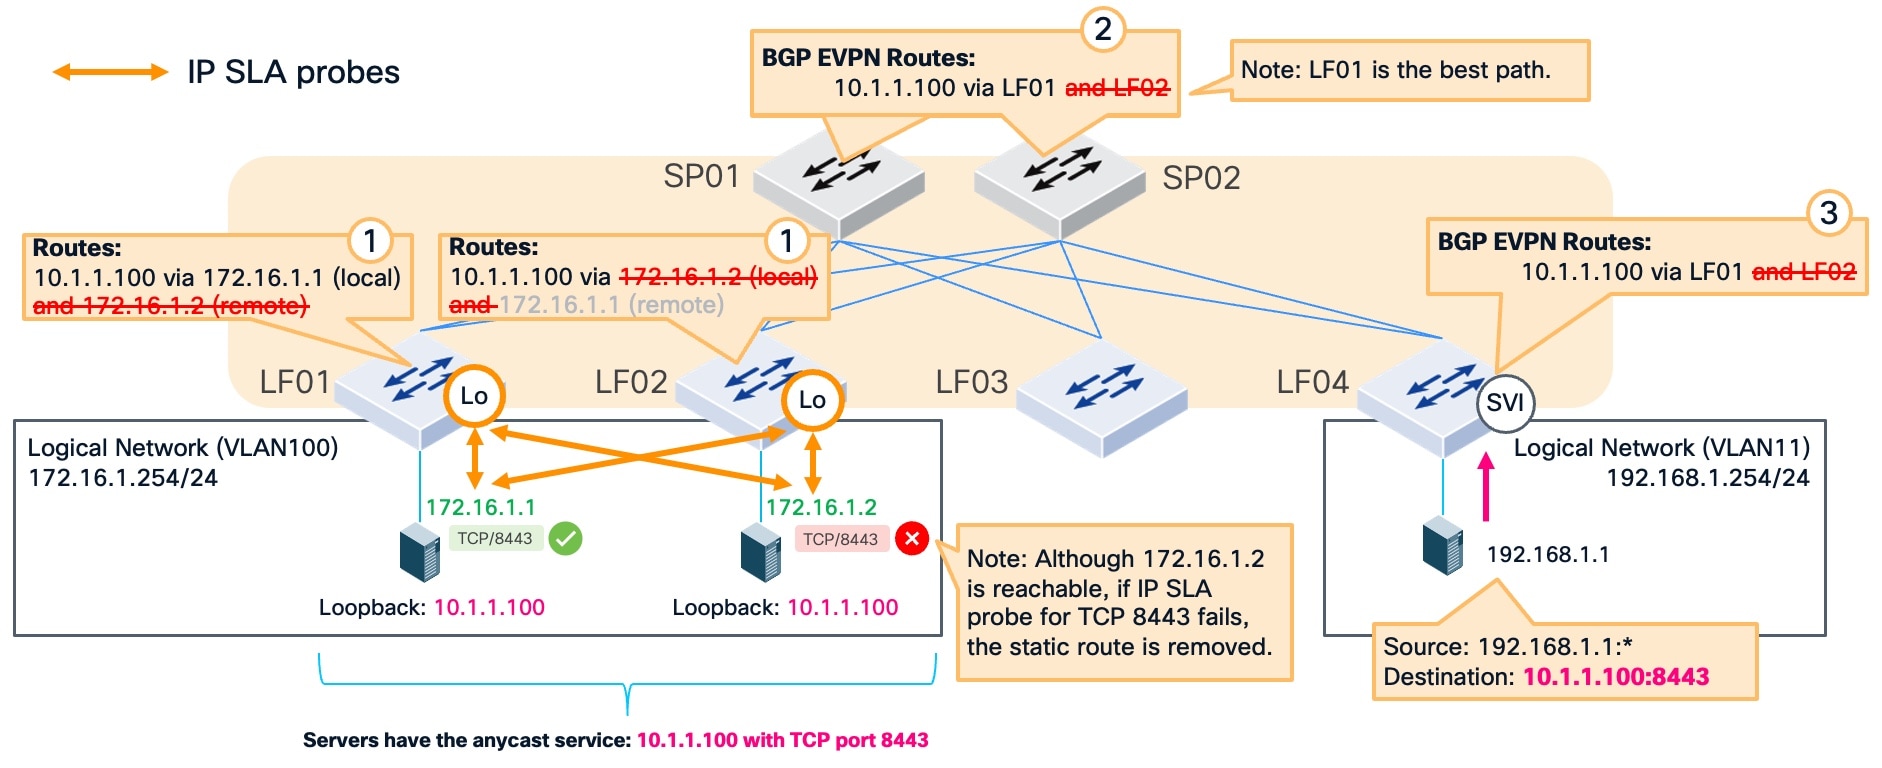
This example illustrates how the fabric automatically recovers when IP SLA is enabled and a monitored service fails. The service on TCP port 8443 fails on the server at IP address 172.16.1.2, which is indicated by a red cross icon. Even if the server maintains IP reachability, the IP SLA probe fails to complete a TCP handshake. When the probe determines the service is unavailable, the fabric marks the tracked IP as a failed next-hop.
Detection and route withdrawal
The system immediately removes the associated static route from the routing table on the switch. This removal occurs even if the server at 172.16.1.2 remains reachable.
- Leaf switches (LF01 and LF02): The routes to the failed next-hop at 172.16.1.2 are withdrawn.
- Spine switches (SP01 and SP02): The path through LF02 is removed, leaving only the healthy paths active.
- Ingress leaf (LF04): The path through LF02 is removed, leaving only the healthy paths active.
Traffic from source IP address 192.168.1.1 is routed to the active next-hop, 172.16.1.1, through LF01. The fabric identifies leaf switch LF01 as the best path for this traffic. This automated static route withdrawal ensures that traffic is not sent to a failed service, maintaining continuous service availability despite the failure.
Nexus Hyperfabric IP SLA tracking requirements
IP SLA tracking requires specific network and reachability configurations to monitor service health and manage static routes effectively.
Nexus Hyperfabric configurations
You must ensure that these configurations are configured in your fabric within Nexus Hyperfabric before using IP SLA tracking:
- Reachability configuration: You must configure an IPv4 or IPv6 address for the logical network or the routed interface depending on the tracked IP address type.
- VRF and Loopback IP address range: You must configure a VRF and define an IPv4 or IPv6 loopback IP address range in the VRF where your static route is defined. The fabric uses this range to automatically configure the loopback interfaces on the switches that send the probes.
- Static route: You must have a static route configured which can already exist or be configured when an IP SLA probe is configured. This is the routing instruction that IP SLA tracking uses to automatically add to or remove from the switch routing table.
- Tracked IP address: This is the next-hop IP address of the static route that the switch monitors. This address must reside in a directly connected subnet.
Device (target) configurations
You must ensure that these target configurations are configured before using IP SLA tracking:
- Route to the loopback IP addresses: The destination device must have a valid return route to reach the loopback IP address of the switch. Because IP SLA probe packets use the loopback IP address as the source, the response from the destination device must be able to route back to that specific loopback IP. For example, if the source IP is the LF01 loopback and the destination is 172.16.1.1, the response from the server must have a route back to the LF01 loopback IP.
- TCP service: The target service must be active and listening on the specified TCP port (1 to 66535).
Configure IP SLA probes
Configure IP SLA probes on switches that are responsible for managing the network paths to your critical services. Use these probes to verify that the specific service is active and responding on the tracked IP before the fabric directs traffic toward it.
Step 1 | Navigate to the VRF where you want to configure IP SLA probes.
|
Step 2 | Choose one of these options under the Configurations area:
|
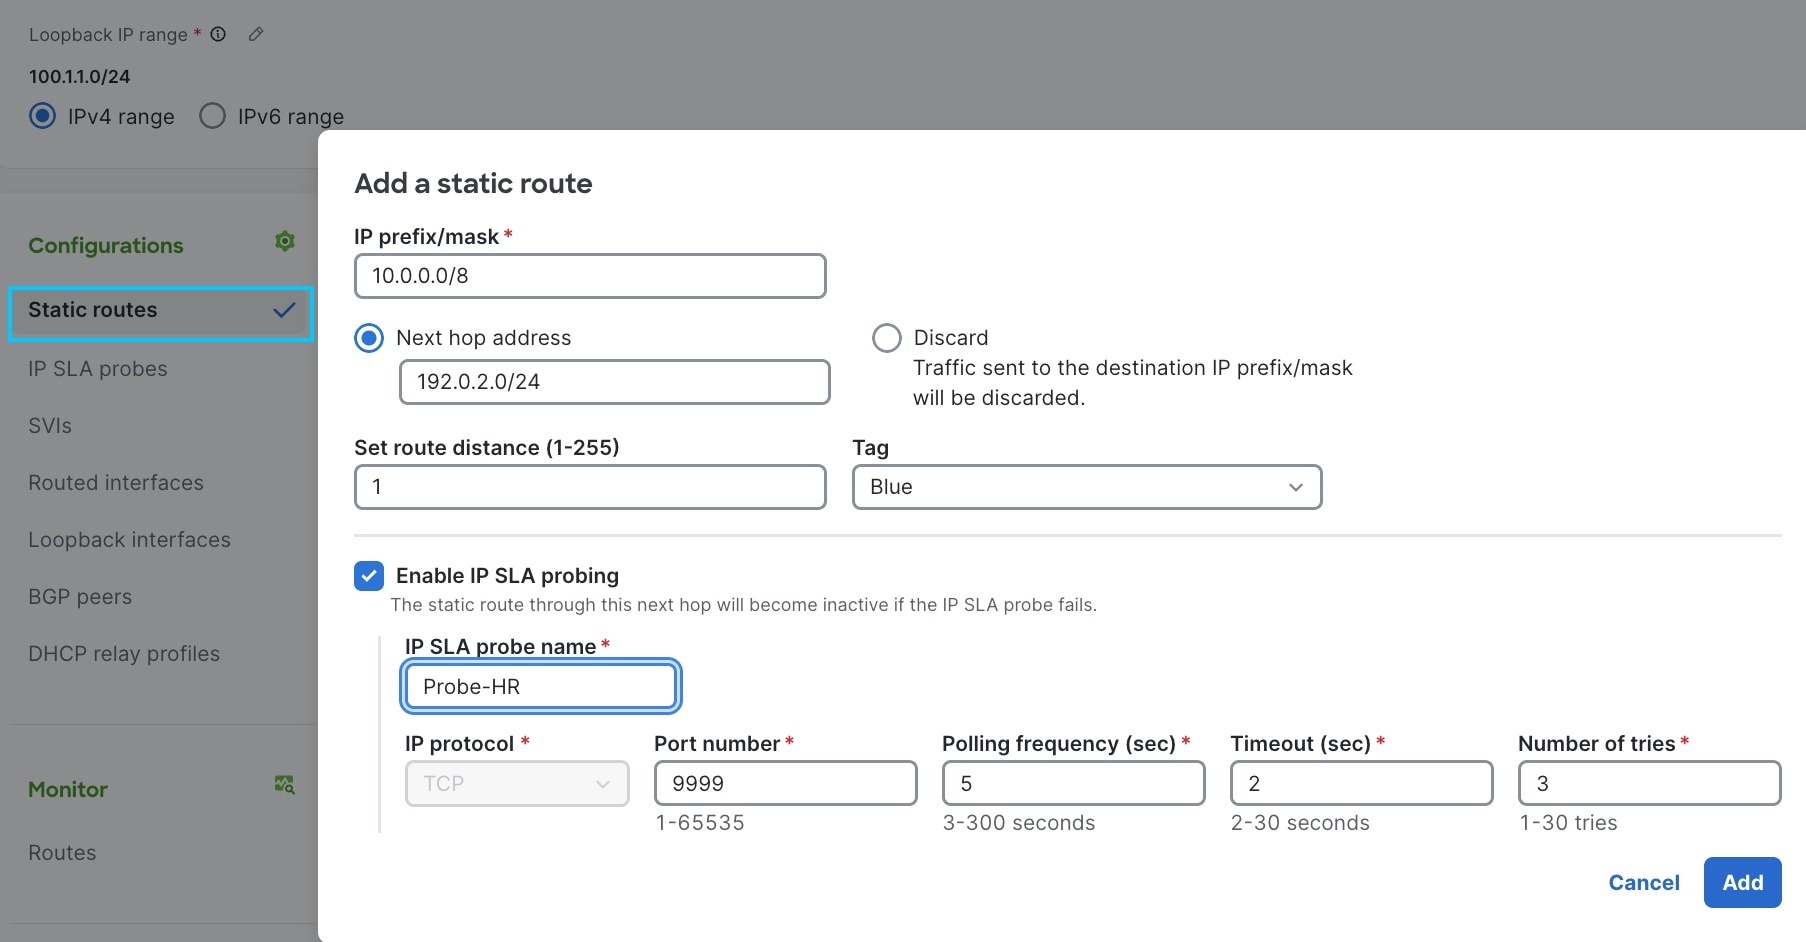
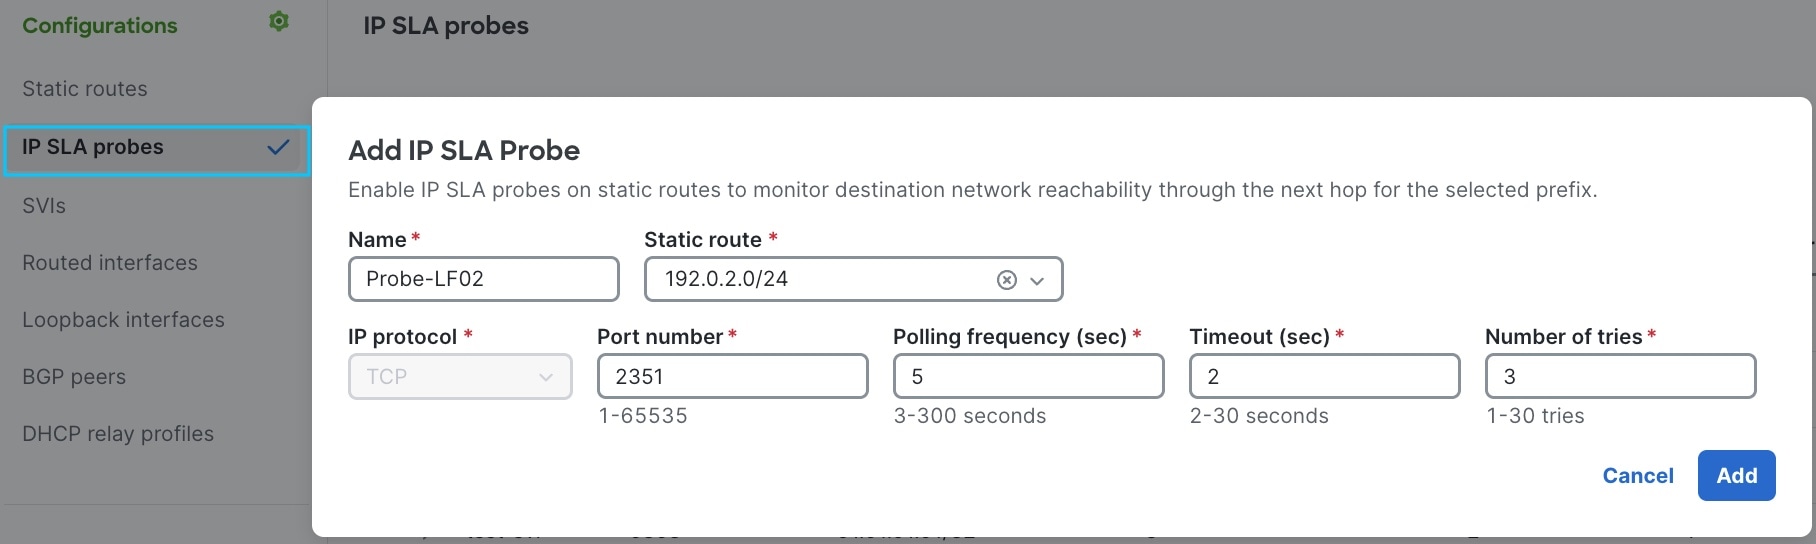
Step 3 | Configure IP SLA probe settings:
|
Step 4 | Select Add. When editing an existing static route, select Save. |

 Note
NoteMonitor IP SLA probes
The IP SLA probes table displays the current operational state and performance history of the probes for bound switches. Use IP SLA probe information to help monitor real-time connectivity, troubleshoot packet loss by reviewing success percentages, and confirm which static routes are affected by probe failures.
Follow these steps to monitor IP SLA probes.
Step 1 | Navigate to the IP SLA probes table.
A list of configured IP SLA probes for bound switches appears. |
Step 2 | Review the status for each IP SLA probe. An Up status indicates the service is responding to the probe. |
Step 3 | Expand an IP SLA probe name to view detailed performance metrics. You can review the Replies received (%) and Number of failures to identify intermittent connectivity issues. A low success rate may indicate network congestion even if the status is currently Up. |
Step 4 | Check the In use by static routes column. This column identifies the specific static routes that the probe influences. If a probe fails, the fabric removes these associated routes from the routing table. |
Step 5 | Identify the source of failure by checking the switch location. If you select the switch name, you can identify the specific switch originating the probe, helping you determine if a connectivity issue is local to a specific switch. 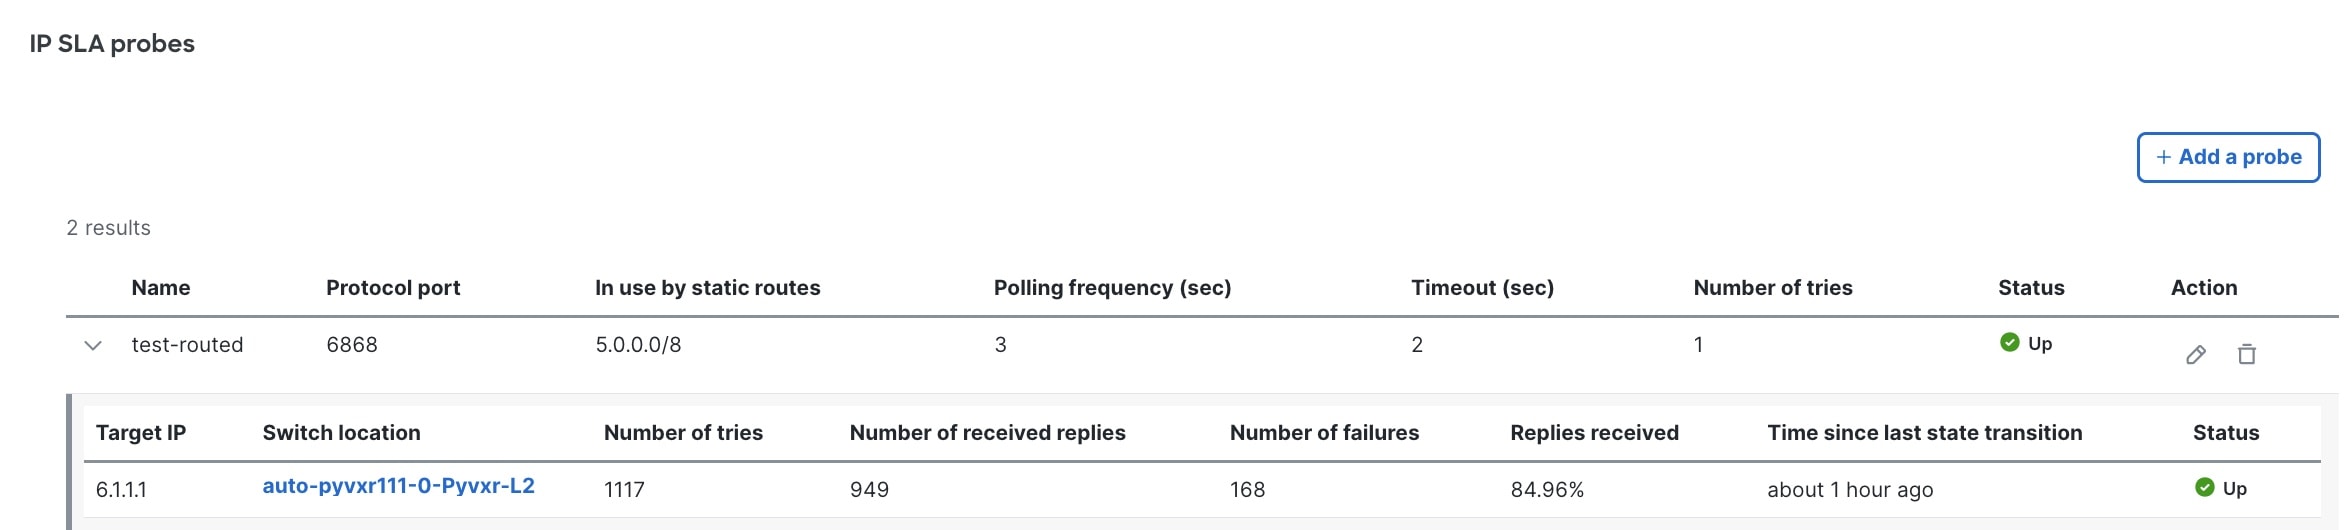 |