
Cisco Nexus Hyperfabric — Servers
Servers
Cisco UCS servers provide a combination of high-performance compute servers and scalable, high-speed storage servers that are required for Artificial Intelligence (AI) applications. These servers are monitored through Cisco Nexus Hyperfabric, which uses telemetry to collect real-time performance and health data from each device. Cisco Nexus Hyperfabric tracks server metrics, but does not allow any configuration changes.
View server information
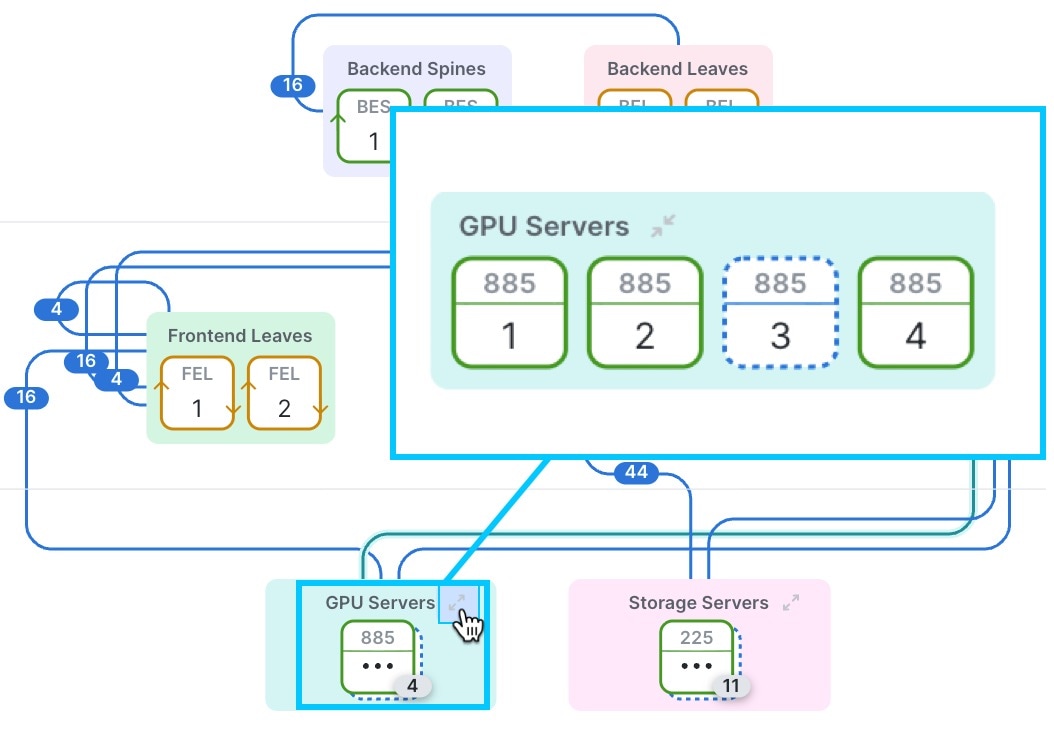
Step 1 | Navigate to the server you are interested in.
|
Step 2 | In the Monitor area, select the server property you want to view.
|
View BMC and general server details
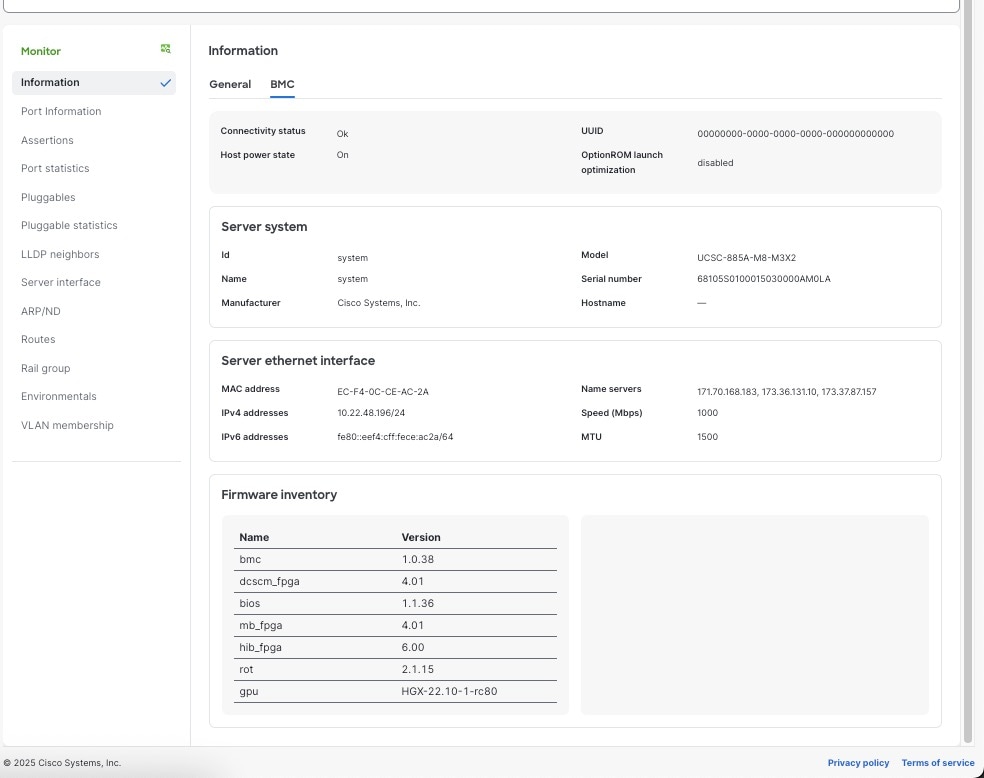
Baseboard Management Controller (BMC) is a microcontroller embedded on a server's motherboard. BMC allows administrators to monitor and control the server even if it is powered down, crashed, or unresponsive.
Administrators can view BMC details to
- monitor and manage server Ethernet interfaces for connectivity and troubleshooting,
- handle server certificates to ensure secure authentication and communication, and
- track firmware inventory to update and maintain system security and stability.
Step 1 | Navigate to the server you are interested in.
|
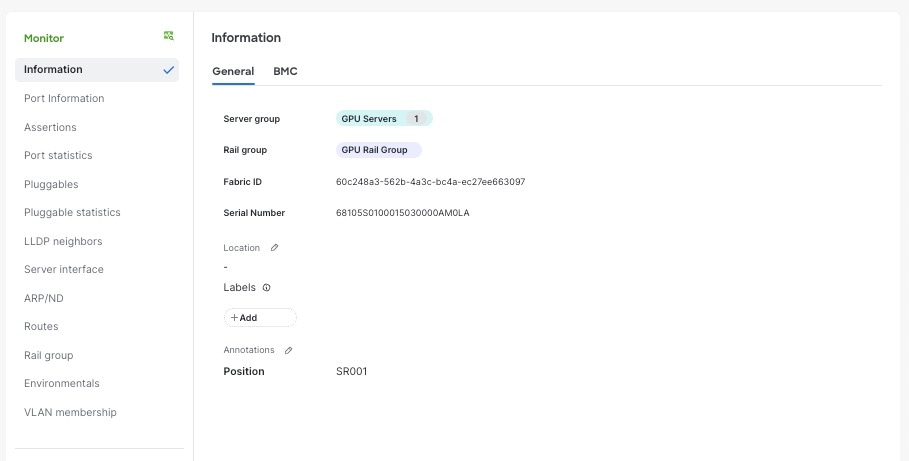
Step 2 | In the Monitor area, select Information. |
Step 3 | By default, the General server details are displayed. If available, server details include
 |
Step 4 | Click BMC to view
 |
View the ports of a server
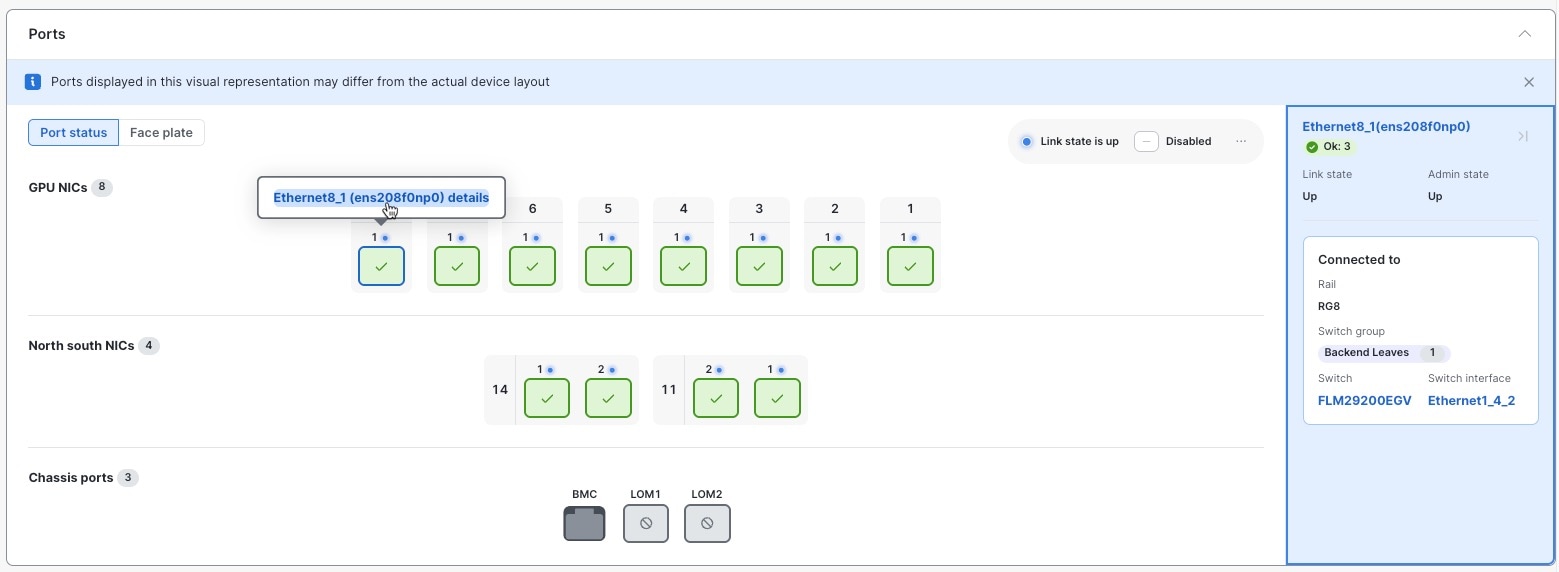
At a glance, you can see which server ports are up, not connected, or disabled. You can view a list of all ports in a server to quickly identify which switch port or rail group it connects to. This list can help isolate network problems and verify link status, speed, and VLAN configuration. You can also investigate details for specific server ports.
Step 1 | Navigate to the server you are interested in.
|
Step 2 | In the Ports area, select Port status or Face plate.
|
Step 3 | To see a list of all ports on the server, in the Monitor area, select Port information. The Port information table lists all the ports on the server. It displays:
|
Step 4 | To see details about a specific port:
|
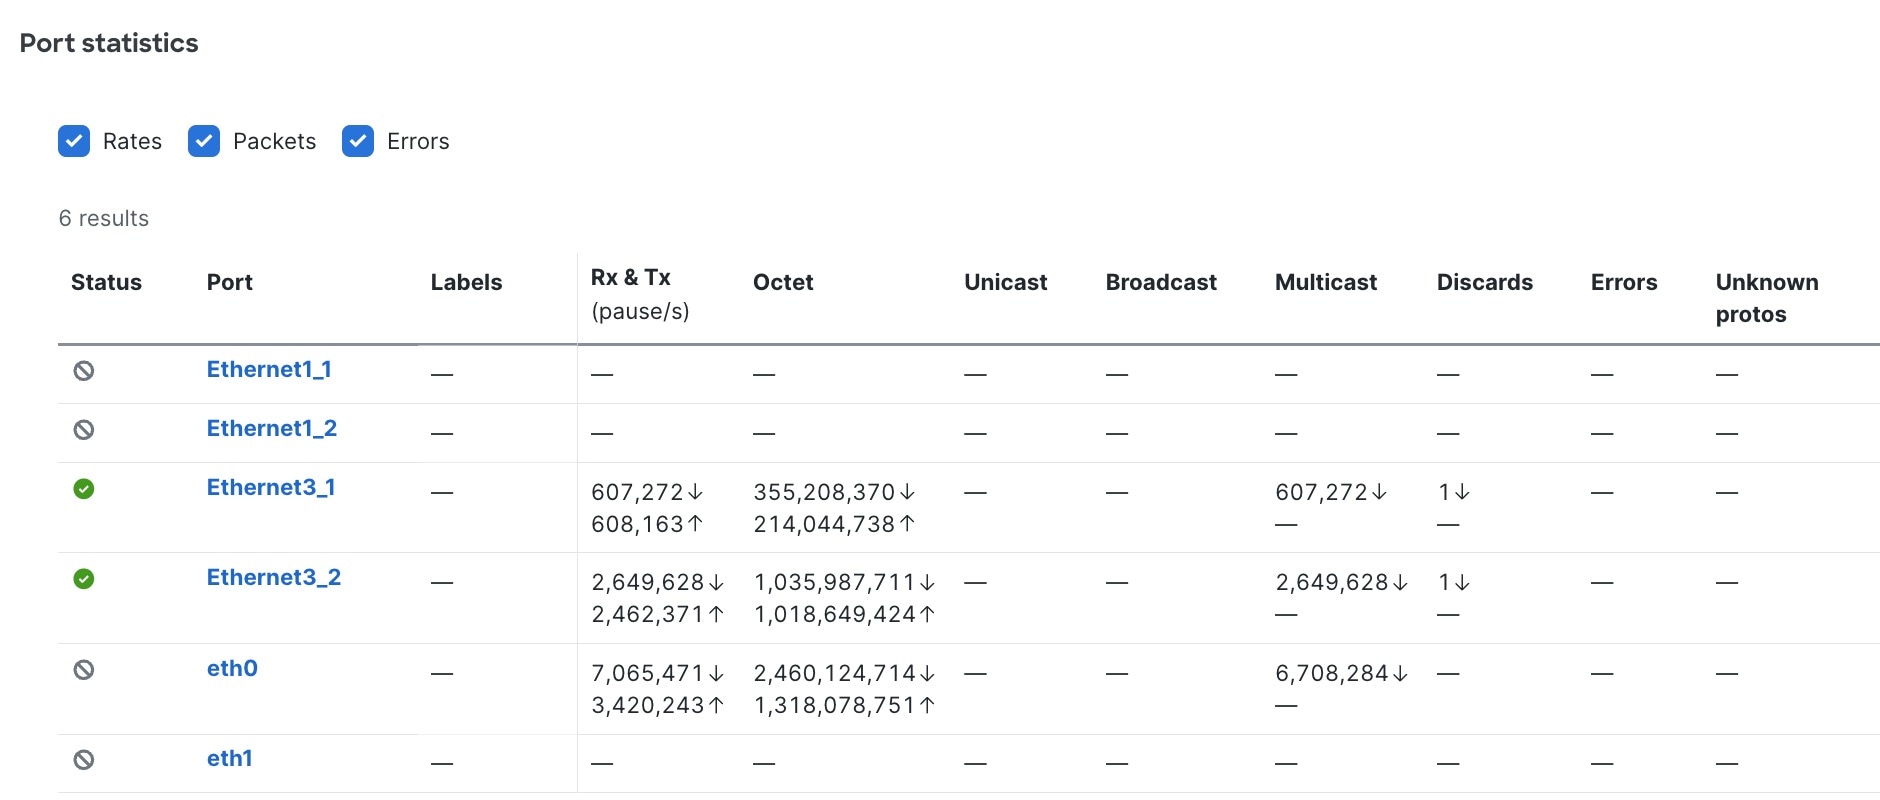
View port statistics
Monitoring server port statistics helps you understand the operational health and performance of network ports. It also helps identify potential issues, including physical layer problems, congestion, traffic anomalies, and security concerns.
Step 1 | Navigate to the server you are interested in.
|
Step 2 | In the Monitor area, select Port statistics. Each metric in the Port statistics table offers insights.
 |
Cabling
Cisco Nexus Hyperfabric automatically determines how you should cable the devices in a fabric based on the number of connections per device pair and cabling strategy. The cabling strategy comprises two notions.
The first notion comprises these things:
- Strict: Cisco Nexus Hyperfabric connects each device pair with the number of connections that you selected. If a device does not have enough available ports for any reason, Cisco Nexus Hyperfabric indicates that there is an error with the cabling.
- Best effort: Cisco Nexus Hyperfabric connects each device pair with the number of connections that you selected if possible. However, if a device does not have enough available ports for any reason, Cisco Nexus Hyperfabric connects the devices in the pair to other devices in the same switch group that have enough available ports.
The second notion comprises these things:
-
Dense: Cisco Nexus Hyperfabric connects consecutive ports of a device to consecutive ports of a paired device. The number of consecutive ports is equal to the number of connections per device pair that you selected. Cisco Nexus Hyperfabric repeats this connecting of consecutive ports for each successive paired device. This is used for switch-to-switch connections.
Switch-to-switch dense cabling strategy with two spine switches and two leaf switches 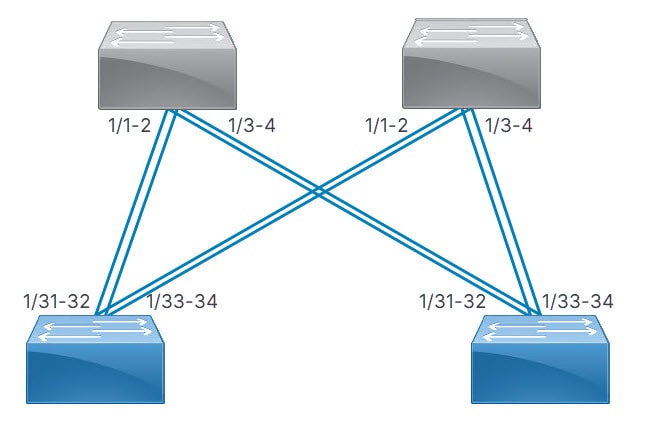
-
Distributed: Cisco Nexus Hyperfabric connects the first network interface card (NIC) of the first server to the first port of the first switch, then the second NIC of the server to the first port of the second switch, and so on until the server has one connection to the first port of each switch. Cisco Nexus Hyperfabric repeats this process with the successive servers, but the NICs connect to the successive port of each switch. After each servers' NICs are connected to each switch, the entire process repeats until there are a number of connections from each server to each switch equal to the specified number of connections.
Server port groups that have GPUs also use the distributed cabling strategy. In the rail group properties, these servers have width equal to the number of GPU servers and a count of 8.
With or without GPUs, the same NIC number on each server connects to the same switch. Thus, for a fabric with two servers (server1 and server2) and two switches (switch1 and switch2), NIC1 of both servers connect to switch1 while NIC2 of both servers connect to switch2.
Switch-to-server distributed cabling strategy with two leaf switches and two servers 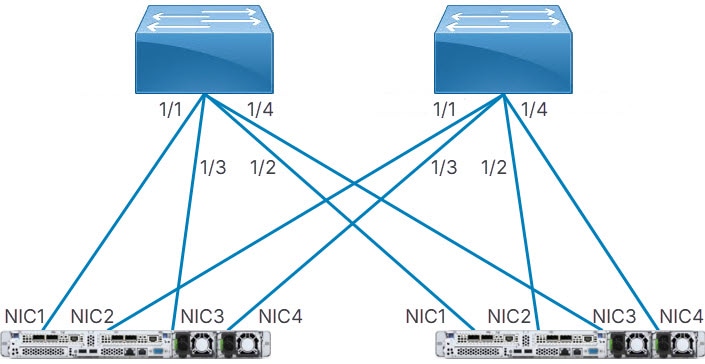
If your fabric includes connections between devices in the same switch group or server group, Cisco Nexus Hyperfabric allocates ports to device pairs in different groups first, then allocates ports to devices in the same group.
Server cabling
For uplink redundancy with servers that do not have GPUs, the cabling strategy is always distributed. The connections go from the ports of the switches to the ports of the network interface cards (NICs) of the servers.
Server port groups that have GPUs also use the distributed cabling strategy. In the rail group properties, these servers have width equal to the number of GPU servers and a count of 8.
In either case, the same NIC number on each server connects to the same switch. Thus, for a fabric with two servers (server1 and server2) and two switches (switch1 and switch2), NIC1 of both servers connect to switch1 while NIC2 of both servers connect to switch2.
Because switch-to-server connections are distributed, each subsequent NIC of a server connects to a different switch until all switches have one connection from different NICs of each server. After that, the next NIC of each server connects to the first switch and the process repeats.
Continuing the example, if you selected two connections, server1 has these connections:
- NIC1 to switch1
- NIC2 to switch2
- NIC3 to switch1
- NIC4 to switch2
Server2 has the same connections, but to different ports of the switches.
View cabling topology
You can view a graphical representation of the cables in a fabric and related device group connection information.
Step 1 | Choose Fabrics, then click the fabric you want to view cabling for. Cable connections appear as colored lines joining different device groups. Each number on a cable indicates the number of connections between device groups. 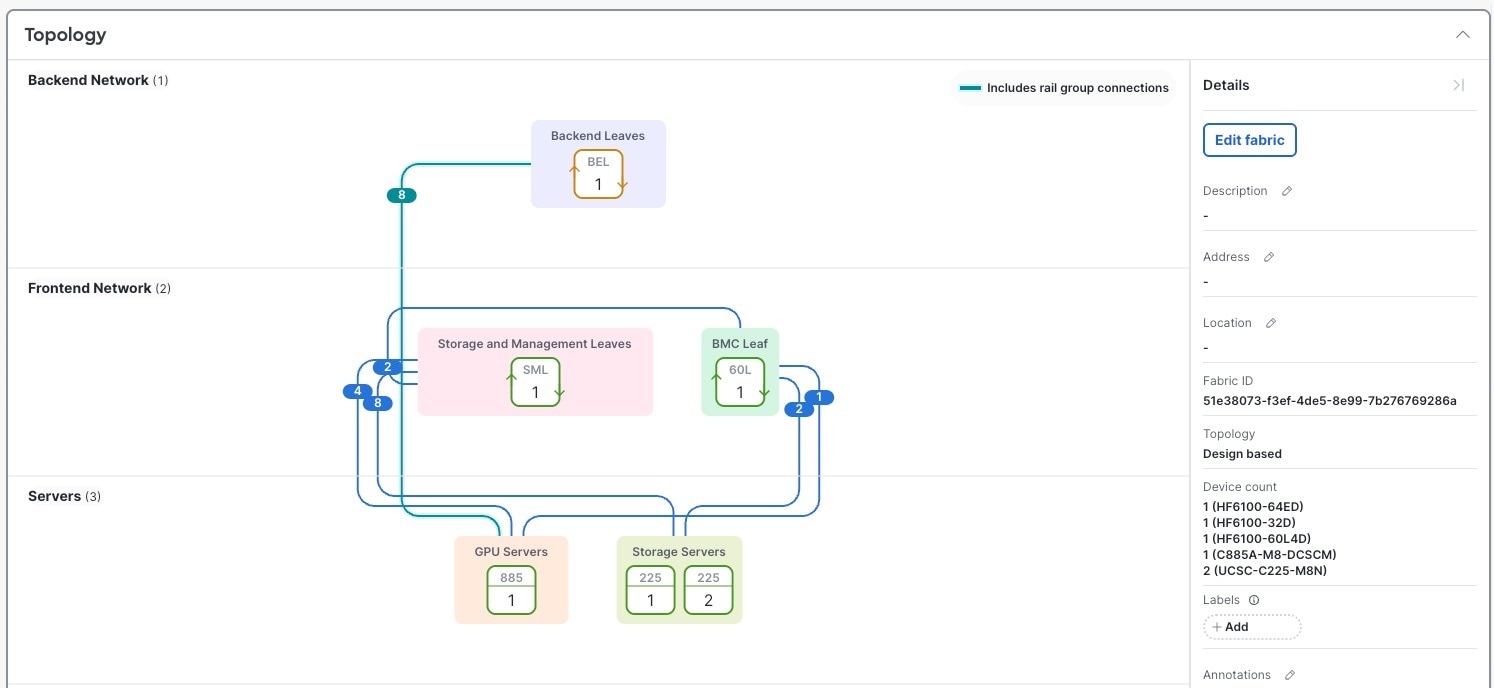 |
Step 2 | Click the number on a cable you are interested in. The Cabling drawer lists all connections for the selected cable. Each connection shows the device group names, device names, and interfaces. 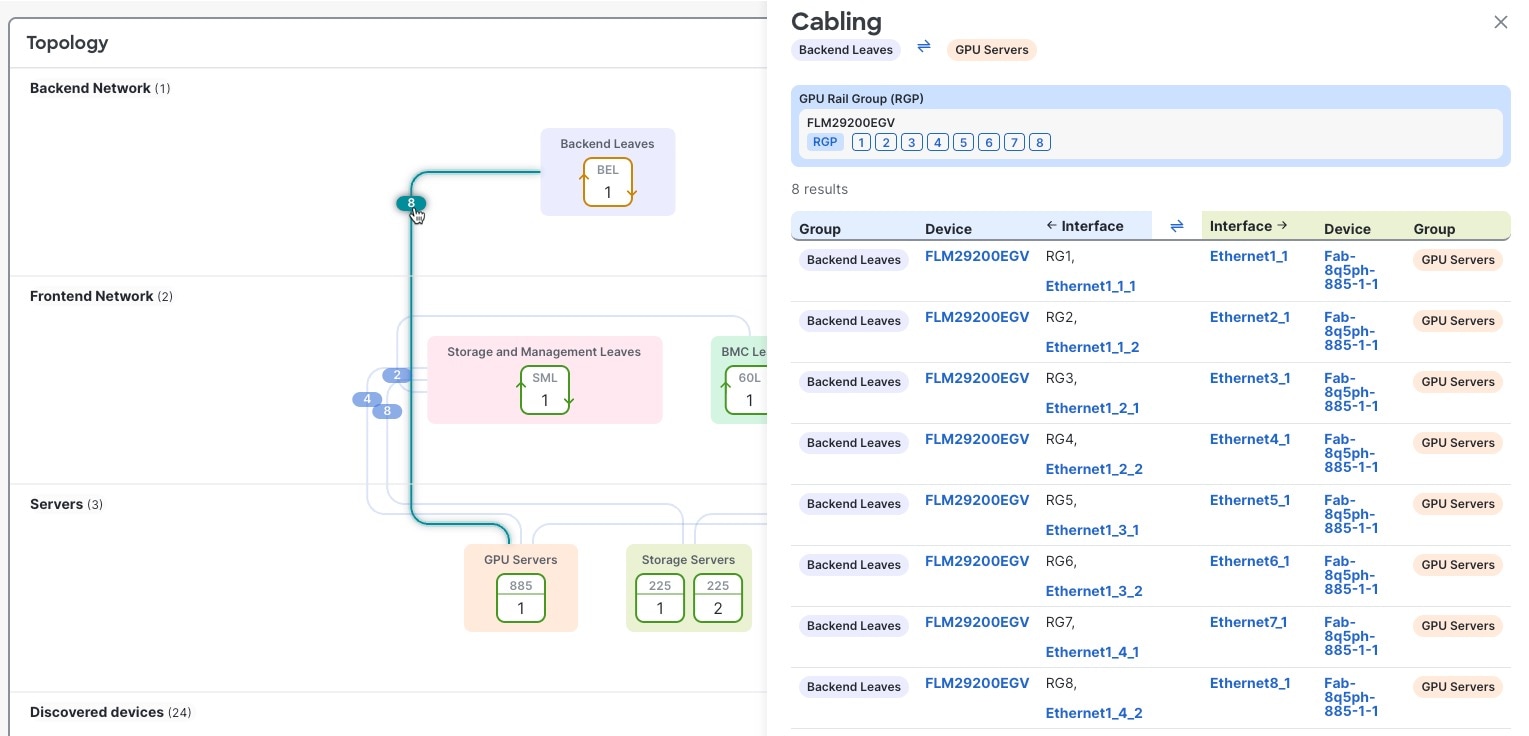 |
Modify cabling
You can view, export, and modify all fabric connections associated with a switch.
Step 1 | Navigate to the switch you are interested in.
|
Step 2 | In the Configure area, select Cabling. The Cabling table lists all fabric connections associated with the switch. To export this list, select Export CSV. |
Step 3 | Click Edit cabling. |
Step 4 | To modify switch group connections:
|
Step 5 | To modify rail groups, you can add a new rail group or modify these fields:
|
Step 6 | To modify server port group to switch group connections, you can edit these fields:
|
Step 7 | Select Save fabric blueprint to save configuration changes. |
Step 8 | Select Run cabling to apply configuration changes. |
 ) and select the PID for the pluggables.
 Note
Note