
Cisco Nexus Hyperfabric — Assertions
Assertions
An assertion is a statement used to test assumptions that Cisco Nexus Hyperfabric makes. Fabric assertions are system checks that continuously monitor the health, stability, and performance of the fabric. They serve as early warning signals, detecting conditions that may affect connectivity, reliability, or overall operations. Consider assertions as automatic checks to make sure the fabric is behaving the way it is supposed to be. By surfacing issues at the device, port, and fabric levels, assertions allow you to identify and resolve problems before they escalate.
Fabric assertions in Cisco Nexus Hyperfabric provide a consistent way to monitor the health of your fabric and quickly identify issues at the device, port, and fabric levels. You can also view fabric assertions over time correlating assertion activity with configuration changes in the Event viewer.
Assertion conditions
There are four evaluation assertion conditions:
- True : This is the expected condition and there are no issues detected.
- False : This is an unexpected condition and there are issues detected that can cause operation disruption.
- Warning : This is an unexpected condition and there are issues detected, but should not cause operation disruption.
- Unknown : There isn't enough information to evaluate the assertion condition.
Scenarios that trigger an assertion error
These are scenarios when an assertion evaluates to false, triggering an error:
- There is a deviation from the configuration of the blueprint.
- Devices or neighborships are not operating as expected.
- Routes or next hops cannot be validated.
Latched and unlatched assertions
Specifying latched and unlatched assertions helps you focus on issues that need attention and could signal a larger problem. All assertions are initially unlatched. The system latches certain types of assertions automatically after 90 seconds.
An unlatched assertion is a suppressed assertion. Even if a condition evaluates as false and triggers an error, the unlatched assertion does not send notifications or raise alerts like a latched assertion. If you are not seeing or receiving notifications of critical assertions, check whether the assertions are latched. If they are not latched, you can manually force a latch.
Unlatched assertions will not propagate visually to the fabric topology level. Only latched assertions are shown at the fabric topology level. To view a list of assertions, regardless of whether they are latched or unlatched, set filter criteria in the Assertions page. By default, the Assertions page only lists latched assertions that are either in critical or warning states.
View assertions
Assertion status and colors
Each assertion condition and status is represented in the UI with corresponding colors to provide a quick way to identify the severity of an issue.
|
Assertion condition |
Assertion status |
Assertion icon |
Assertion color |
|
true |
OK |
|
green |
|
unknown |
unknown |
gray |
|
|
warning |
warning |
yellow |
|
|
false |
critical |
red |
Assertion status tags, icons, and badges
These examples show the different status tags, icons, and badges available in the UI.
- Devices outlined in color: The color indicates the assertion status with the highest severity among all assertions in the selected device (SP2).
- Device assertion status tags: Shows the total number of latched assertions with the same assertion status on the device.
- Device, port, and network status tags: Shows the number of latched assertions for each assertion status that was detected for all devices, ports, or network in the fabric (FabricABC).
- Assertion condition status icon: Shows the assertion status of the highest severity of all assertions in the associated device.
- Assertion alert badges: Shows the total number of latched assertions with the highest severity. Alert badges appear next to category headers and are color-coded to match the condition status.
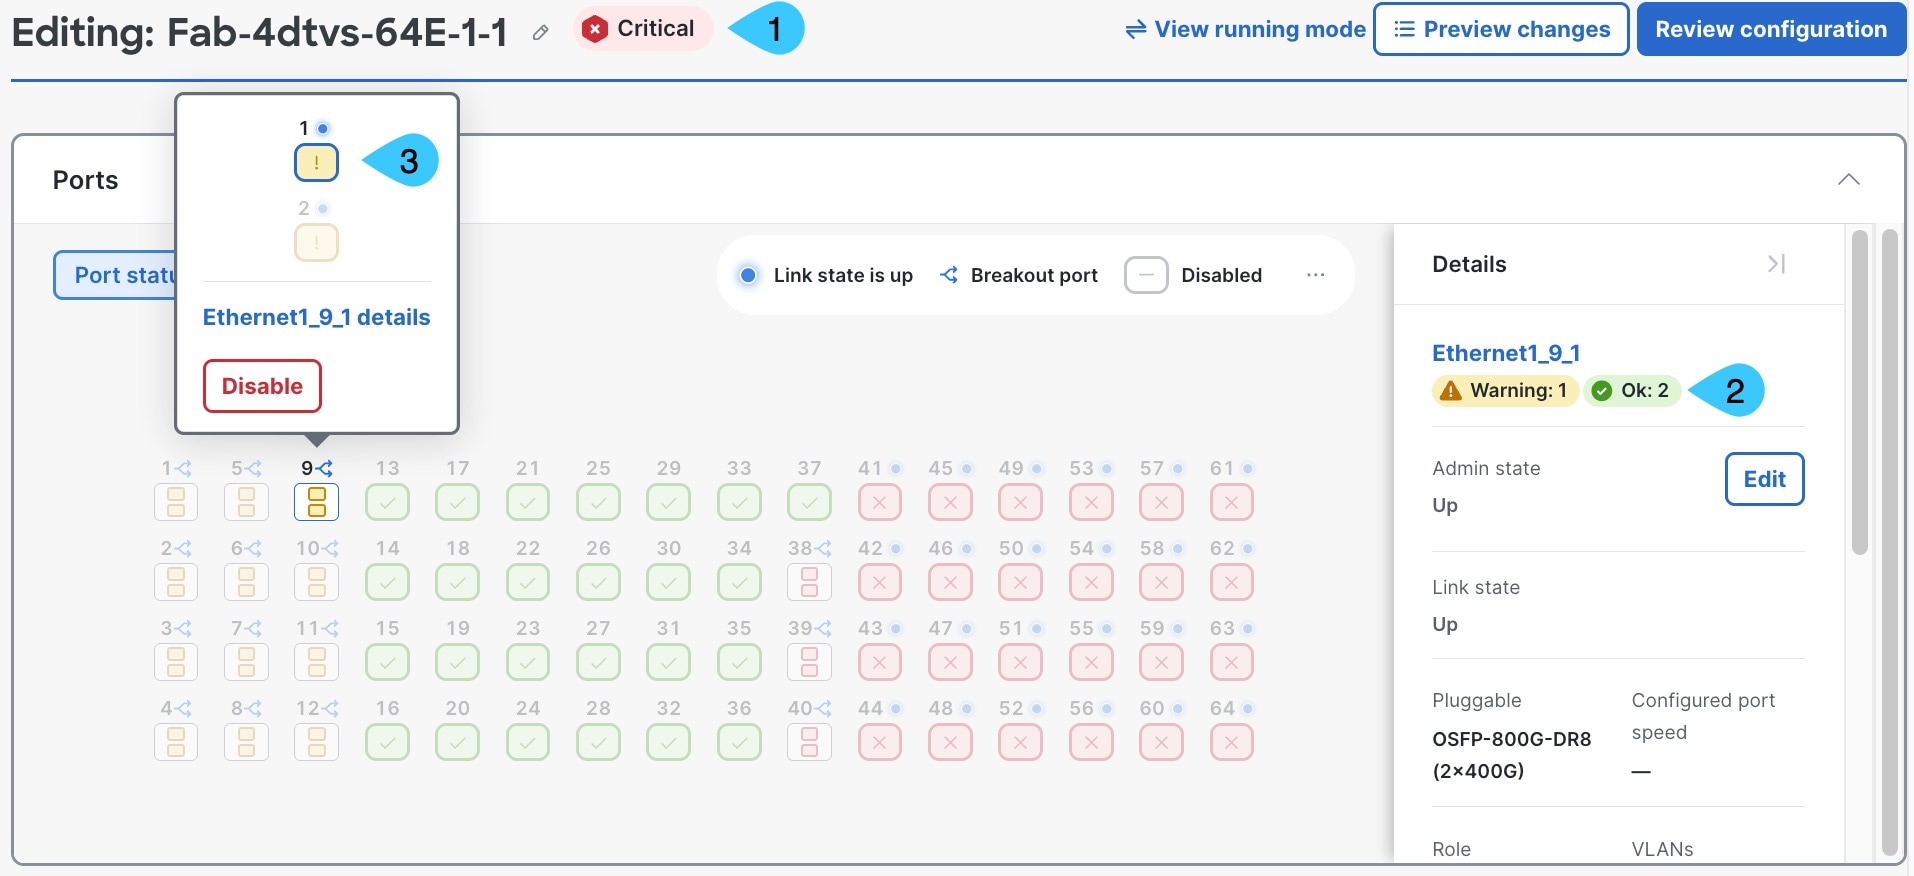
- Device assertion status tags: Shows the highest severity of all port assertions in the device. Color matches the assertion status.
- Port assertion status tags: Shows the number of latched assertions for each assertion status that was detected for the port (Ethernet1_9_1).
- Port status icons: Port color matches the assertion status of the highest severity of all assertions in the port. Ports with critical assertions blink red. The breakout port in this example has two warning assertions.
View fabric assertions
You can view the assertions across the entire fabric to see all device, port, and network issues. You can also view fabric assertions over time correlating assertion activity with configuration changes in the Event viewer.
Follow these steps to view the assertions of a fabric.
Step 1 | Choose Fabrics. The Fabric page shows all fabrics within an organization. All devices with latched assertions are outlined with a color indicating the assertion status. 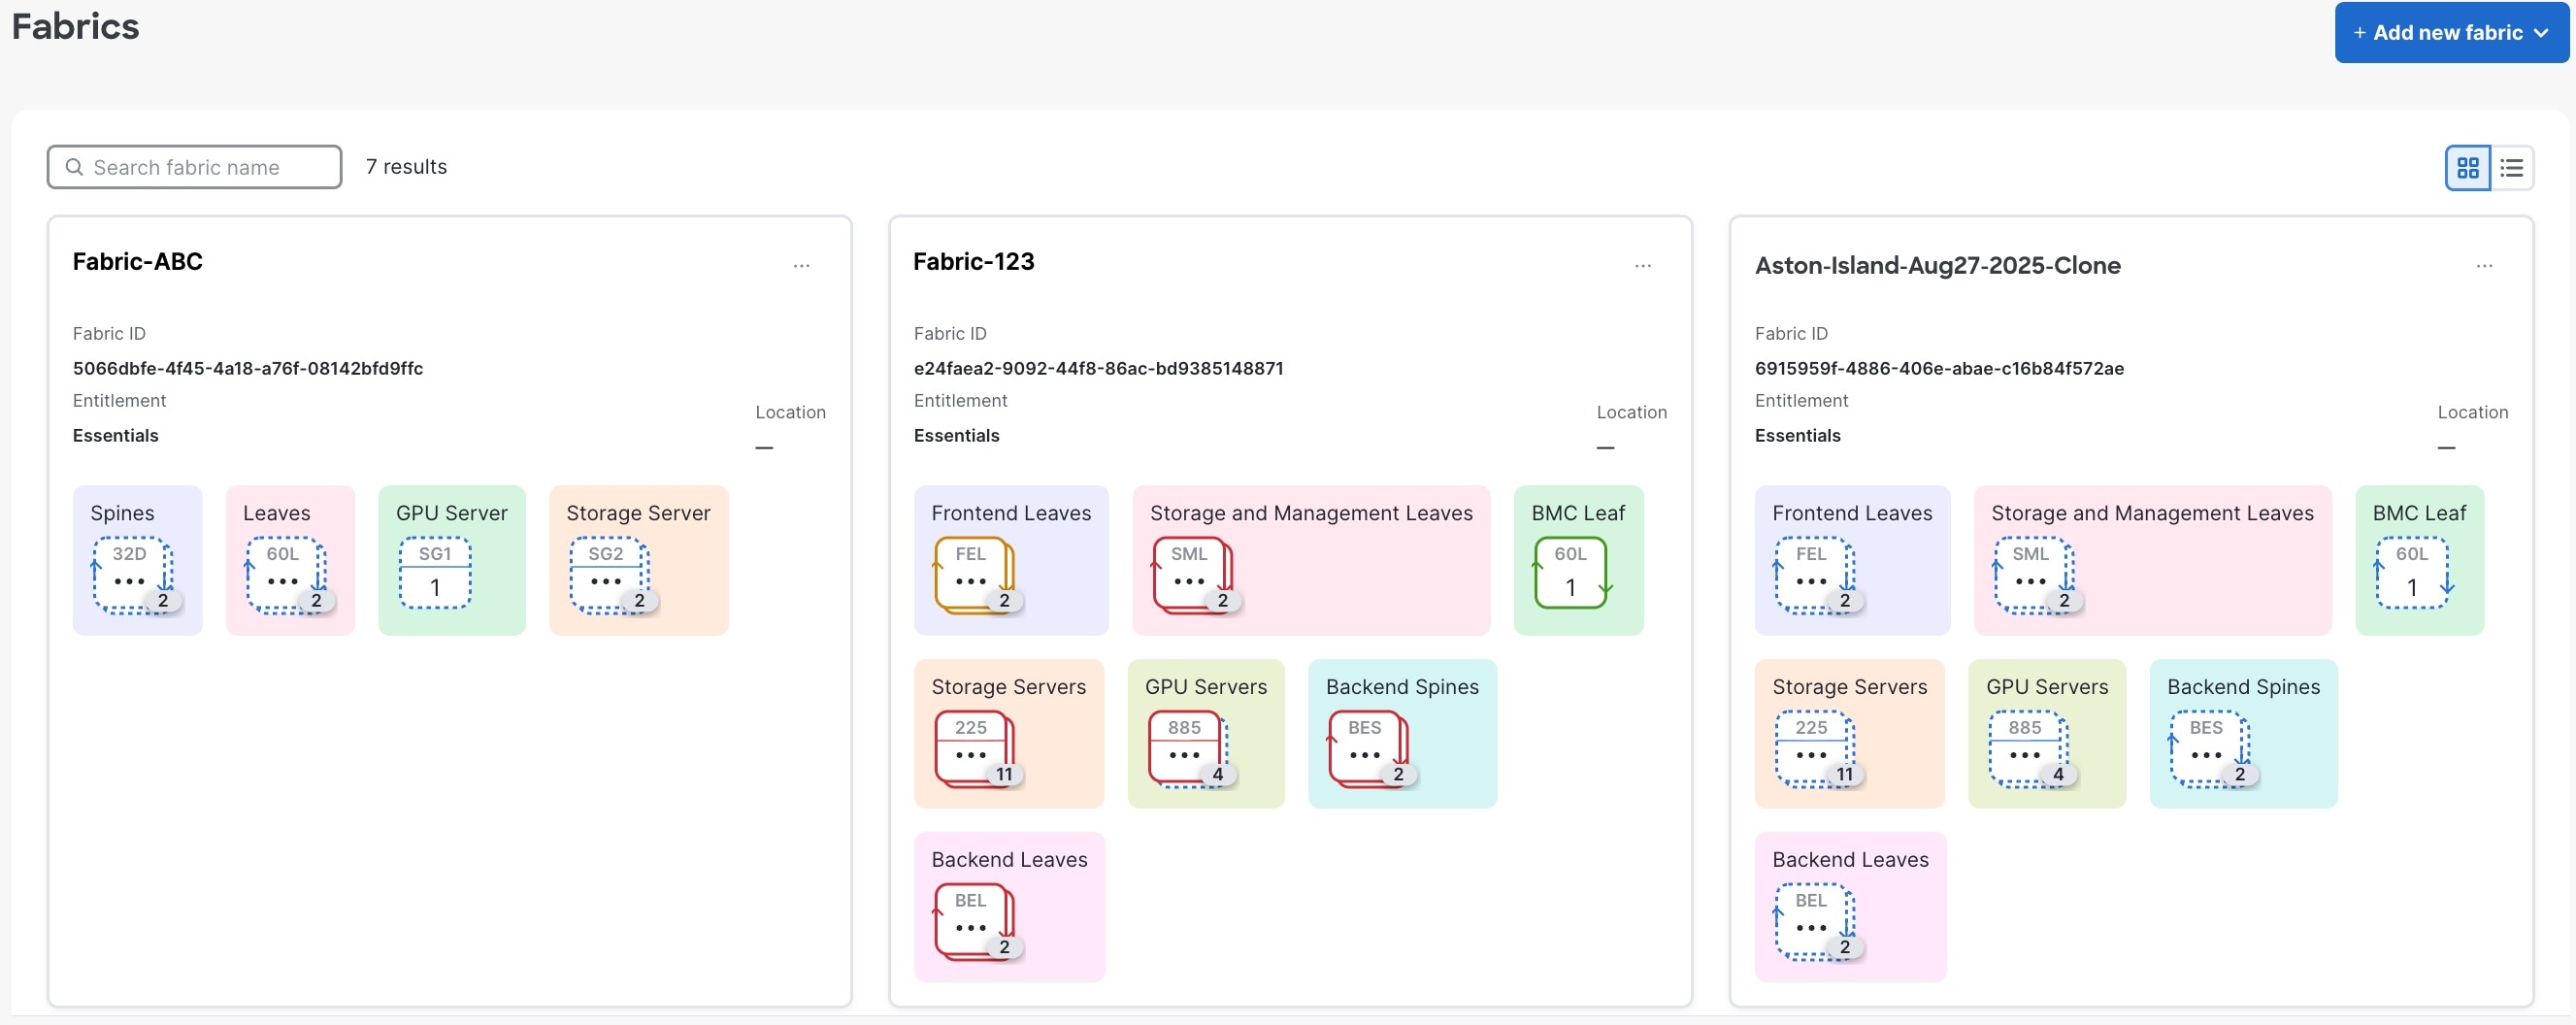 |
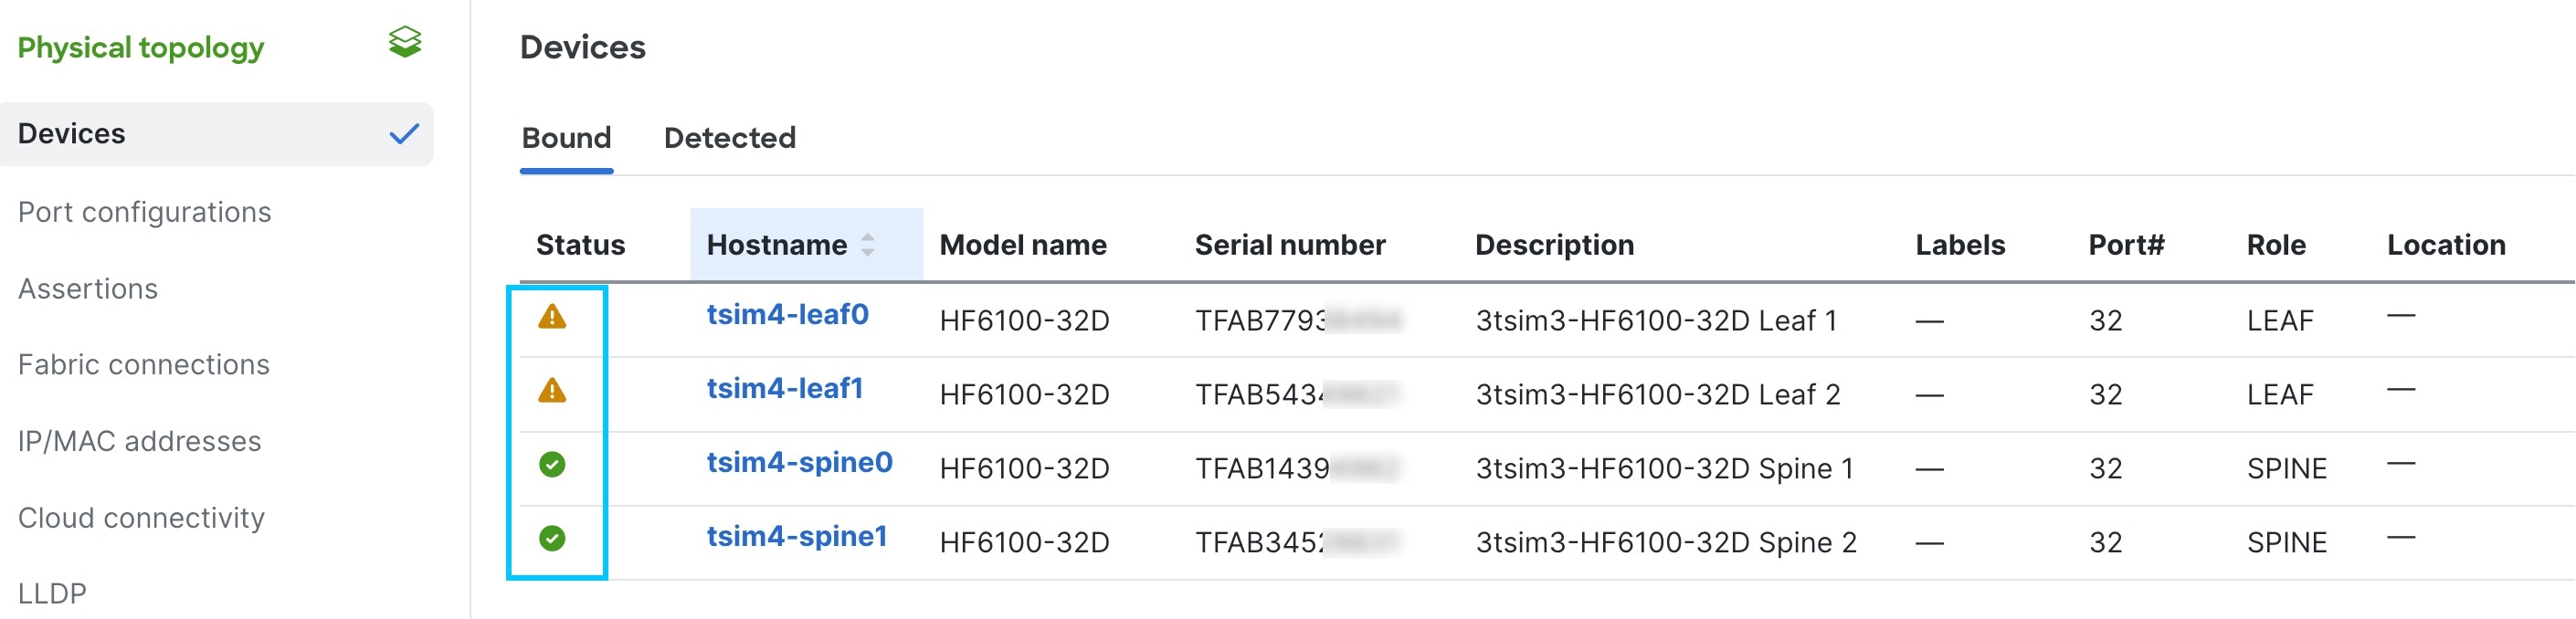
Step 2 | Select the fabric you want to view assertions for. The Devices - Bound tab shows device details and assertion icons indicating the highest severity assertion found in each device.
|
Step 3 | In the Physical topology area, choose or . 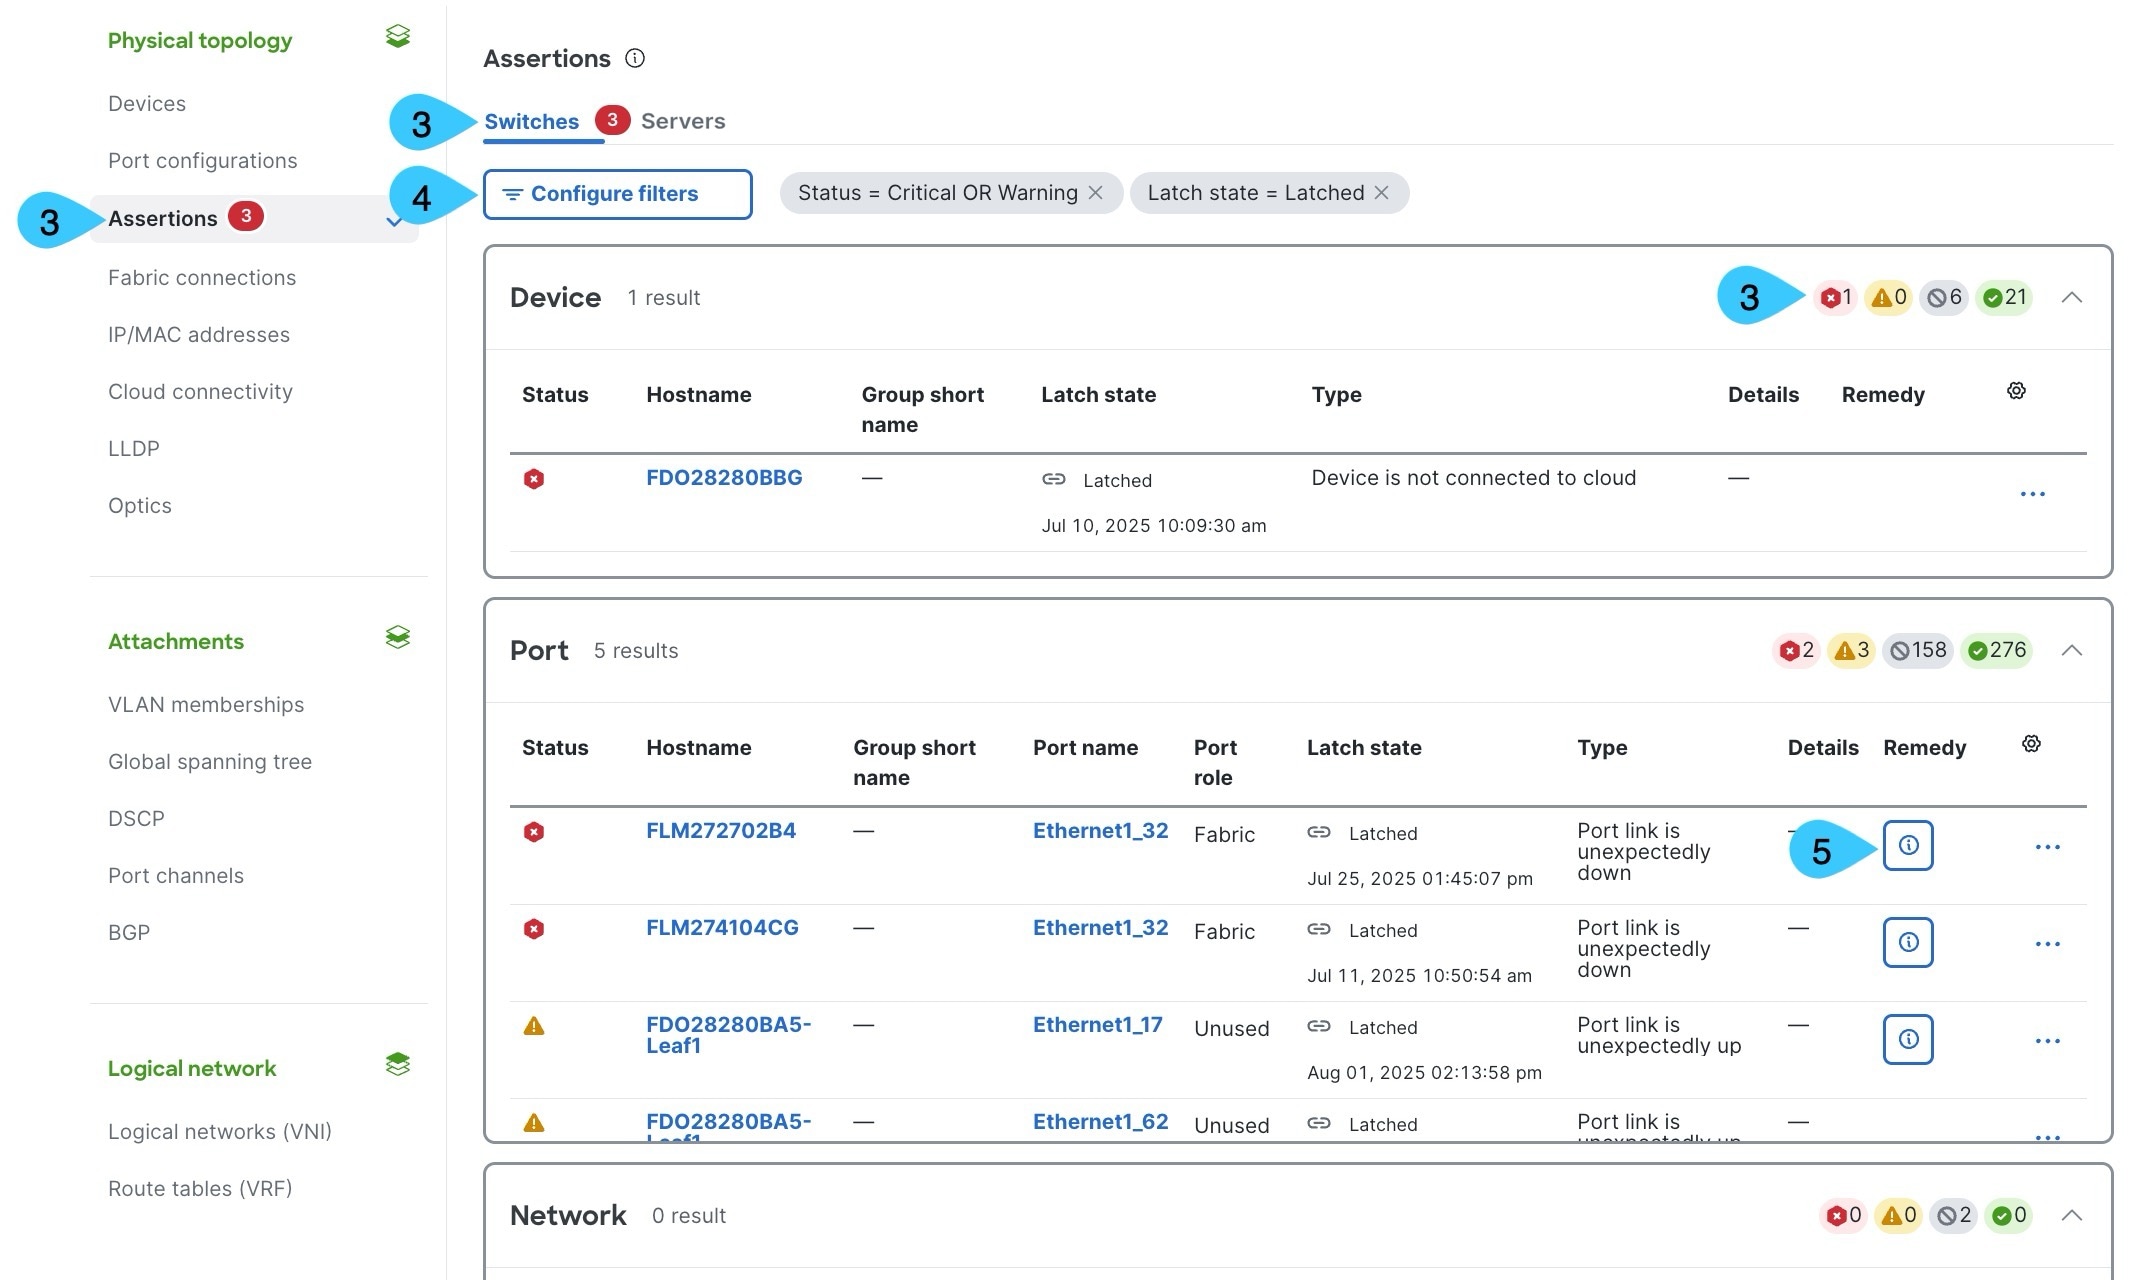
|
Step 4 | To customize the list of assertions you see, select Configure filters and use the drop-down lists to add or remove filter criteria. |
Step 5 | If the options are available:
|

View device assertions
You can view the assertions of a specific device to see the issues for only that device.
Follow these steps to view the assertions of a device.
Step 1 | Choose Fabrics, then select the fabric that has the device assertions. |
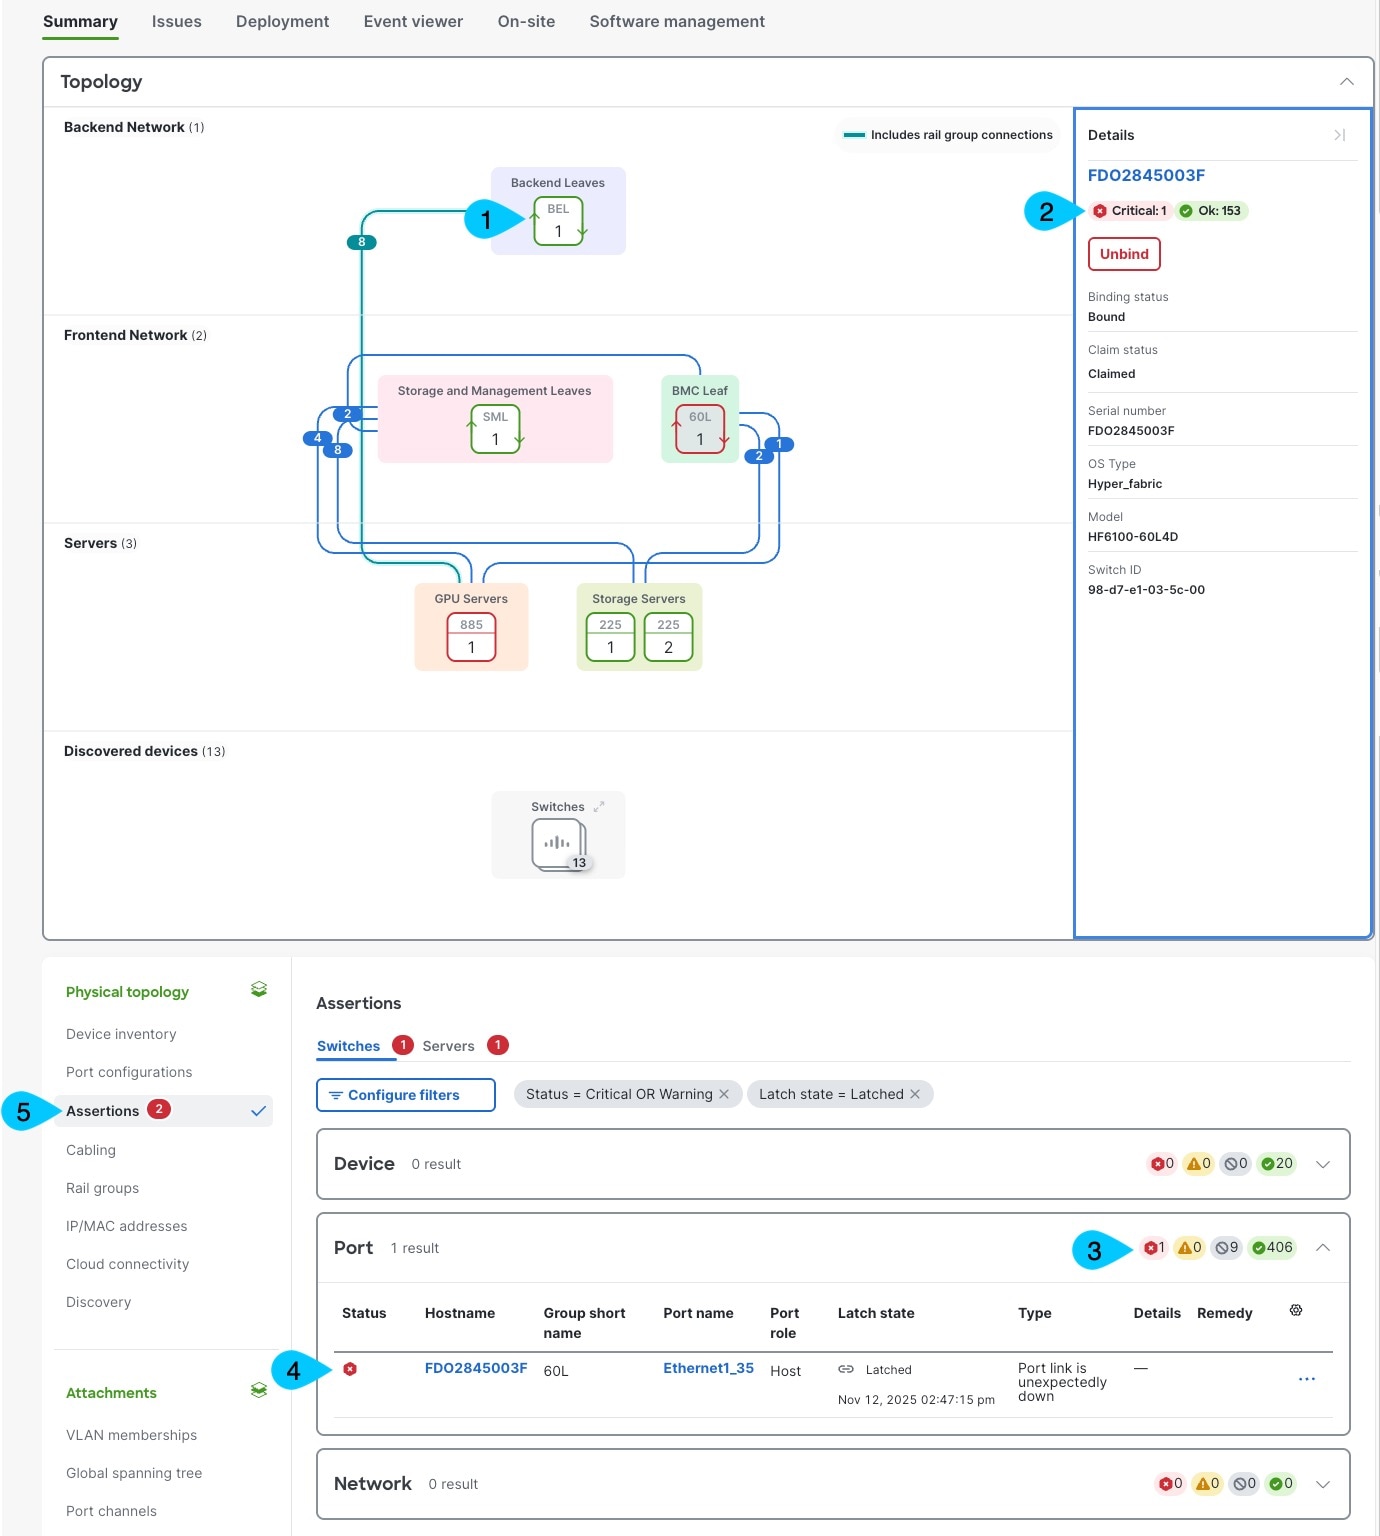
Step 2 | In the Topology area, select the device for which you want to view its assertions. Device details appear including the number of assertions for each assertion status on that device. 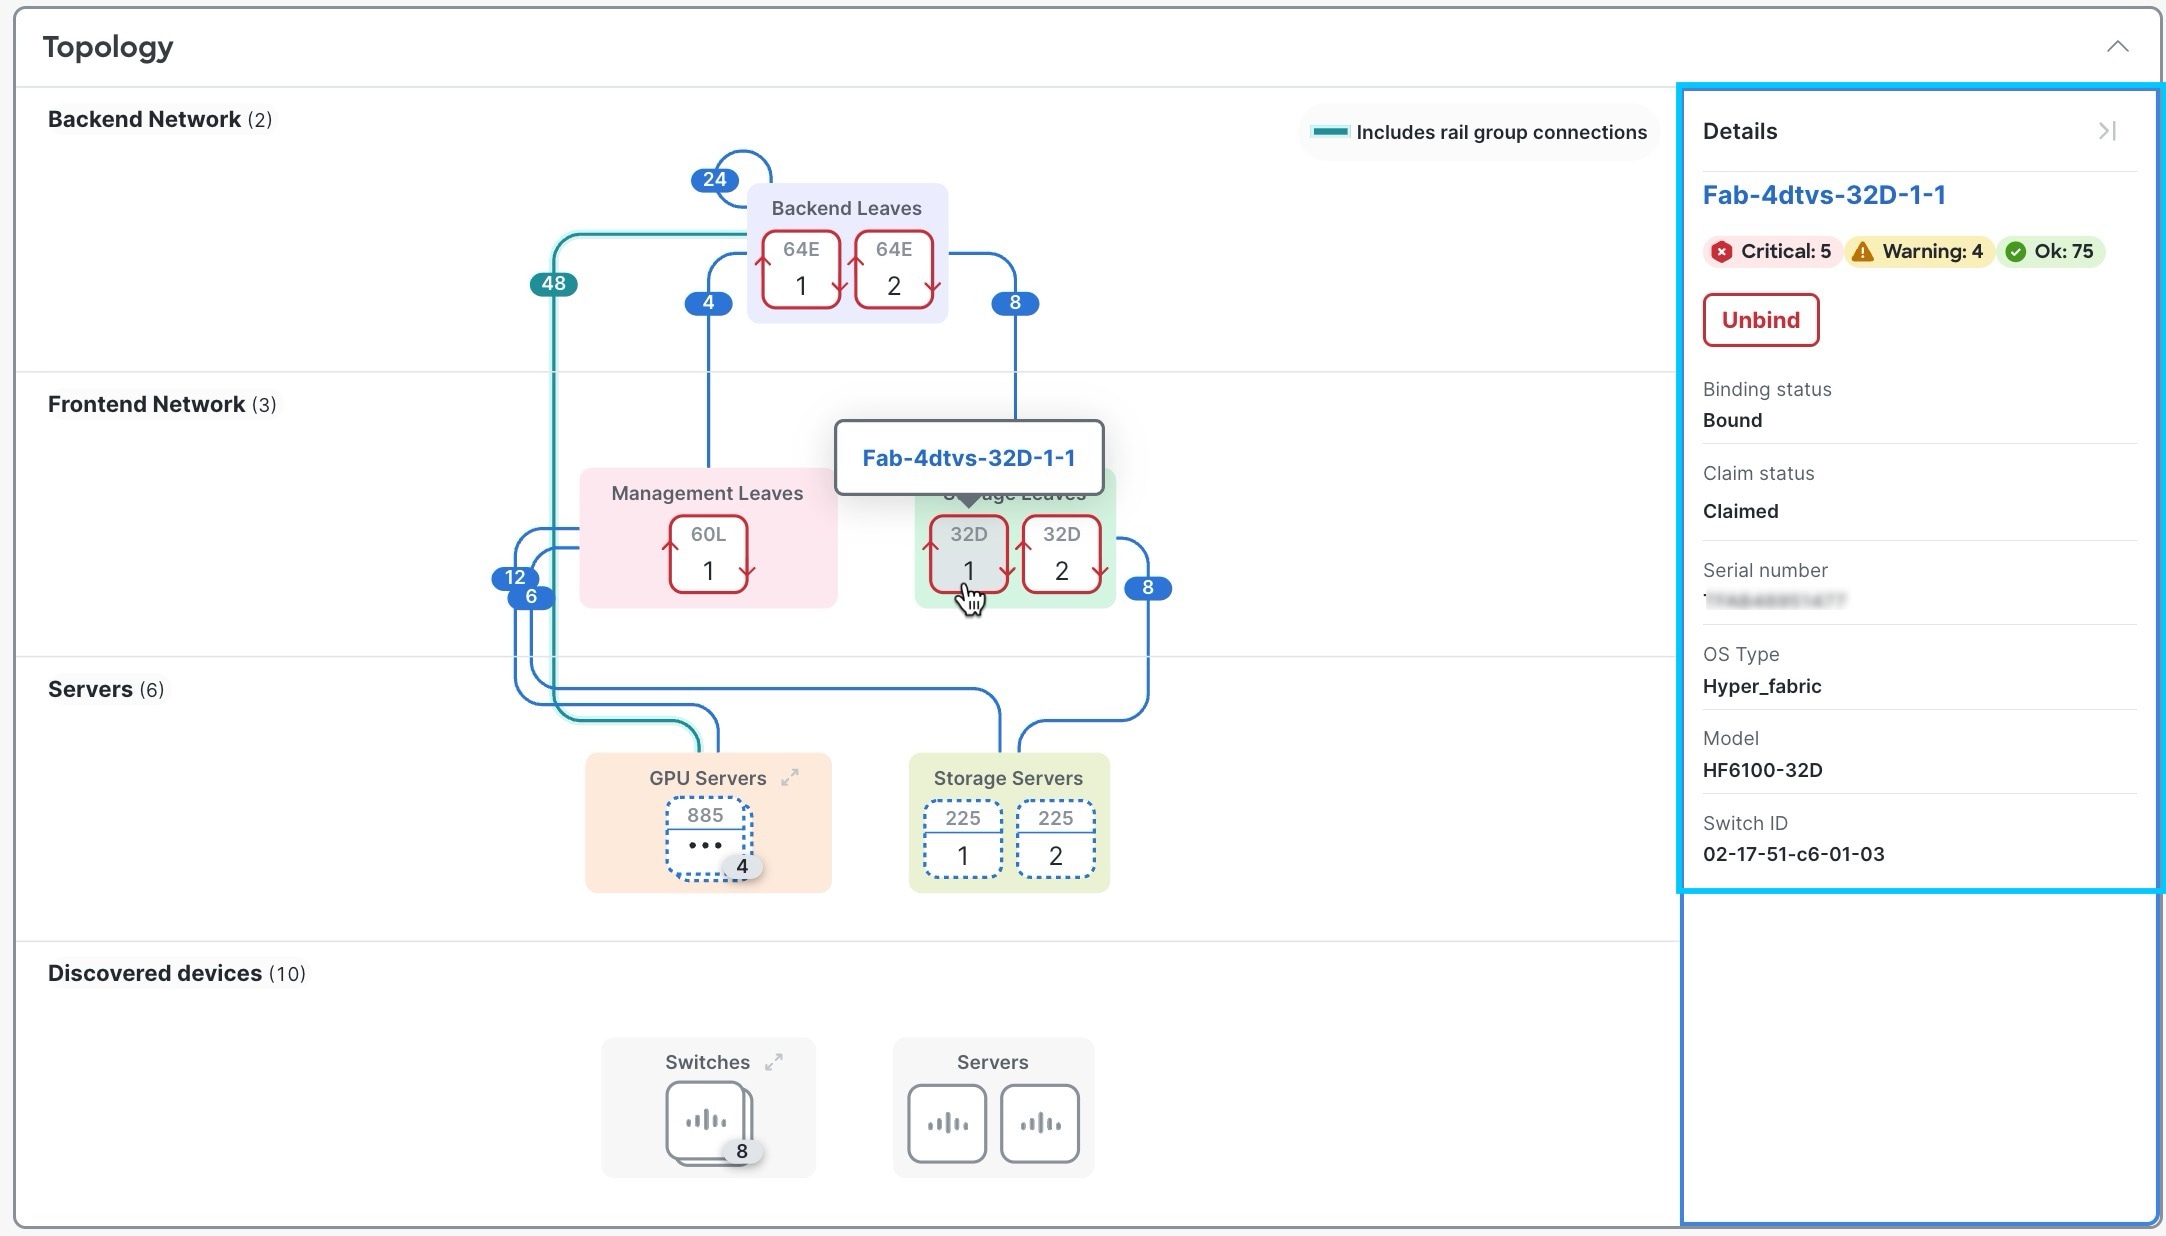 |
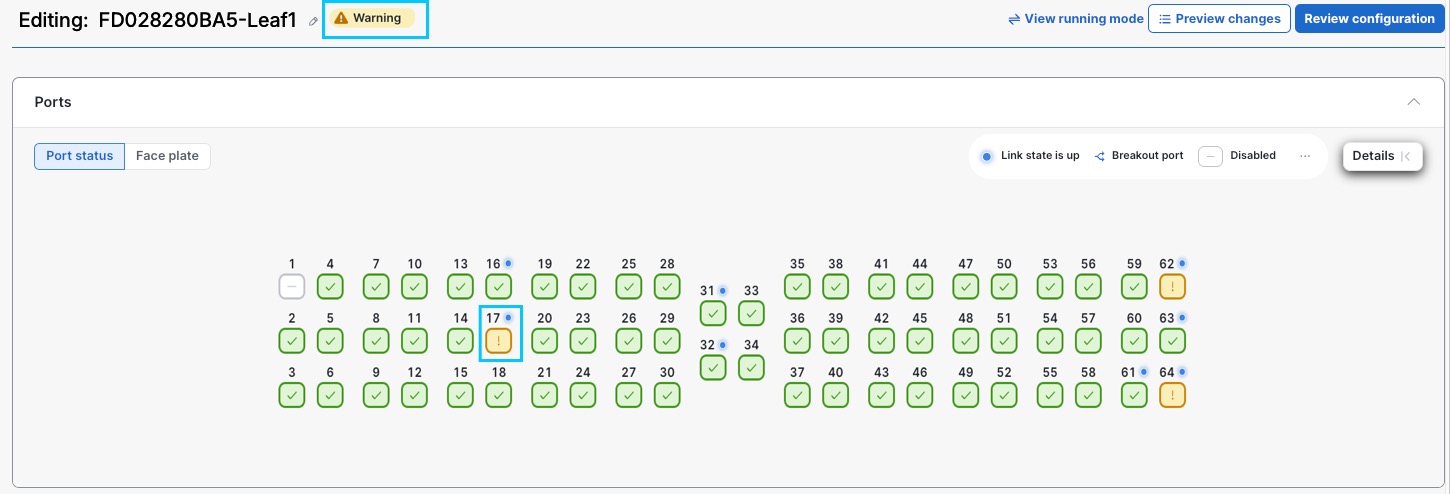
Step 3 | Select the device name. A graphical representation of the device's port status appears. The device assertion status tag shows the highest severity of all port assertions in the device. |
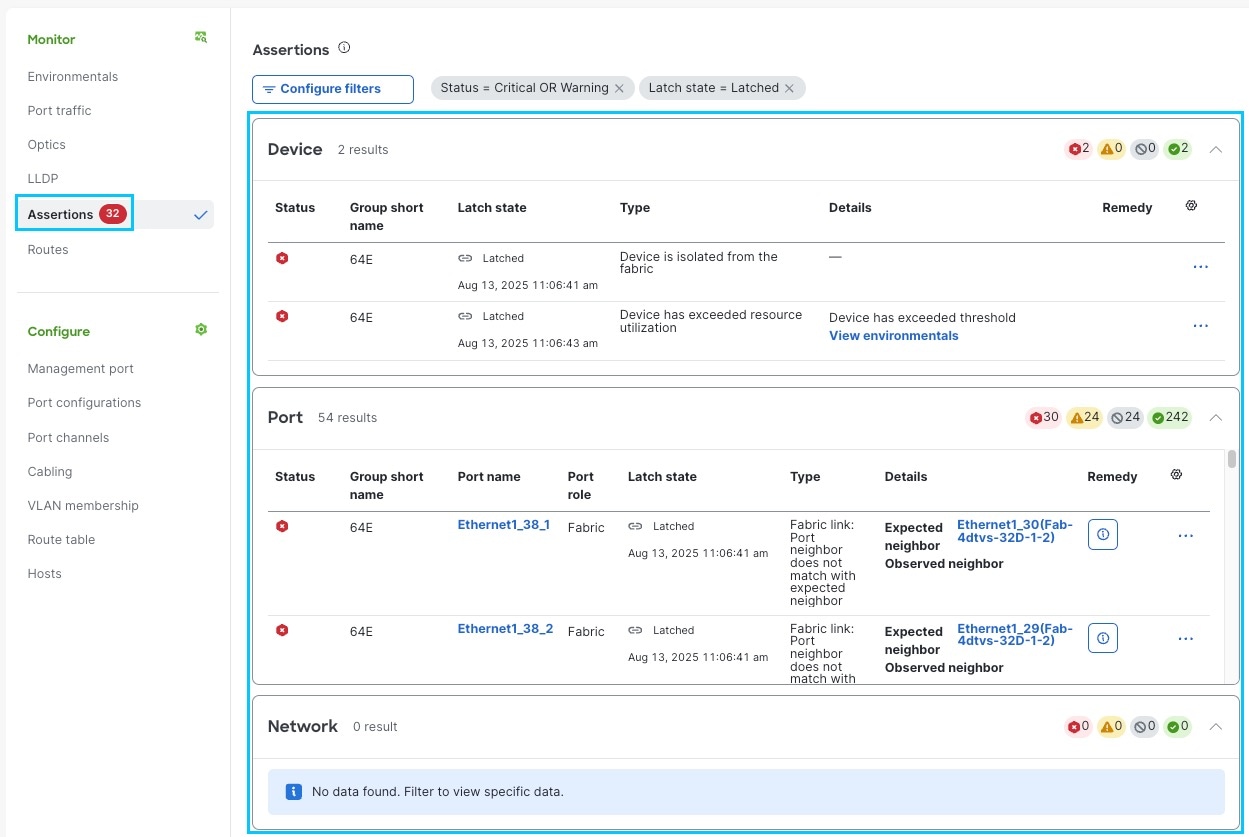
Step 4 | In the Monitor area, choose Assertions
. Assertion details appear for that device.
|
Step 5 | If the options are available:
|
Step 6 | To change the list of assertions you see, select Configure filters and use the drop-down lists to add or remove filter criteria. |
View port assertions
You can view assertions only for a specific port.
Step 1 | Choose Fabrics, then select the fabric that has the port you want to view assertions for. |
Step 2 | In the Topology area, select the device, then select the device name. |
Step 3 | To investigate an assertion further and review port details, select the port, then select the port name. 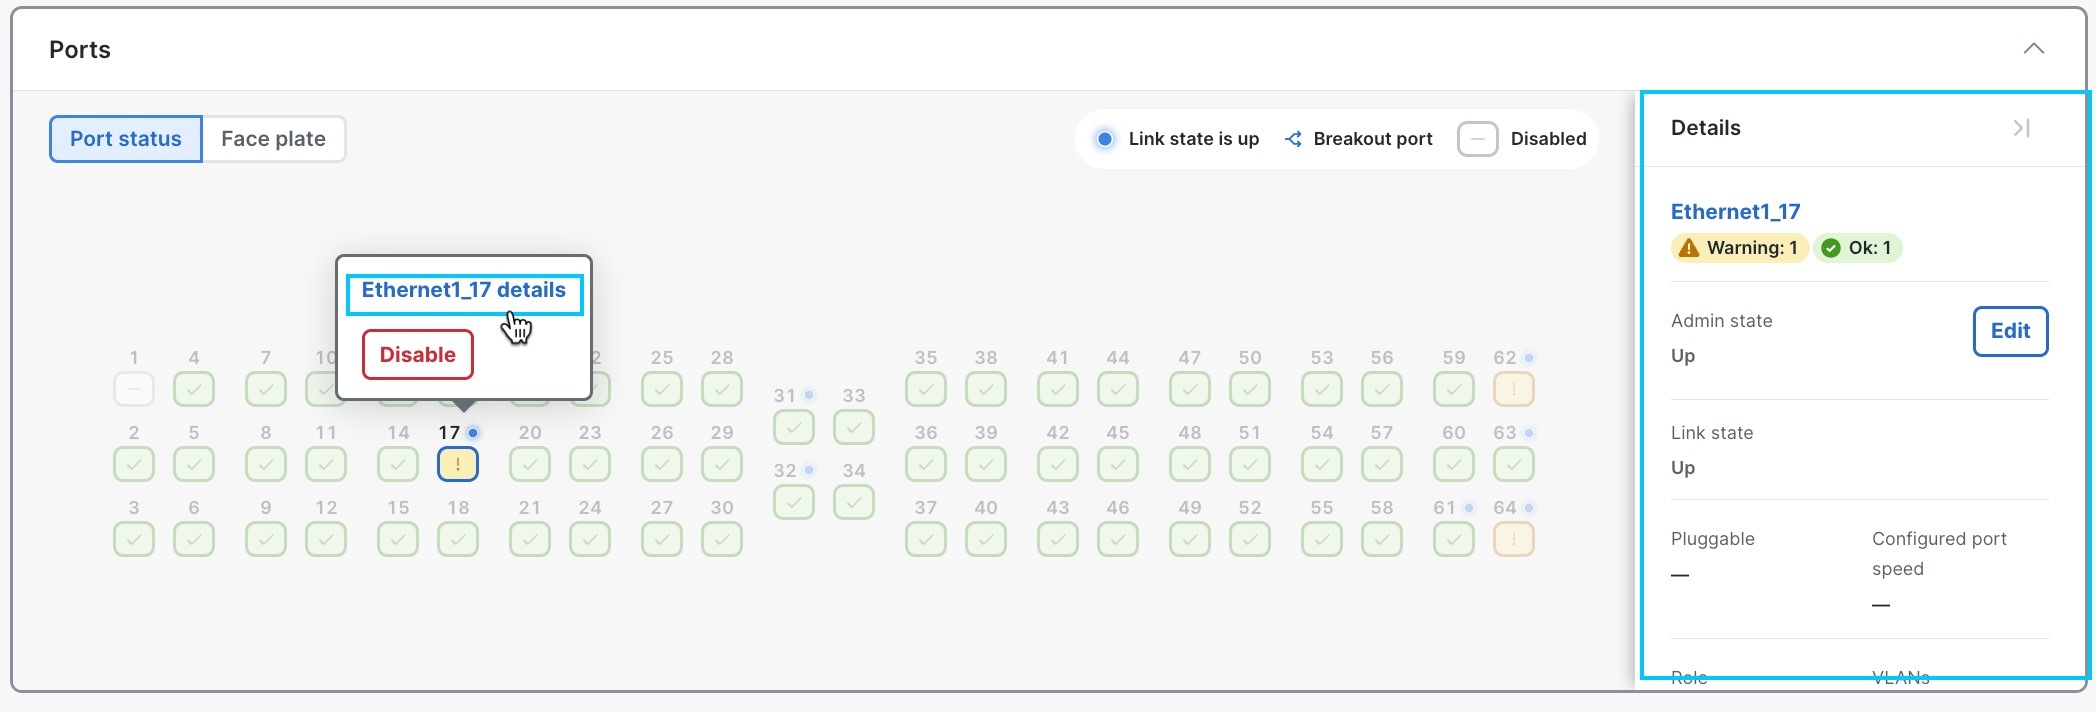 Port information appears, such as configurations, state, and traffic details. The type of details that appear depend on the device. 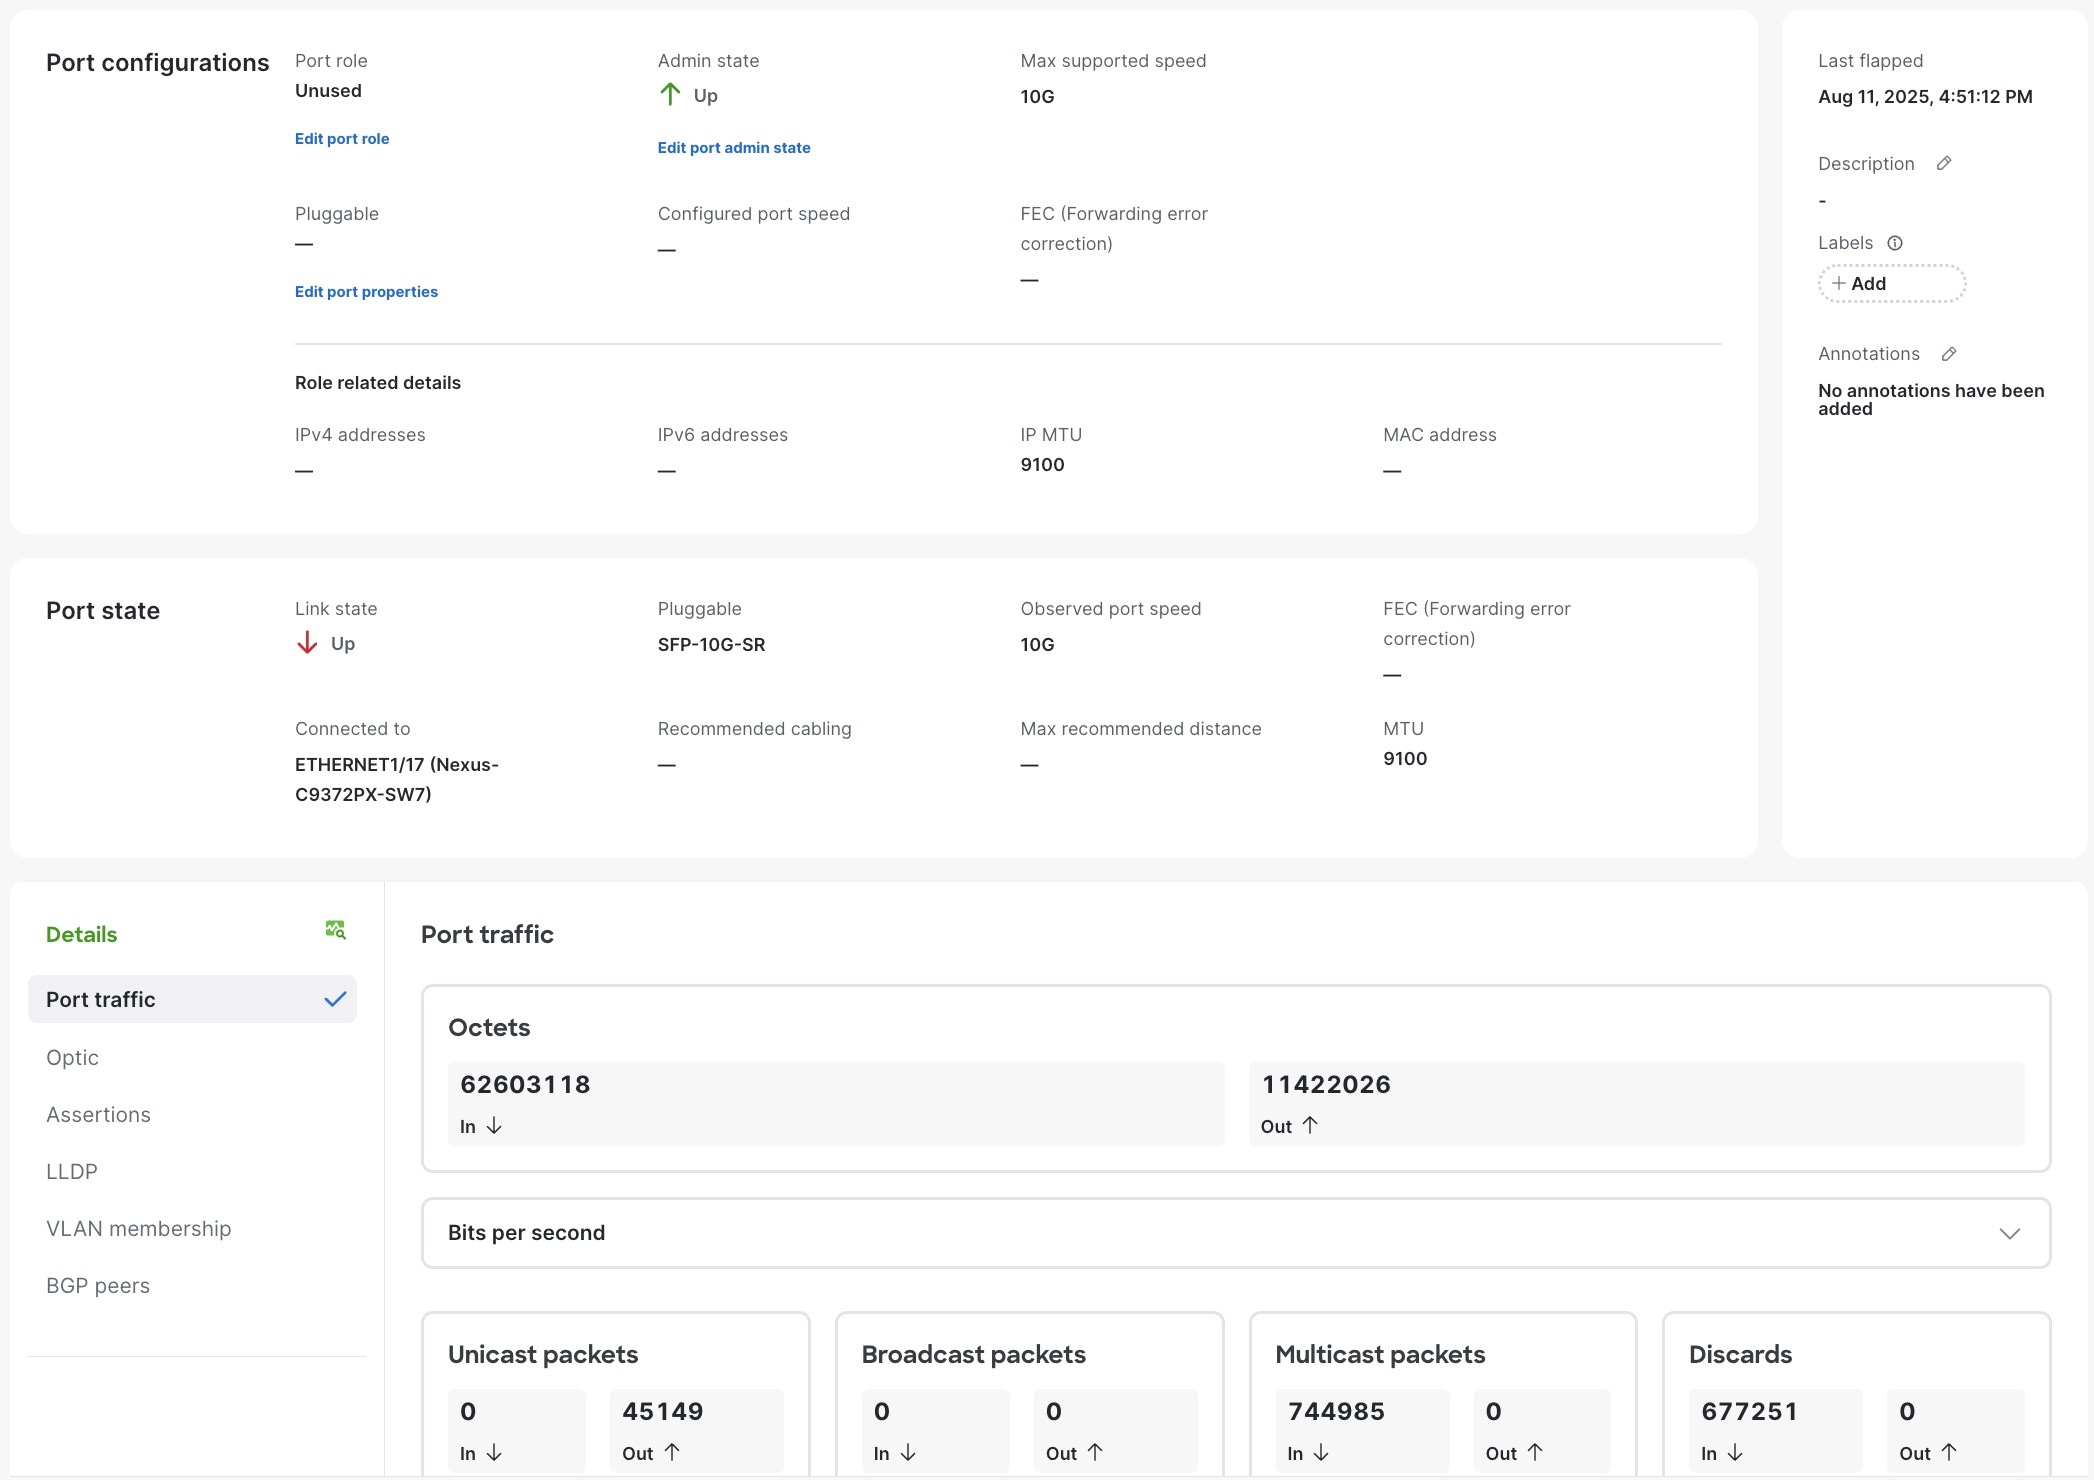 |
Latch or unlatch an assertion manually
Follow these steps to manually latch or unlatch an assertion.
Step 1 | Choose Fabrics, then select the fabric that has the assertion you want to modify. |
Step 2 | In the Physical topology area, select Assertions. By default, only latched assertions for devices, ports, and the network with critical or warning states are listed in the Assertions page. |
Step 3 | To change the list of assertions you see, select Configure filters and use the drop-down lists to add or remove criteria. |
Step 4 | From the ellipsis drop-down list of an assertion, select Unlatch or Force Latch, depending on the modification you want to make. 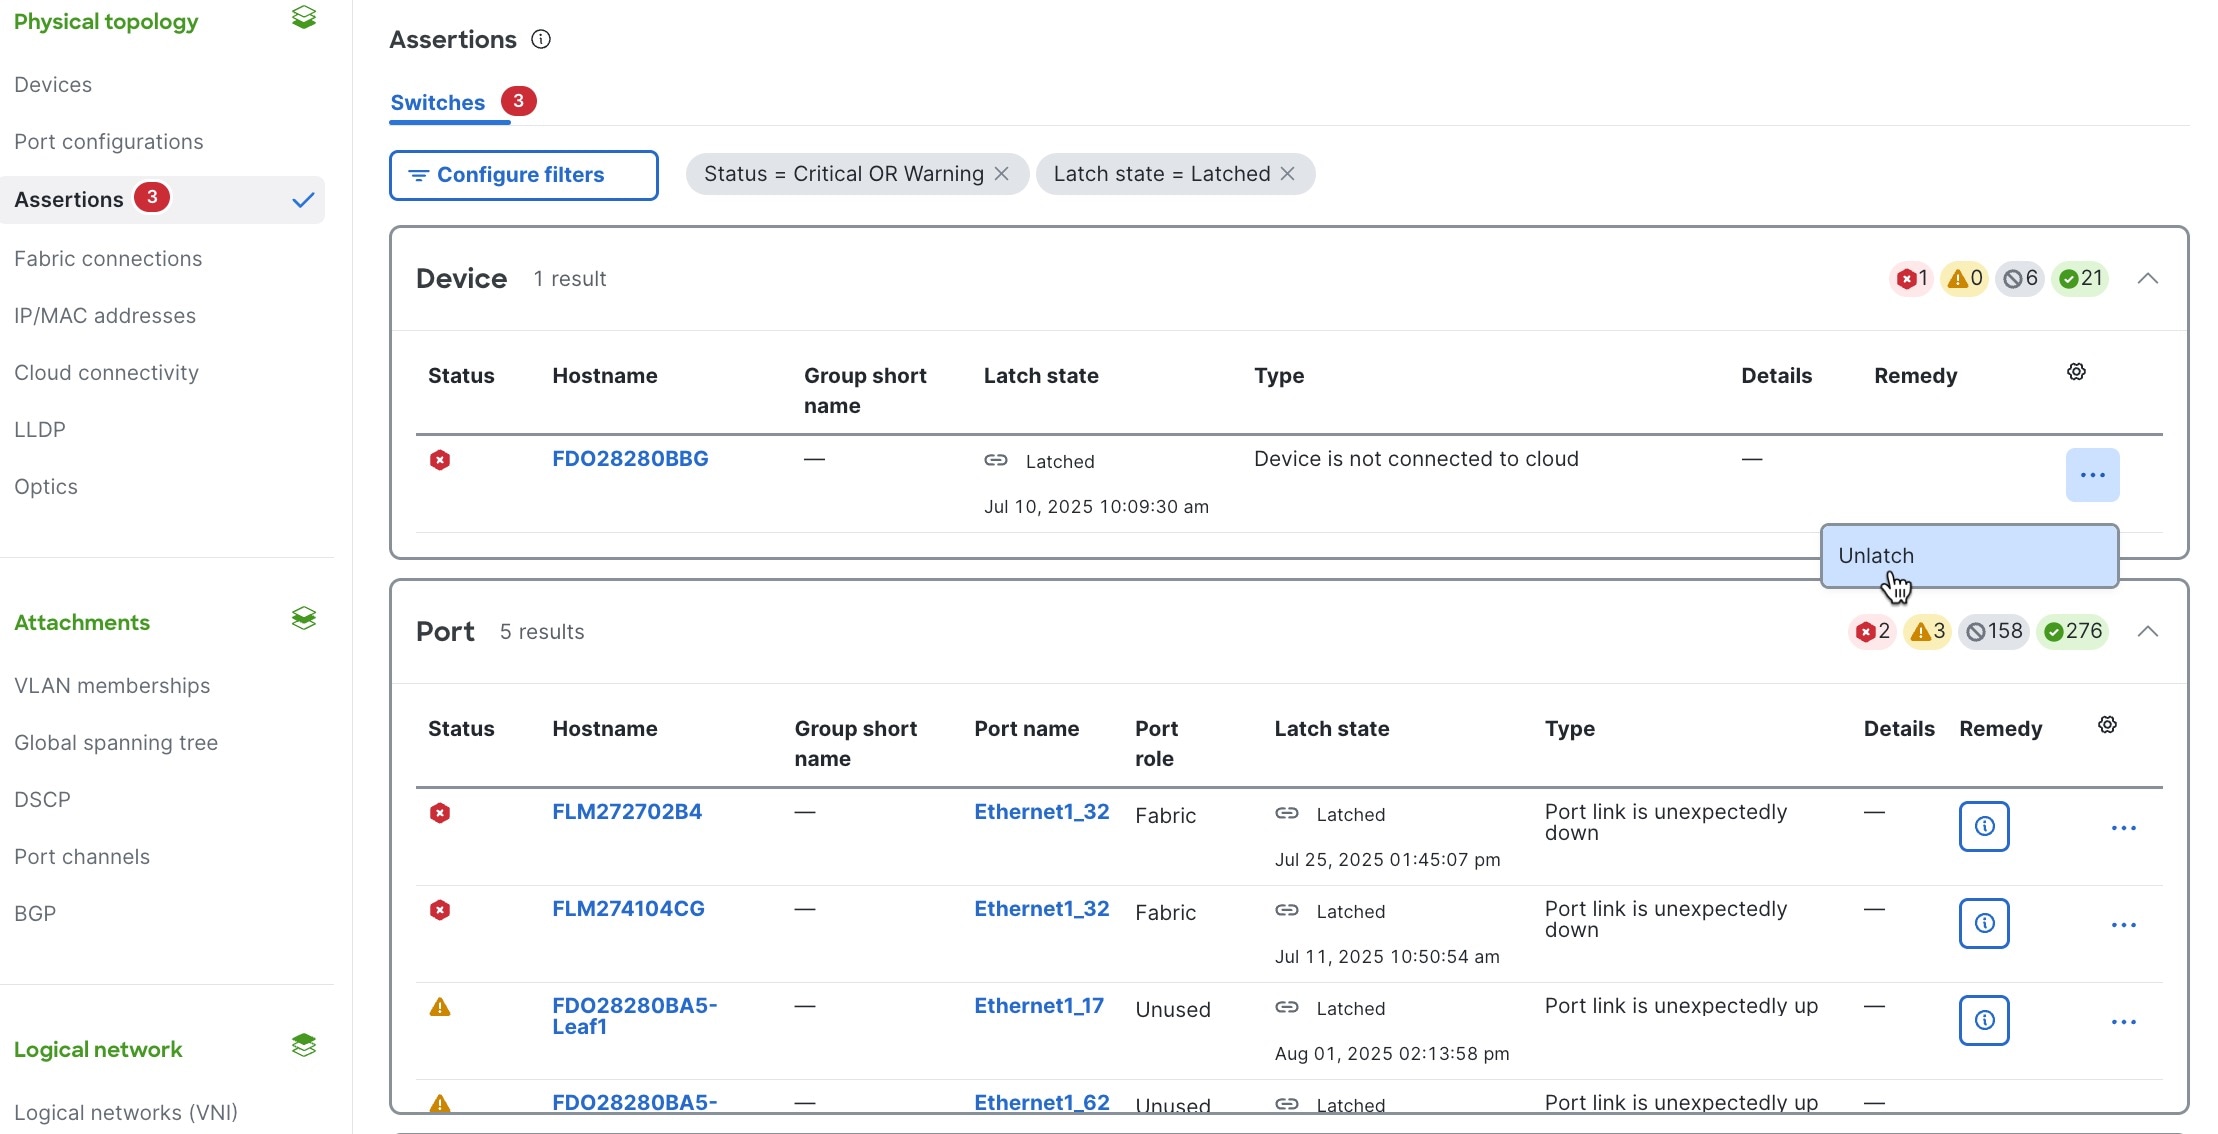 The Latch state column will reflect the update. |