Introduction
This document describes how to enable specific debug logs when you troubleshoot SSO and SSO-enabled Jabber and non-Jabber Mobile and MRA via Expressway/VCS.
.
Prerequisites
Requirements
Cisco recommends that you have knowledge of these topics:
- Have installed Expressway-Core/Video Control Server (VCS)-Control and Expressway-Edge/VCS-Edge
- Have applied the appropriate release and option keys on the Expressway/VCS Core and Expressway/VCS Edge
- Have configured Expressway Mobile and Remote Access (MRA)
- Have access to the Expressway/VCS Core and Expressway/VCS Edge with an administrator account by the web interface
Note: Navigate to the Expressway MRA deployment guides for more information.
Components Used
The information in this document is based on these software versions:
- Expressway/VCS version X8.10.X, X8.11.X, X12.5.X, X12.6.X, X12.7.X, and X14.X.X
- Expressway/VCS version X8.X.X and X14.X.X releases
The information in this document was created from the devices in a specific lab environment. All of the devices used in this document started with a cleared (default) configuration. If your network is live, ensure that you understand the potential impact of any command.
Note: The words, Expressway and VCS, are interchangeable. From this point on, Expressway is used.
Background Information
The non-Jabber devices are the 78XX/88XX IP phones and DX Series endpoints. With regards to the problems with Jabber and non-Jabber MRA via Expressway/VCS, you can enable debug logs on the Expressway/VCS servers, reproduce the problem, and upload the logs to the case which expedites the troubleshoot process, and ultimately, the case resolution. These problems include, but are not limited to, Jabber MRA login failure, specific Jabber service(s) that fails to register, no-way or one-way audio, and so on.
For non-Single Sign On (SSO) and SSO-enabled MRA via Expressway, provide these details for the affected users:
- Username
- Device name
- The timestamp of the log in
- The timestamp of the error received
- The error message received
For no-way audio or one-way audio MRA calls via Expressway, provide this information:
- Calling party device name and extension.
- Called party device name and extension.
- Call flow.
- The direction of the audio failure, for example, one-way or no-way.
- The timestamp of the call placed.
Note: If the Expressway-Core and Expressway-Edge servers are clustered, for example, more than one Expressway-Core and Expressway-Edge servers, perform the log capture only on the primary Expressway-Core and Expressway-Edge servers. After the problem is reproduced, you can download the logs from the primary Expressway-Core and Expressway-Edge servers. Then, log into the secondary Expressway-Core and Expressway-Edge servers and download the logs. If you have multiple Expressway-Core and Expressway-Edge servers, repeat this step for the rest of your secondary Expressway-Core and Expressway-Edge servers.
Jabber MRA via Expressway Non-SSO
Expressway-Core
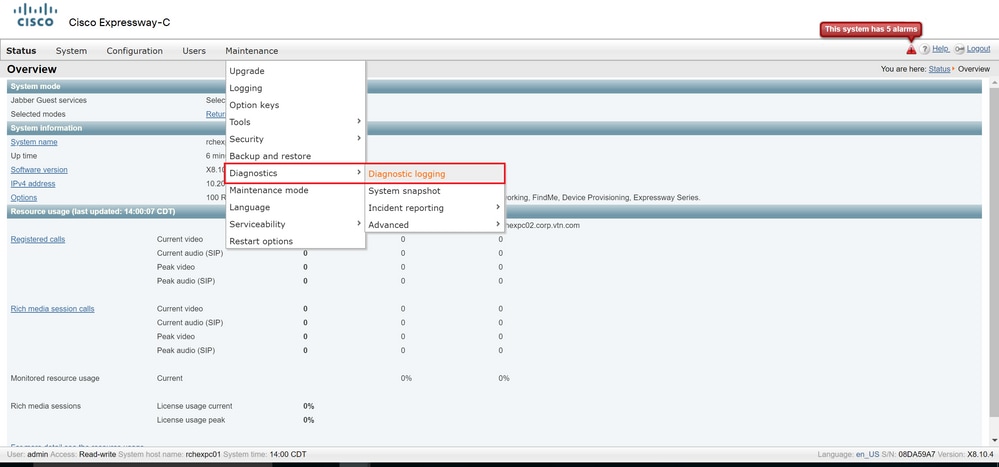
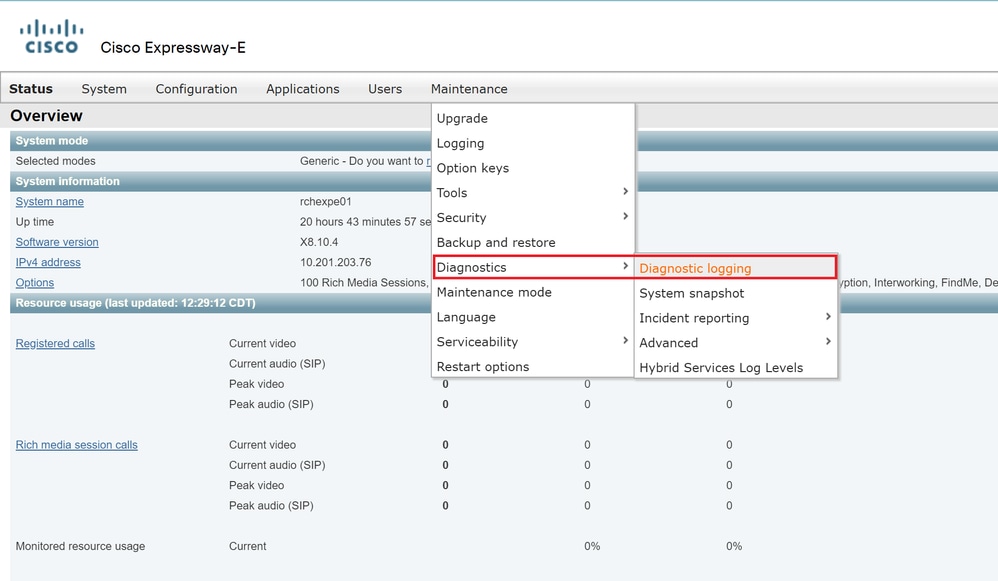
Step 1. Navigate to Maintenance > Diagnostics > Diagnostic logging as shown in the image.
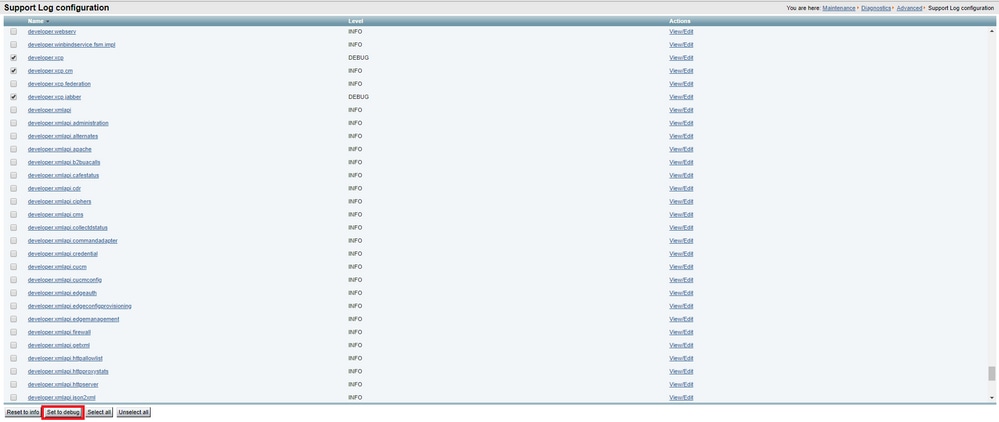
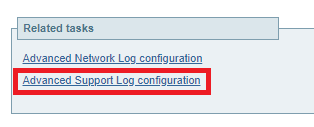
Step 2. Choose Advanced Support Log configuration at the bottom of the page as shown in the image.

Step 3. Mark the checkboxes as shown in the image.
- developer.edgeconfigprovisioning
- developer.edgeconfigprovisioning.uds
- developer.xcp
- developer.xcp.cm
- developer.xcp.jabber
Step 4. Choose Set to debug at the bottom of the page as shown in the image.
Note: The Expressway-Core and Expressway-Edge servers raise an alarm once one or more logs are set to debug. This alarm persists until the log is reset to info. You see the alarm as shown in the image.

Step 5. Choose Diagnostics at the top-right hand of the page as shown in the image.

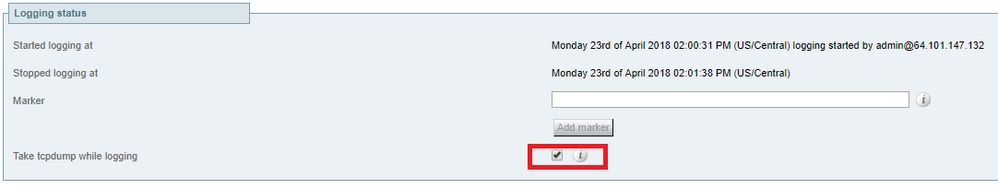
Step 6. Mark the checkbox Take tcpdump while logging as shown in the image.
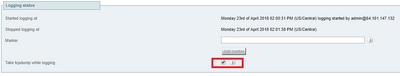
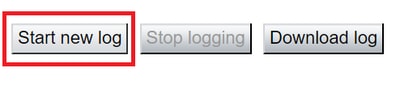
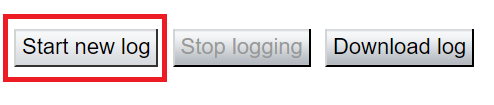
Step 7. Choose Start new log as shown in the image.
Expressway-Edge
Step 8. Navigate to Maintenance > Diagnostics > Diagnostic logging as shown in the image.
Step 9. Choose Advanced Support Log configuration at the bottom of the page as shown in the image.
Step 10. Mark the checkboxes as shown in the image.
- developer.edgeconfigprovisioning
- developer.xcp
- developer.xcp.cm
- developer.xcp.jabber
Step 11. Choose Set to debug at the bottom of the page as shown in the image.

Step 12. Choose Diagnostics at the top-right of the page as shown in the image.

Step 13. Mark the checkbox Take tcpdump while logging as shown in the image.
Step 14. Choose Start new log as shown in the image.
Step 15. Reproduce the problem.
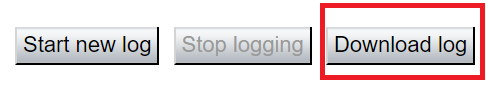
Step 16. Choose Stop logging after the problem is reproduced as shown in the image.

Step 17. Choose Download log as shown in the image.
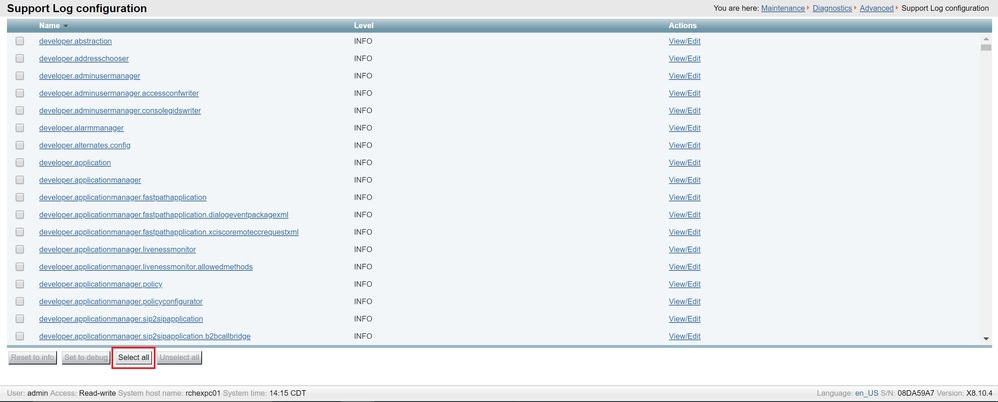
Step 18. Choose Advanced Support Log configuration as shown in the image.

Step 19. Click Select all as shown in the image.
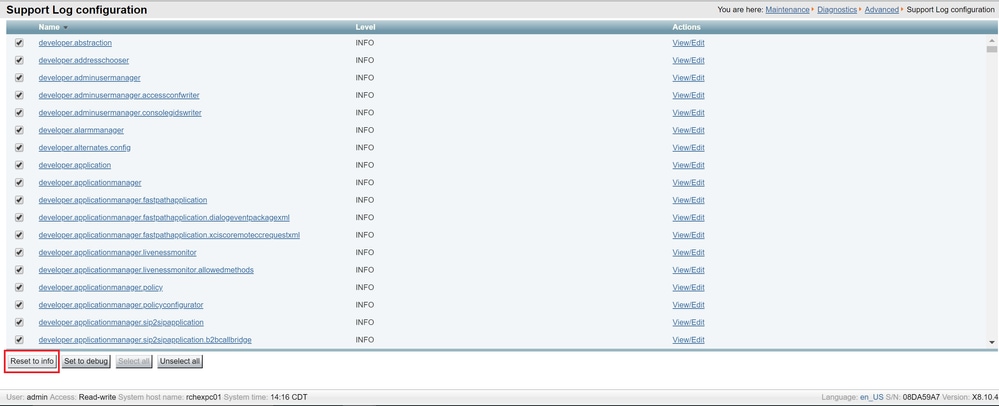
Step 20. Choose Reset to info as shown in the image.
Step 21. Repeat Step 16 to Step 20 on the Expressway-Core.
Note: You can also download the Jabber PRT log for additional analysis.
Jabber MRA via Expressway SSO-Enabled
Expressway-Core
Step 1. Navigate to Maintenance > Diagnostics > Diagnostic logging.
Step 2. Choose Advanced Support Log configuration.
Step 3. Mark these check boxes:
- developer.edgeconfigprovisioning
- developer.edgeconfigprovisioning.uds
- developer.edgeconfigprovisioning.server.sso
- developer.management.sso
- developer.xmlapi.sso
- developer.cdbtable.cdb.edgeSsoStatus
- developer.xcp
- developer.xcp.cm
- developer.xcp.jabber
Step 4. Choose Set to debug at the bottom of the page.
Step 5. Choose Diagnostics at the top-right of the page.
Step 6. Mark the checkbox Take tcpdump while logging.
Step 7. Choose Start new log.
Expressway-Edge
Step 8. Navigate to Maintenance > Diagnostics > Diagnostic logging.
Step 9. Choose Advanced Support Log configuration.
Step 10. Mark these checkboxes:
- developer.edgeconfigprovisioning
- developer.cdbtable.cdb.edgeSsoStatus
- developer.xcp
- developer.xcp.cm
- developer.xcp.jabber
Step 11. Choose Set to debug at the bottom of the page.
Step 12. Choose Diagnostics at the top-right of the page.
Step 13. Mark the checkbox Take tcpdump while logging.
Step 14. Choose Start new log.
Step 15. Reproduce the problem.
Step 16. Choose Stop logging after the problem is reproduced.
Step 17. Choose Download log.
Step 18. Choose Advanced Support Log configuration.
Step 19. Click Select all.
Step 20. Choose Reset to info.
Step 21. Repeat Step 16 to Step 20 on the Expressway-Core.
IP Phones 78XX/88XX and DX Series Endpoints MRA via Expressway
Expressway-Core
Step 1. Navigate to Maintenance > Diagnostics > Diagnostic logging.
Step 2. Choose Advanced Support Log configuration.
Step 3. Mark these checkboxes:
- developer.edgeconfigprovisioning
- developer.edgeconfigprovisioning.uds
- developer.xcp
- developer.xcp.cm
Step 4. Choose Set to debug at the bottom of the page.
Step 5. Choose Diagnostics at the top-right hand screen.
Step 6. Mark the checkbox Take tcpdump while logging.
Step 7. Choose Start new log.
Expressway-Edge
Step 8. Navigate to Maintenance > Diagnostics > Diagnostic logging.
Step 9. Choose Advanced Support Log configuration.
Step 10. Mark these checkboxes:
- developer.edgeconfigprovisioning
- developer.xcp
- developer.xcp.cm
Step 11. Choose Set to debug at the bottom of the page.
Step 12. Choose Diagnostics at the top-right of the page.
Step 13. Mark the checkbox Take tcpdump while logging.
Step 14. Choose Start new log.
Step 15. Reproduce the problem.
Step 16. Choose Stop logging after the problem is reproduced.
Step 17. Choose Download log.
Step 18. Choose Advanced Support Log configuration.
Step 19. Click Select all.
Step 20. Choose Reset to info.
Step 21. Repeat Step 16 to Step 20 on the Expressway-Core.
Note: You can also download the Cisco 78XX and 88XX Series endpoints PRT log for additional analysis.
Related Information
 Feedback