WAAS - Troubleshooting the EPM AO
Available Languages
Chapter: Troubleshooting the EPM AO
This article describes how to troubleshoot the EPM AO.
Main Article
Understanding the WAAS Architecture and Traffic Flow
Preliminary WAAS Troubleshooting
Troubleshooting Optimization
Troubleshooting Application Acceleration
Troubleshooting the CIFS AO
Troubleshooting the HTTP AO
Troubleshooting the EPM AO
Troubleshooting the MAPI AO
Troubleshooting the NFS AO
Troubleshooting the SSL AO
Troubleshooting the Video AO
Troubleshooting the Generic AO
Troubleshooting Overload Conditions
Troubleshooting WCCP
Troubleshooting AppNav
Troubleshooting Disk and Hardware Problems
Troubleshooting Serial Inline Clusters
Troubleshooting vWAAS
Troubleshooting WAAS Express
Troubleshooting NAM Integration
Contents
EPM Accelerator Troubleshooting
The End Point Mapper (EPM) accelerator optimizes MS-RPC protocols that do not use predefined TCP ports. Clients contact the EPM service on the server (TCP port 135) to negotiate a dynamic port that is based on the application UUID. The EPM AO listens to the client communication and creates a dynamic policy entry to match the negotiated port. EPM is required to apply MAPI specific optimizations or to provide accounting on any MS-RPC protocol.
You can verify the general AO configuration and status with the show accelerator and show license commands, as described in the Troubleshooting Application Acceleration article. The Enterprise license is required for EPM accelerator operation.
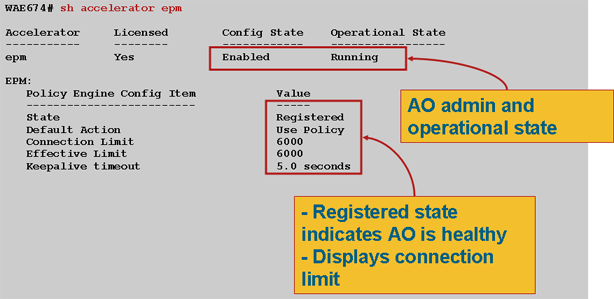
Next, verify the status that is specific to the EPM AO by using the show accelerator epm command, as shown in Figure 1. You want to see that the EPM AO is Enabled, Running, and Registered, and that the connection limit is displayed. If the Config State is Enabled but the Operational State is Shutdown, it indicates a licensing problem.
- Figure 1. Verifying the EPM Accelerator Status
Use the show running-config command to verify that the EPM traffic policy is properly configured. You want to see adaptor EPM for the applications or UUIDs that are configured to use the EPM AO, as follows:
WAE674# sh run | begin EPM
...skipping
map adaptor EPM 1544f5e0-613c-11d1-93df-00c04fd7bd09
    name Email-and-Messaging All action pass-through
 exit
 map adaptor EPM ms-sql-rpc
    name SQL All action optimize full
 exit
 map adaptor EPM mapi
    name Email-and-Messaging All action optimize full accelerate mapi
 exit
 map adaptor EPM ms-ad-replication
    name Replication All action optimize full
 exit
 map adaptor EPM ms-frs
    name Replication All action optimize full
 exit
 map adaptor EPM f5cc5a18-4264-101a-8c59-08002b2f8426
    name Email-and-Messaging All action pass-through
Use the show policy-engine application dynamic command to verify the dynamic policy engine match conditions as follows:
WAE674# sh policy-engine application dynamic
Dynamic Match Freelist Information:
  Allocated: 32768  In Use: 3  Max In Use: 4  Allocations: 380
Dynamic Match Type/Count Information:
  None                    0
  Clean-Up                0
  Host->Host              0
  Host->Local             0
  Local->Host             0
  Local->Any              0
  Any->Host               3
  Any->Local              0
  Any->Any                0
Individual Dynamic Match Information:
  Number:     1   Type: Any->Host (6)  User Id: EPM (3)               <-----------------
    Src: ANY:ANY  Dst: 10.10.100.101:1146                             <-----------------
    Map Name: uuida4f1db00-ca47-1067-b31f-00dd010662da                <-----------------
    Flags: TIME_LMT REPLACE FLOW_CNT                                  <-----------------
    Seconds: 1200  Remaining: - NA -  DM Index: 32765                 <-----------------
    Hits: 54  Flows: 39  Cookie: 0x00000000                           <-----------------
  Number:     2   Type: Any->Host (6)  User Id: EPM (3)
    Src: ANY:ANY  Dst: 10.10.100.101:1040
    Map Name: uuid1544f5e0-613c-11d1-93df-00c04fd7bd09
    Flags: TIME_LMT REPLACE FLOW_CNT
    Seconds: 1200  Remaining: 1163  DM Index: 32766
    Hits: 1  Flows: 0  Cookie: 0x00000000
Use the show statistics connection optimized epm command to check that the WAAS device is establishing optimized EPM connections. Verify that "TE" or "TDLE" appears in the Accel column for EPM connections, which indicates that the EPM AO was used, as follows:
WAE674# sh stat conn opt epm

Current Active Optimized Flows:                      18
  Current Active Optimized TCP Plus Flows:          17
   Current Active Optimized TCP Only Flows:          0
   Current Active Optimized TCP Preposition Flows:   1
Current Active Auto-Discovery Flows:                 0
Current Active Pass-Through Flows:                   28
Historical Flows:                                    100

D:DRE,L:LZ,T:TCP Optimization,
A:AOIM,C:CIFS,E:EPM,G:GENERIC,H:HTTP,M:MAPI,N:NFS,S:SSL,V:VIDEO

ConnID  Source IP:Port        Dest IP:Port          PeerID             Accel

2048    10.10.10.10:3007      10.10.100.101:135     00:14:5e:84:24:5f  TE           <-----Look for "E"
2049    10.10.10.10:3009      10.10.100.101:135     00:14:5e:84:24:5f  TE
You can check connection statistics for closed connections by using the show statistics connection closed epm command.
To view similar information from the Central Manager, choose the WAE device, then choose Monitor > Optimization > Connections Statistics.
You can view the EPM connection specific statistics by using the show statistics connection optimized epm detail command as follows:
WAE674# sh stat connection optimized epm detail

Connection Id:            1885
   Peer Id:                  00:14:5e:84:24:5f
   Connection Type:          EXTERNAL CLIENT
   Start Time:               Wed Jul 15 09:50:45 2009
   Source IP Address:        10.10.10.10
   Source Port Number:       2465
   Destination IP Address:   10.10.100.101
   Destination Port Number:  135
   Application Name:         Other
   Classifier Name:          MS-EndPointMapper                                 <-----Should see MS-EndPointMapper
   Map Name:                 basic
   Directed Mode:            FALSE
   Preposition Flow:         FALSE
   Policy Details:
          Configured:        TCP_OPTIMIZE
             Derived:        TCP_OPTIMIZE
                Peer:        TCP_OPTIMIZE
          Negotiated:        TCP_OPTIMIZE
             Applied:        TCP_OPTIMIZE
   Accelerator Details:
               Configured:   EPM                                               <-----Should see EPM configured
                  Derived:   EPM
                  Applied:   EPM                                               <-----Should see EPM applied
                     Hist:   None

                                               Original            Optimized
                                   -------------------- --------------------
   Bytes Read:                                     5220                 5076
   Bytes Written:                                  5076                 5220
. . .
EPM AO Logging
The following log files are available for troubleshooting EPM AO issues:
- Transaction log files: /local1/logs/tfo/working.log (and /local1/logs/tfo/tfo_log_*.txt)
- Debug log files: /local1/errorlog/epmao-errorlog.current (and epmao-errorlog.*)
For easier debugging, first set up an ACL to restrict packets to one host.
WAE674(config)# ip access-list extended 150 permit tcp host 10.10.10.10 any
WAE674(config)# ip access-list extended 150 permit tcp any host 10.10.10.10
To enable transaction logging, use the transaction-logs configuration command as follows:
wae(config)# transaction logs flow enable
wae(config)# transaction-logs flow access-list 150
You can view the end of a transaction log file by using the type-tail command as follows:
wae# type-tail tfo_log_10.10.11.230_20090715_130000.txt
Wed Jul 15 16:53:22 2009 :1799 :10.10.10.10 :2369 :10.10.100.101 :1025 :OT :START :EXTERNAL CLIENT :00.14.5e.84.24.5f
 :uuide3514235-4b06-11d1-ab04-00c04fc2dcd2 :Replication :**Map Default** :F :(DRE,LZ,TFO) (DRE,LZ,TFO) (DRE,LZ,TFO) (DRE,LZ,TFO)
 (DRE,LZ,TFO) :<None> :(None) (None) (None) :<None> :<None>  :0 :169
Wed Jul 15 16:53:51 2009 :1798 :10.10.10.10 :2368 :10.10.100.101 :135 :OT :END :EXTERNAL CLIENT :(EPM) :228 :212 :212 :228
Wed Jul 15 16:53:51 2009 :1799 :10.10.10.10 :2369 :10.10.100.101 :1025 :OT :END:EXTERNAL CLIENT :(None) :596 :220 :347 :429
Wed Jul 15 16:53:51 2009 :1799 :10.10.10.10 :2369 :10.10.100.101 :1025 :SODRE :END :596 :220 :347 :429 :0
To set up and enable debug logging of the EPM AO, use the following commands.
NOTE: Debug logging is CPU intensive and can generate a large amount of output. Use it judiciously and sparingly in a production environment.
You can enable detailed logging to the disk as follows:
WAE674(config)# logging disk enable
WAE674(config)# logging disk priority detail
You can enable debug logging for connections in the ACL as follows:
WAE674# debug connection access-list 150
The options for EPM AO debugging are as follows:
WAE674# debug accelerator epm ?
  all         enable all EPM accelerator debugs
  shell       enable EPM shell debugs
You can enable debug logging for EPM connections and then display the end of the debug error log as follows:
WAE674# debug accelerator epm connection
WAE674# type-tail errorlog/epmao-errorlog.current follow
 Feedback
Contact Cisco
- Open a Support Case

- (Requires a Cisco Service Contract)