

November 30, 2010
What You Will Learn
• Residential users
• Business users
• Mobile users
Introduction
Summary of Findings
At Home
• The At Home portion of the Cisco CLUE Index grew 7.6 points, from the baseline 100 index points value in 2008 to 107.6 index points in 2009.
• North America continues to lead in overall At Home services adoption, followed by Japan and Western Europe.
• Social media services continued to lead the At Home category, followed by online video and consumer instant messaging.
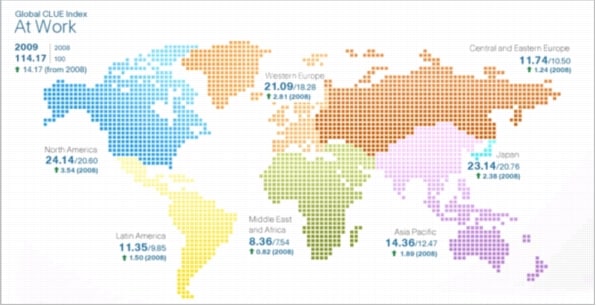
At Work
• The At Work portion of the Cisco CLUE Index grew 14.2 points, from the baseline 100 index points value in 2008 to 114.2 index points in 2009.
• North America took the lead over Japan in 2009 to become the region with the highest At Work index value, followed by Japan and Western Europe.
• Mobile business messaging continues to be the At Work service with the highest penetration, followed by business instant messaging.
On the Move
• The On the Move portion of the Cisco CLUE Index grew 19.5 points, from the baseline 100 index points value in 2008 to 119.5 index points in 2009.
• Japan continues to have the highest On the Move index value, followed by Western Europe and North America.
• Mobile text messaging (Short Message Service [SMS] and mobile instant messaging) is the top service in the On the Move category. Mobile text messaging also led the absolute index growth. Although it is a mature service, mobile text messaging is still growing.
Methodology
• First, the regional penetration of advanced services in each category is calculated based on relevant addressable markets. For example, for Internet-based services like online video, online gaming, online music, social media, voice over IP (VoIP), consumer email, and instant messaging, the penetration is calculated based on the number of regional Internet users. For television-based services such as multi-channel TV, time-delayed TV (using a digital video recorder or personal video recorder), or video on demand (VoD), the number of regional households with TV sets is the basis for calculating service penetration.
• Within each category, regional penetrations are aggregated. The aggregate value was normalized to the base-period (calendar year 2008) index value of 100. This base value will change in subsequent Cisco CLUE reporting periods to reflect changes in penetration of advanced services.
• Each region and service in a category is allocated index points at the aggregate level in proportion to its penetration calculation (see Table 1).
• Changes in either the regional addressable market size or changes in the service-adopting population, or both, will proportionately affect the index. For example, if service adoption increases while the population stays the same, the index penetration value of a service or application in that region will increase. If the population of a region increases while the service adoption stays the same, the index penetration value for the service in that region will decrease. If both the underlying values (users as well as population) increase, the regional index value will change according to the effect on the relevant penetration rates.
• The Cisco CLUE Index is designed to maintain ratio scale from period to period and from region to region.
– If region A has double the penetration of region B for all services within a category, the index value for region A will be double that of region B.
– If the penetration for all services increases by 20 percent for region A from period 1 to period 2, the index value of region A will show the same increase from period 1 to period 2.
Table 1. Sample Cisco CLUE Index Regional and Service Calculation
Service and Application Categories
At Home
• Consumer instant messaging: fixed-line instant messaging for consumers
• Consumer VoIP: VoIP including both Internet VoIP such as Skype, and dedicated VoIP subscriptions from a broadband service provider or an independent VoIP service provider such as Vonage
• Online gaming: games either downloaded from or played over the Internet, including Internet-connected console gaming
• Online music: songs or music tracks downloaded from or streamed over the Internet
• Online video: video downloaded from or streamed over the Internet
• Social media: social networking (such as Facebook or MySpace) and blogging
• Next-generation TV: multichannel television including cable TV, Internet Protocol Television (IPTV), satellite TV, and paid digital terrestrial TV.
• Time-delayed TV: personal video recorders (PVRs) or digital video recorders (DVRs) that allow recording of TV content to be viewed at a user's discretion, using a next-generation TV service
• VoD: on-demand video programming that is streamed or downloaded through a TV set-top box, using a next-generation TV service
At Work
• Business instant messaging: fixed-line business instant messaging, including all business users of on-premises and hosted email
• Business IP telephony: IP telephony lines or end points that are attached to a dedicated IP-enabled or a dedicated IP phone system, not including shared or multitenant solutions
• Business audio conferencing: phone-based conferencing with no video
• Business web conferencing without video: collaborative sessions that use a standard web browser or downloaded client to share an application or to make a remote presentation over the Internet (web conferencing with video is included in the category defined next)
• Business personal video conferencing: includes client-server PC-software-based desktop conferencing, video telephony, web conferencing with video, and executive video conferencing
• Business room-based video conferencing: group video conferencing that includes Cisco TelePresence® systems and multicodec and single codec conferencing systems
• Mobile business email: mobile business email for users on an enterprise mobile account; this is considered an extension of office email service
• Mobile business messaging: messaging for users on an enterprise mobile account; this is considered an extension of the office messaging service
• Mobile business location-based services (LBS): business LBS for mobile employees such as the salesforce, and other location-tracking services for industries such as transportation, health, and security
On the Move
• Mobile text messaging: mobile text-based services, including Short Message Service (SMS) and instant messaging
• Mobile Multimedia Service (MMS): mobile services that include multimedia objects such as images, videos, audio, and rich text in addition to text
• Mobile email: email on mobile phones
• Mobile gaming: downloads of full games as well as online gaming on mobile phones, including single-player and multiplayer online games
• Mobile music: full track downloads and music streaming services on mobile phones
• Mobile television: scheduled TV content delivered over cellular and broadcast infrastructures
• Mobile video: on-demand video content downloaded or streamed to the mobile handset
• Mobile social networking: mobile services ranging from simple chat rooms with only texting tools, to multimedia-rich environments and user-generated content (UGC) sharing communities
• Mobile LBS: services that include personal navigation, point of interest (POI), friend-finder, and family-tracker services
• Mobile commerce: services such as mobile banking, local and remote mobile payments, and domestic and international funds transfer
Cisco CLUE Index: Regional Views
At Home
Figure 1. Composite Global Index-At Home

Source: Cisco CLUE, 2010
Table 2. Composite Global Index-At Home
Source: Cisco CLUE, 2010
• The At Home portion of the Cisco CLUE Index grew 7.6 points, from the baseline 100 points value in 2008 to 107.6 points in 2009.
• North America continues to lead in overall At Home services adoption, followed by Japan and Western Europe.
• North America, Latin America, and Western Europe lead the absolute and relative index growth for the At Home category. Middle East and Africa has the third largest percentage growth, ahead of Western Europe, although from a very small base.
At Work
Figure 2. Composite Global Index-At Work
Source: Cisco CLUE, 2010
Table 3. Composite Global Index-At Work
Source: Cisco CLUE, 2010
• The At Work portion of the Cisco CLUE Index grew 14.2 points, from the baseline 100 points value in 2008 to 114.2 points in 2009.
• North America took the lead from Japan in 2009 to become the region with the highest index value, followed by Japan and Western Europe.
• North America, Western Europe, Japan, and Asia Pacific led the absolute index growth. North America also led the relative index growth. Western Europe, Asia Pacific, and Latin America followed-all with similar growth rates in the 15 percent range.
On the Move
Figure 3. Composite Global Index-On the Move

Source: Cisco CLUE, 2010
Table 4. Composite Global Index-On the Move
Source: Cisco CLUE, 2010
• The On the Move portion of the Cisco CLUE Index grew 19.5 points, from the baseline 100 points value in 2008 to 119.5 points in 2009.
• Japan continues to have the highest index value, followed by Western Europe and North America.
• The top two regions contributing to both the absolute and relative index growth are developed regions: North America and Japan. Eastern Europe and Middle East and Africa are leading the growth in the developing region, although from a much smaller base.
Cisco CLUE Index: Service Views
At Home
Table 5. Global Index for At Home Services
Source: Cisco CLUE, 2010
• For every 1 global Internet user, there were approximately 0.8 households with TV sets in 2008. This ratio has decreased to 0.7 households per global Internet user in 2009.
• Social media continues to lead as the category with the highest penetration index value, followed by online video and consumer instant messaging.
• Online video has a higher index value than next-generation TV, time-delayed TV, and VoD, as a result of the popularity of user-generated content, service price sensitivity, and the nascent nature of the services. Online video has become popular through global services such as YouTube. Time-delayed TV services such as TiVo have not achieved as much global adoption as online video because of the higher costs (hardware, service fees, or both) associated with DVRs and PVR. Although consumers prefer to watch short-form content over the Internet, the trend is toward increasing online consumption of long-form video content. In the future, this trend may further affect the online video penetration index value relative to next-generation TV. The trend is also leading to the incorporation of more Internet-interactive features in next-generation TV services.
• The primary contributors to the absolute index growth were the leisure activities of online gaming, music, video, and social networks. Advanced TV services such as VoD and time-delayed watching had the highest relative growth, although from a much smaller base, followed by consumer VoIP and online gaming.
Service Innovation Examples at Home
• Virgin Media Next-Generation Access Strategy
• Telia-Spotify Music Service Partnership
• Chunghwa Telecom KKBOX Digital Music Service
• BSkyB's Multi-Screen TV Services
• Orange Content Everywhere Service
• Telecom Italia-Virgilio Portal Strategy
At Work
Table 6. Global Index for At Work Services
Source: Cisco CLUE, 2010
• Mobile business messaging continues to be the service with the highest penetration index, with 27 percent higher penetration than the next-highest service, business instant messaging.
• The primary contributor to the absolute index growth was room-based video conferencing, followed by IP telephony, audio conferencing, and business instant messaging. Room-based video conferencing is larger than all the other conferencing services combined. In emerging regions, conferencing is often limited to the most senior officials in business or government, who prefer face-to-face communication to web or audio conferencing. Also, because emerging economies lack a traditional communications infrastructure, these economies have a higher deployment of fiber and high-speed broadband access, which provides a high-quality room-based video conferencing experience. Asia Pacific and Japan have the highest number of fiber broadband connections, employing over 80 percent of total global fiber connections between them.
• Mobile business location-based services had the highest relative growth, although from a very small base, followed by personal video conferencing and room-based video conferencing.
Service Innovation Examples at Work
• Cbeyond's BeyondMobile Service for Small Businesses
• Optimum Lightpath (Cablevision) Healthcare Services
On the Move
Table 7. Global Index for On the Move Services
Source: Cisco CLUE, 2010
• Mobile text messaging (SMS and mobile instant messaging) is the most mature service in this category. More handsets support text messaging than support MMS, and text messaging is generally a less expensive service than MMS. SMS and instant messaging are expected to dominate the mobile messaging services in the near future. Text messaging also leads the absolute growth index. Despite being a mature service, it is still growing. In fact, many of the other services, such as mobile commerce and social networking, are also contributing to this growth, as many are based on text messaging.
• Advanced services such as mobile commerce, LBS, and mobile TV are the other main contributors to the absolute index growth.
• Mobile LBS has the largest penetration growth rate. Navigation services are the primary location-based services, followed by location search. The growth of LBS is promoted by many free or ad-supported offerings and the proliferation of smartphones. The entry of social networking providers into this area is expected to increase adoption of these services in the future.
• Mobile gaming has the third-highest penetration index, following messaging and email, because it is a relatively mature service and can be supported by a larger variety of handsets. Many games are available for free download or are ad-supported.
• Mobile television has higher associated costs than mobile video and thus a lower penetration. Most mobile TV services require paid subscriptions, whereas mobile video can be accessed without charge through the mobile Internet.
Service Innovation Examples On the Move
• Bharti Airtel Rural Strategy
• China Mobile Application Store
• NTT DoCoMo: Mobile BeeTV Service
• Telefonica: LiveScreen Mobile Ads
Service Ranks Within Regions
At Home
Table 8. Regional Index Ranking for At Home Services
Source: Cisco CLUE, 2010
• Social media continues to be the primary At Home service in all regions except Japan and North America.
• North American consumers prefer next-generation TV to other At Home services. In general, developed regions have a greater preference for next-generation TV (ranking it in the top 4) than developing regions. Eastern Europe's rank for next-generation TV rose from 5 to 4 in 2009. This reflects increased penetration of next-generation TV services in the region, primarily led by direct-to-home (DTH) and satellite television. The digital services increasingly offered by DTH have also encouraged digitization by the region's cable television providers. Advanced television services such as time-delayed TV and VoD TV are relatively nascent across all regions.
• Consumer instant messaging is more popular in developing regions than in the developed regions of the world.
• After social networking, Asia Pacific users prefer to listen to online music. According to a CNNIC (China Internet Network Information Center) report, Chinese Internet users prefer online music to online video. This phenomenon in the Asia Pacific region could be related to lower broadband speeds, which affect the experience of watching online video. Piracy is a huge problem faced by the music industry in this region, as well as in other regions. In 2009, music-streaming services such as Pandora and Lala also gained popularity. This trend could help to abate piracy because instead of illegally downloading music, consumers could stream music. According to the International Federation of the Phonographic Industry (IFPI), 95 percent of music downloads are illegal. Music companies, service providers, and regulatory bodies are developing innovative business models to help monetize online music and control piracy. Partnerships that offer innovative music services include Telia-Spotify and Chunghwa Telecom KKBOX.
At Work
Table 9. Regional Index Ranking for At Work Services
Source: Cisco CLUE, 2010
• Generally, mobile business messaging continues to be the service with the highest penetration across all regions, followed by business instant messaging. Japan continues to be the exception, preferring mobile business email, room-based video conferencing, and business instant messaging. In North America, audio conferencing took first place, followed by mobile messaging.
• Room-based video conferencing is the most popular form of conferencing (even outranking audio conferencing and web conferencing) in all regions except North America and Western Europe. In emerging regions, conferencing is often limited to senior officials in business or government, who prefer face-to-face communication. Also, emerging economies have a higher relative deployment of fiber and high-speed broadband, which is suitable for room-based video conferencing. Asia Pacific and Japan have the most fiber broadband connections, over 80 percent of the total global fiber connections.
On the Move
Table 10. Regional Index Ranking for On the Move Services
Source: Cisco CLUE, 2010
• Mobile messaging, both text and multimedia, continues to be the preferred service across all regions except Japan. Japanese mobile subscribers prefer mobile email and MMS. Middle East and Africa mobile users have the highest relative preference for mobile commerce services, preferring it to other mobile entertainment and communication services.
• Asia Pacific mobile users have a higher preference for mobile commerce services than do users in most other regions. The popularity of mobile commerce in emerging regions indicates the ease (or lack thereof) of access to financial institutions in those regions. Mobile commerce applications have helped banks and other financial institutions reach and support more customers in emerging regions. Examples of mobile commerce in emerging regions include the Grameen village phone program in Bangladesh and the M-Pesa money transfer service in Kenya.
• Mobile television has gained higher penetration in both Japan and Western Europe, moving up three ranks in both regions.
Regional Ranks within Services
At Home
Table 11. Index Ranking for At Home Services Within Each Region
Source: Cisco CLUE, 2010
• The top three regional ranks across most service categories are shared by North America, Japan, and Western Europe. The exceptions are social media, where Latin America has the highest penetration, and online music and consumer instant messaging, where Asia Pacific has the second-highest penetration.
• Japan continues to have the highest adoption of consumer VoIP, even though it has been slow to adopt business IP telephony. The popularity of consumer VoIP in Japan is primarily the result of the high costs of conventional telephony relative to VoIP, and the higher penetration of broadband and fiber connections at home, which are being used for more than just Internet access and other data services. VoIP also has a high penetration in Western Europe, where prices of bundled packages of broadband and VoIP are significantly lower than separate offers for each service. Similar pricing trends are emerging in other regions, particularly Asia and Eastern Europe.
At Work
Table 12. Index Ranking for At Work Services Within Each Region
Source: Cisco CLUE, 2010
• Japan continues to have the highest penetration of room-based video conferencing. This is also reflective of faster broadband speeds available in Japan. While Japan has the highest penetration of room-based video conferencing in terms of this index model, in absolute numbers, Japan represents less than a fifth of the total Asia Pacific users.
• Asia Pacific has the second-highest penetration of business IP Telephony. Japan has very low IP telephony penetration, primarily because the enterprise telephony market is dominated by traditional telephone companies that have not actively marketed IP telephony. However, with entrance of new vendors, the enterprise market is slowly changing.
• Japanese users ranked the lowest on Mobile business messaging. They are ranked the highest on adoption of mobile business email. This is reflective of the advanced mobile handsets in Japan.
On the Move
Table 13. Index Ranking for On the Move Services Within Each Region
Source: Cisco CLUE, 2010
• Japan maintains the highest penetration across all mobile services except mobile text messaging, in which it is last. Japanese users have more advanced handsets (for example, nearly 90 percent of mobile phones in use in Japan are 3G-enabled, the highest 3G penetration in the world), and the very close collaboration between handset manufacturers and service providers makes this market more ready for adoption of more advanced services than the rest of the world.
• Japan is followed by North America and Western Europe in penetration rates for most services. The exception is mobile commerce, where Asia Pacific has the third-highest penetration. Asia Pacific also has the second-highest penetration of mobile text messaging. This trend indicates how basic services are being adopted in regions with high price sensitivity. Asia Pacific continues to be the region with the highest mobile network additions in 2009. In fact, in many regions services such as mobile commerce and social networking are based on SMS and could be helping to increase SMS adoption. This indicates how more advanced services such as mobile commerce are providing empowered consumers with resources (such as banking and financial services, health care, and education) that were previously unavailable or remote.
Bandwidth Gauge
Table 14. Service Bandwidth Gauge
Data Sources
For More Information