


Cisco Nexus Dashboard is a unified automation and operations platform for provisioning, managing, and operating data center networks.
One platform makes it easy
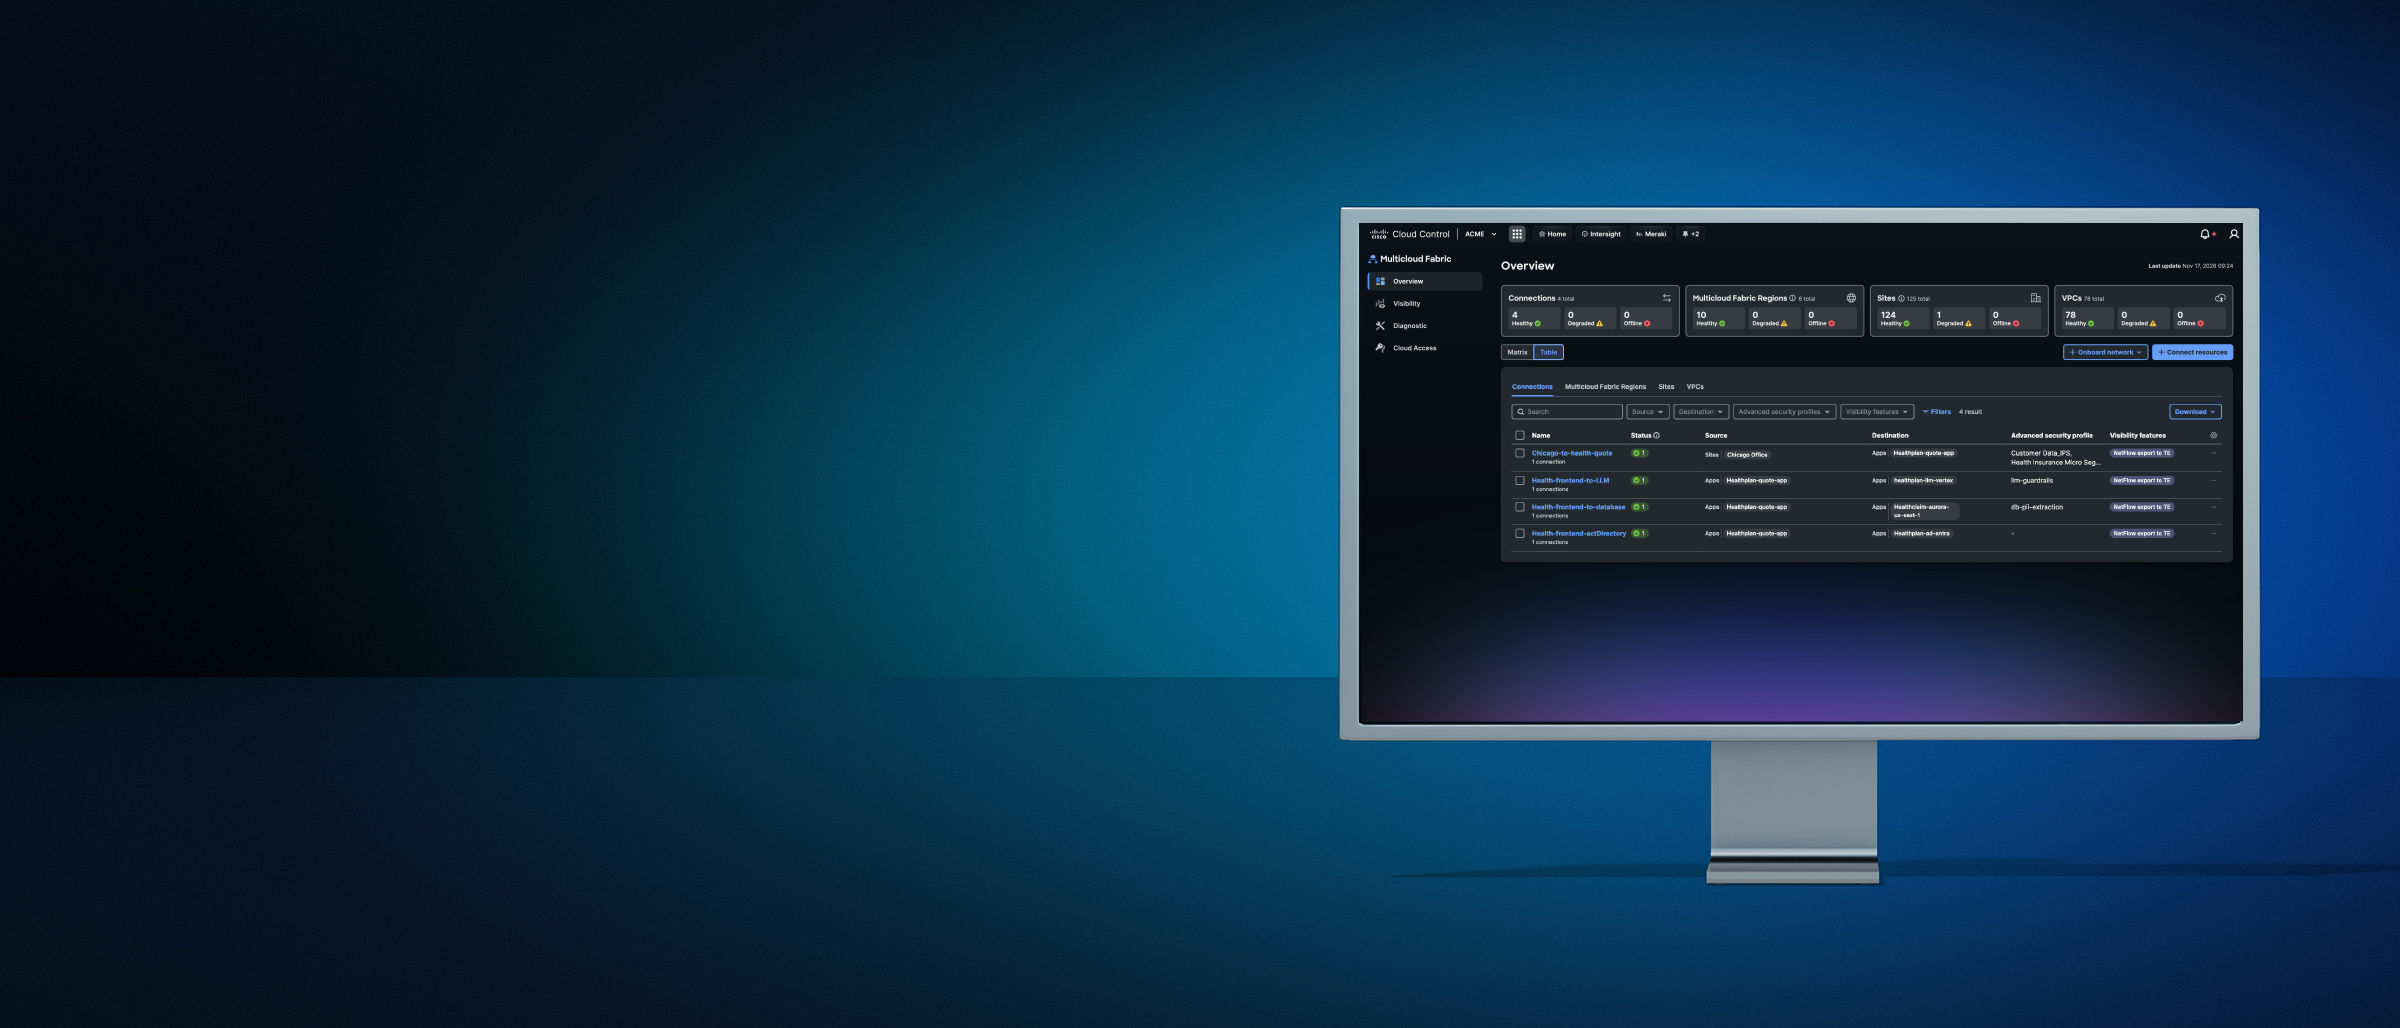
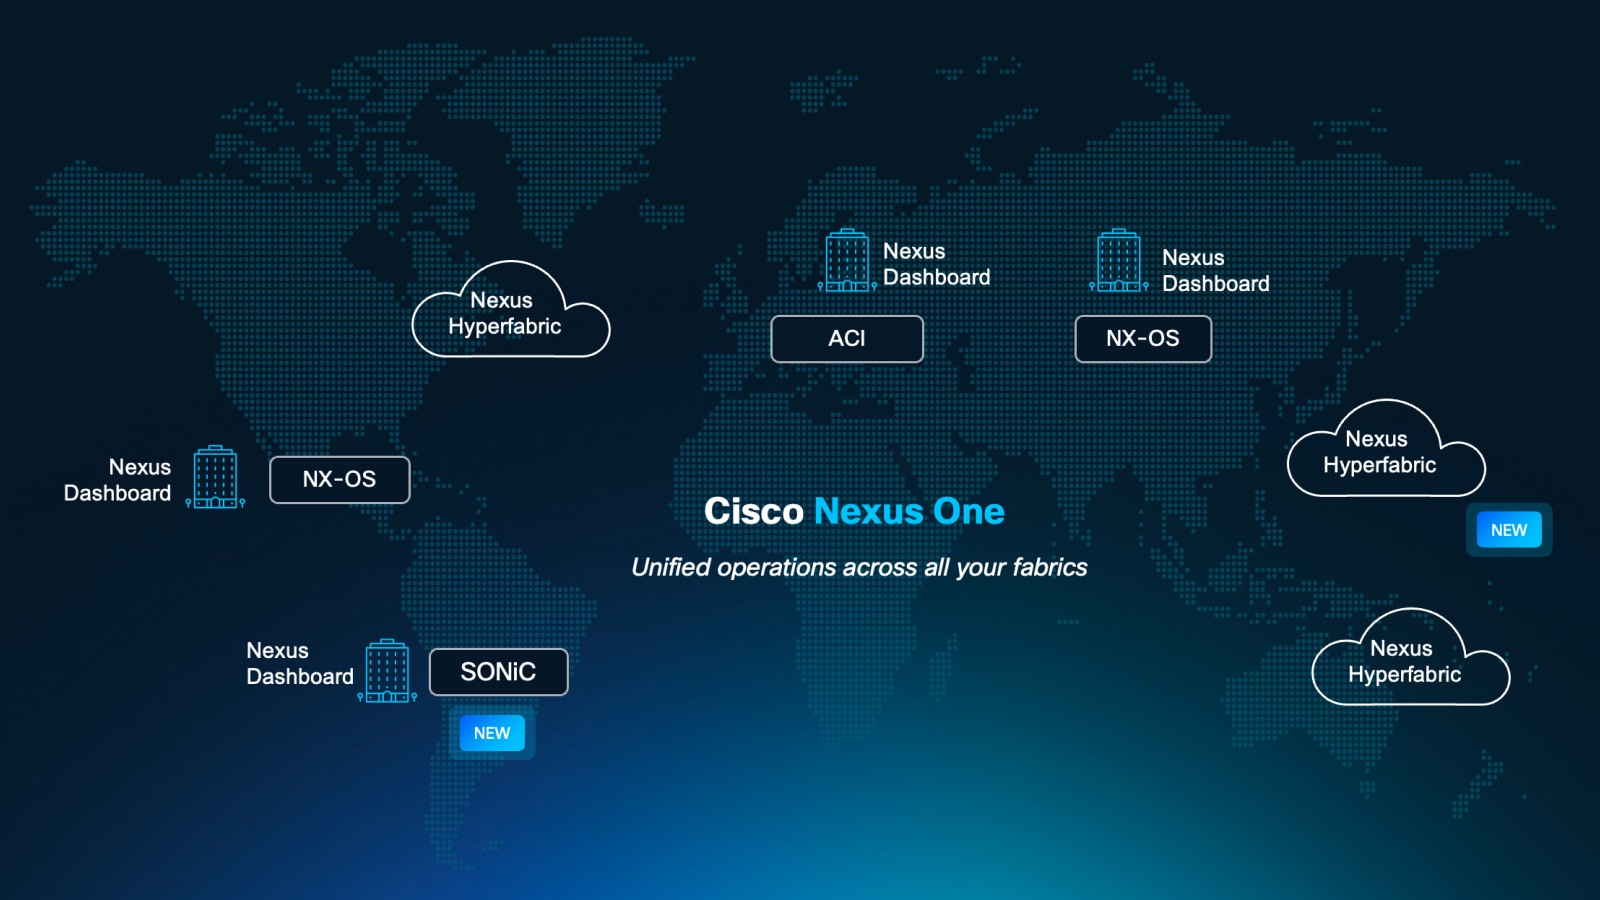
A simple way to manage Cisco Nexus One networks
Gain visibility that frees you to do what you need, where and when you need to do it.

Configure with ease
Automate the provisioning of your data-center network infrastructure using consistent configurations to drive fast, simple, and secure network connectivity, with full lifecycle management, embedded automation, and Infrastructure as Code (IaC) integrations.

Minimize congestion, risk, and downtime
Evolve how you operate and troubleshoot your networks with best-in-class network tools. Maximize telemetry through smart analytics for enterprise and AI/ML networks.

Greater visibility and sustainability
Achieve more visibility into data centers, including energy consumption, emissions, and costs.

Unlock more value with Nexus Dashboard integrations


Amazon Web Services (AWS)
See Nexus Dashboard buying options on AWS Marketplace.
Microsoft Azure
See buying options for Nexus Dashboard on Azure Marketplace.
Explore customer stories
Included with every Cisco Nexus 9000 license
Cisco Data Center Networking (DCN)
Essentials
Single data-center fabric
- Single automated network provisioning (Cisco Nexus Dashboard Controller)
- Basic device and network monitoring (Cisco Nexus Dashboard Insights)
- Upgrade to full Insights functionality with the Day-2 Operations add-on
- Supports Cisco ACI, Cisco NDFC, and Cisco NX-OS fabrics
Cisco Data Center Networking (DCN)
Advantage
Multiple data-center fabrics
- Essentials entitlements
- Centralized configuration and automated interconnect for multiple data centers (Cisco Nexus Dashboard Orchestrator)
- Device network monitoring and troubleshooting tools (Insights)
- Upgrade with an optional Day-2 Operations add-on to get full Insights functionality
- Supports Cisco ACI, Cisco NDFC, and Cisco NX-OS fabrics
Recommended
Cisco Data Center Networking (DCN)
Premier
- Includes all Essentials and Advantage features
- Comprehensive Cisco Nexus Dashboard Insights functionality
- Maximize proactive insights
- Predict risk and downtime
- Network analytics for multiple data-center networks
- No additional add-ons needed
- Supports Cisco ACI, Cisco NDFC, and Cisco NX-OS fabrics
Cisco named a Leader in Gartner® 2025 Magic Quadrant™ for Data Center Switching
See why we believe our industry-leading performance, simplicity, and scalability helped us earn this recognition.
Get a one-to-one demo
With the focus on your business, our experts will show you how Cisco Nexus Dashboard works and answer all your questions.
Achieve 350% return on investment over three years
Cisco Nexus Dashboard achieves significant TCO/ROI, based on independent research and customer interviews conducted by IDC.
Cisco Nexus Dashboard FAQs
Cisco Nexus Dashboard can configure, manage, and analyze from small sites to very large enterprise-grade implementations of Cisco Nexus switches. With its flexible hosting model (physical, virtual, and cloud-hosted), customers can choose the right model that is applicable to their environment. Refer to Nexus Dashboard Capacity Planning for more details.
The Cisco Nexus Dashboard platform can be deployed across data-center network infrastructure in the form factor of your choosing (physical/virtual or cloud). The Nexus Dashboard platform is extensible, integrates with third-party services such as Panduit and Splunk, and provides the central point for cross-domain integrations.