Transform Data Center Operations with Cisco Nexus One and Splunk Integrations Solution Overview
Available Languages
Bias-Free Language
The documentation set for this product strives to use bias-free language. For the purposes of this documentation set, bias-free is defined as language that does not imply discrimination based on age, disability, gender, racial identity, ethnic identity, sexual orientation, socioeconomic status, and intersectionality. Exceptions may be present in the documentation due to language that is hardcoded in the user interfaces of the product software, language used based on RFP documentation, or language that is used by a referenced third-party product. Learn more about how Cisco is using Inclusive Language.
Cisco Data Center Networking and Splunk: visibility leads to insights and action
Modern data centers are evolving rapidly to support hybrid, multicloud, and AI-driven workloads. This increased complexity makes unified visibility, rapid troubleshooting, and operational efficiency critical for success. Observability is a cornerstone of full-lifecycle data center network management and a key pillar of Cisco Nexus® One. By integrating Cisco Nexus One and Cisco Data Center Networking solutions with Splunk NetOps, SecOps, and IT teams gain real-time, actionable insights across the entire data center fabric.
This integration enables three powerful use cases, each designed to address specific operational and business needs.
Native Splunk in Cisco Nexus One
Cisco Nexus Dashboard Analysis hub
Overview
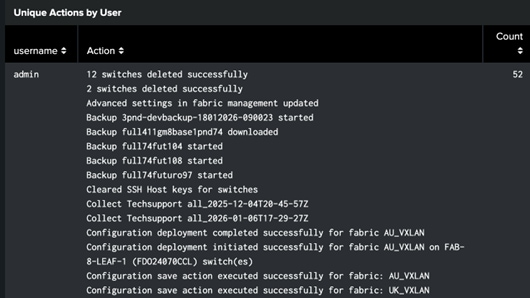
Cisco offers a native Splunk integration directly within Nexus Dashboard. This integration streams telemetry such as anomalies, advisories, and audit logs through Splunk’s HTTP Event Collector (HEC) for real-time analytics. This solution provides data governance and regulatory compliance for customers requirements.
Key capabilities
● Embedded analytics: run Splunk natively on premises for instant dashboards and root cause analysis
● Federated visibility: utilize unified dashboards that deliver cross-domain insights regardless of data origin
● Operational cost efficiency: analyze high-fidelity telemetry locally to reduce cloud storage and egress costs
● Data sovereignty and compliance: keep sensitive data on premises, supporting data residency and regulatory needs
Use cases
● Accelerated root cause analysis: real-time correlation of configuration changes and network anomalies
● End-to-end visibility: monitor network, security, and configuration events across domains
● Cost optimization: reduce overall data transfer and storage costs through local analytics
● Regulatory compliance: help ensure that sensitive data does not leave the data center
Anomalies on Splunk provided by Nexus Dashboard
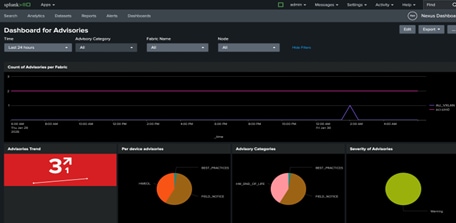
Advisories on Splunk provided by Nexus Dashboard
Advisories on Splunk provided by Nexus Dashboard
For customers with Cisco Data Center Networking (DCN) Premier licensing on Nexus Dashboard, the full feature set of native Splunk capabilities are available with a convenient add-on license.
Splunk IT Service Intelligence content pack for data-center networking
Overview
Splunk IT Service Intelligence (ITSI) delivers advanced machine-learning-driven service monitoring, predictive analytics, and incident management tailored for IT and digital business operations.
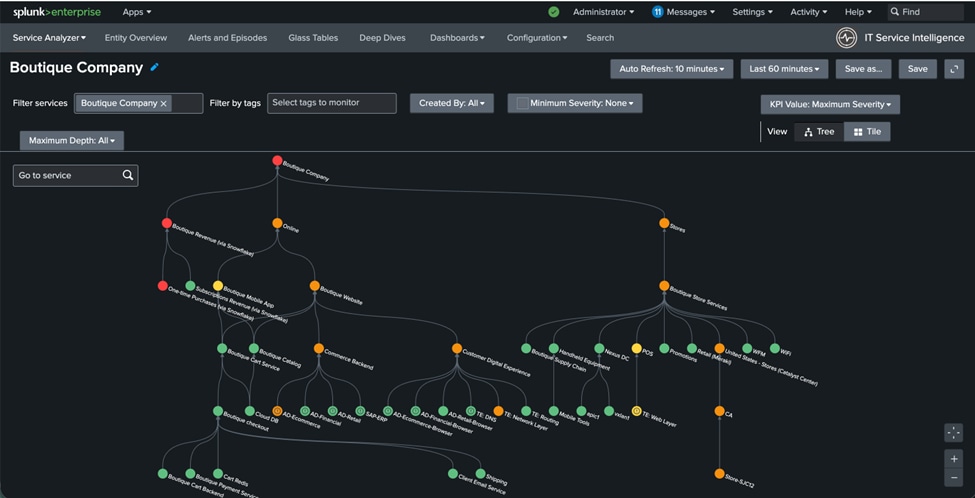
Splunk IT Service Intelligence service analyzer
Key capabilities
● Business and service monitoring: monitor service health, enforce SLAs, and trace root causes using dynamic topology models
● Intelligent incident management: get real-time event correlation, deduplication, and automated incident prioritization integrated with ITSM tools
● Predictive analytics: use proprietary algorithms for anomaly detection, adaptive thresholding, and predictive health scoring (for example, alerting 30 minutes before service degradation)
● Dynamic topology and KPI monitoring: utilize “one-click” onboarding, normalization, and correlation of Nexus data for actionable alerts
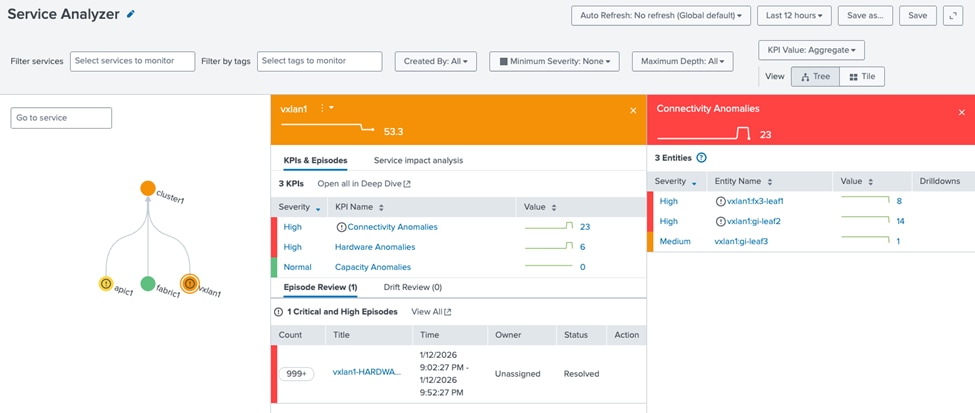
Splunk IT Service Intelligence content pack for data-center networking with Nexus Dashboard
Use cases
● Proactive service-health monitoring: prevent issues and SLA breaches with predictive, multi-KPI alerting
● Root cause analysis: drill down into Nexus data for rapid anomaly identification and resolution
● Streamlined incident response: accelerate MTTR with correlated, actionable alerts, and automated remediation
Splunk IT Service Intelligence (ITSI) for data-center networking can be easily consumed through the standard Cisco Data Center Networking (DCN) licensing. For more details visit the Cisco Data Center Subscriptions page. Separate ITSI licensing will apply.
Cisco Data Center Networking App for Splunk
Overview
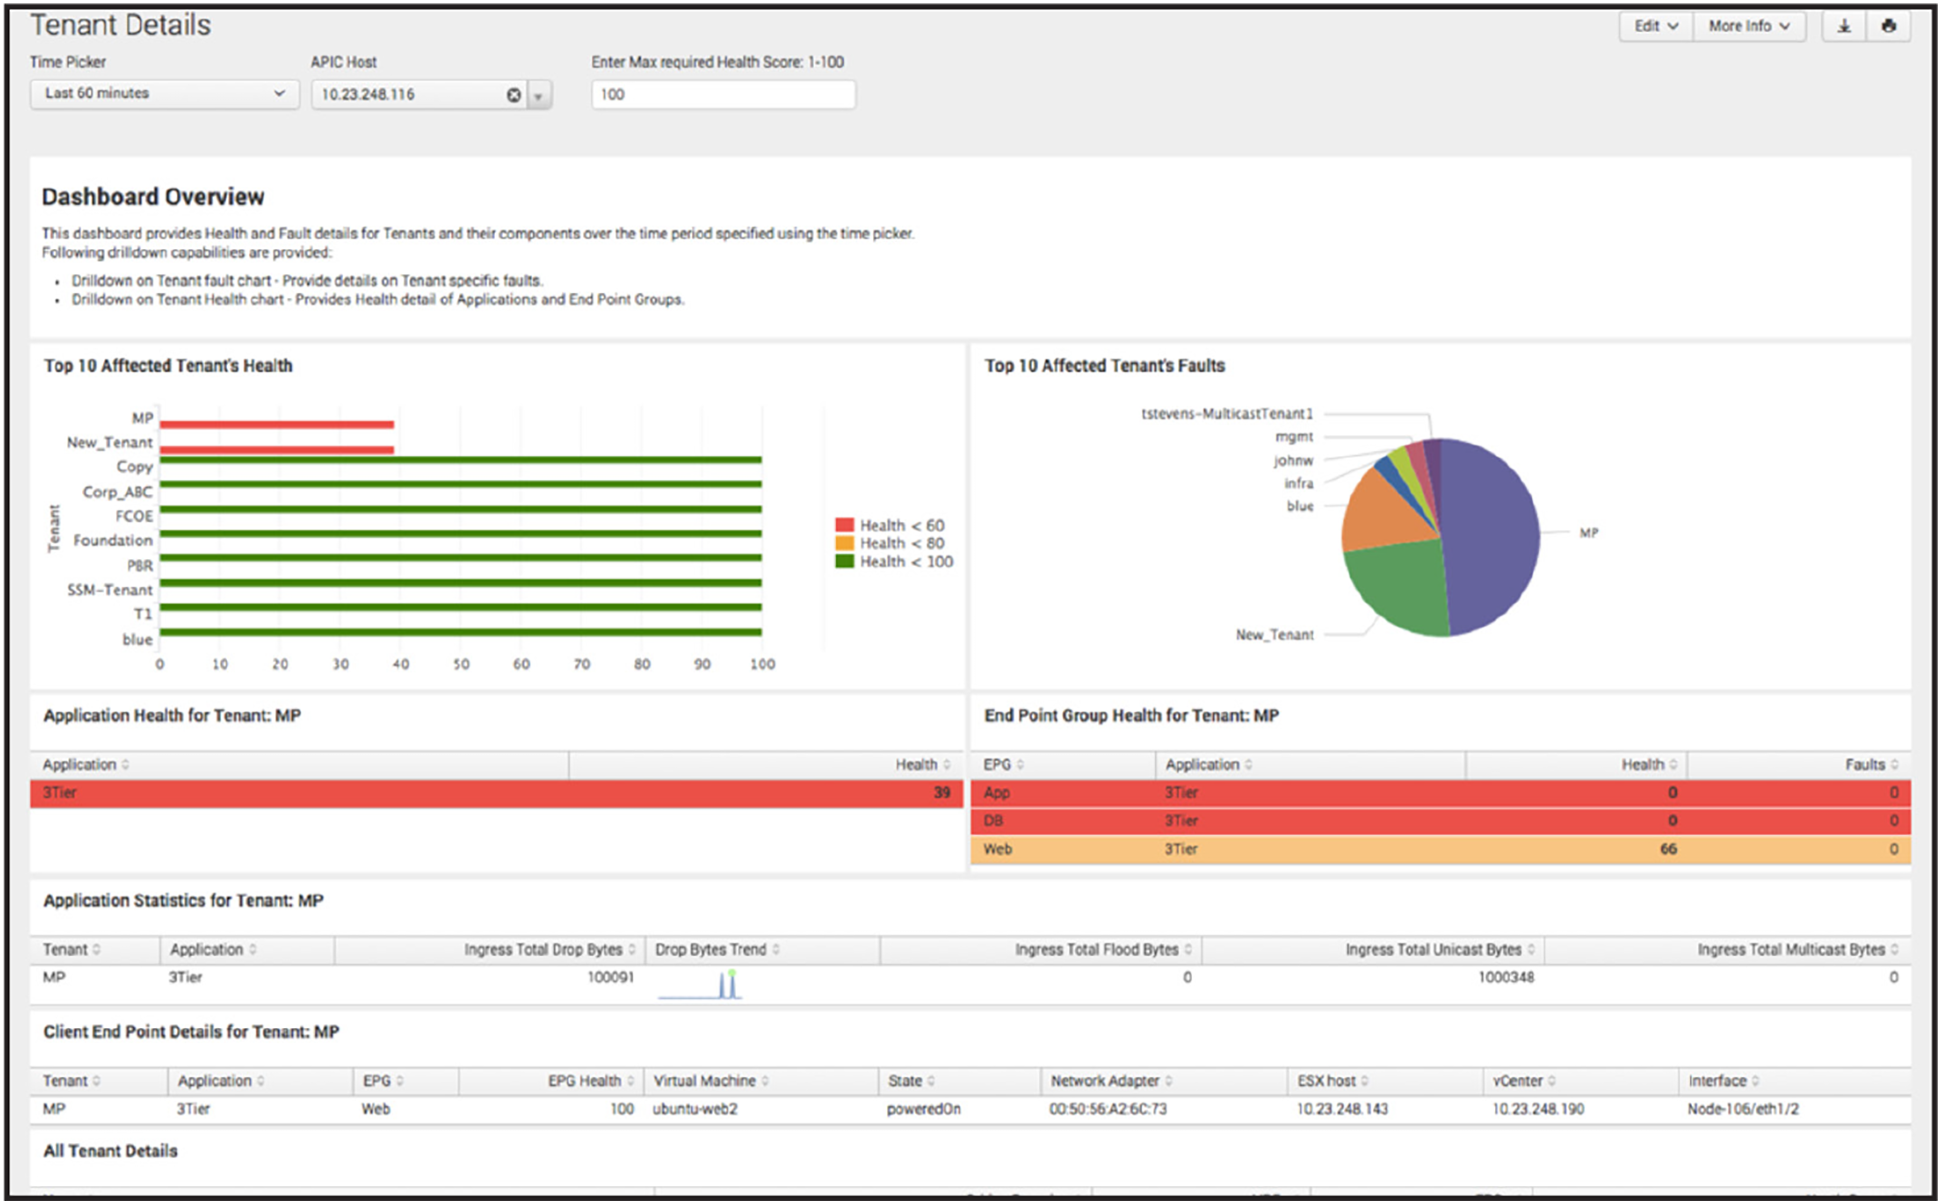
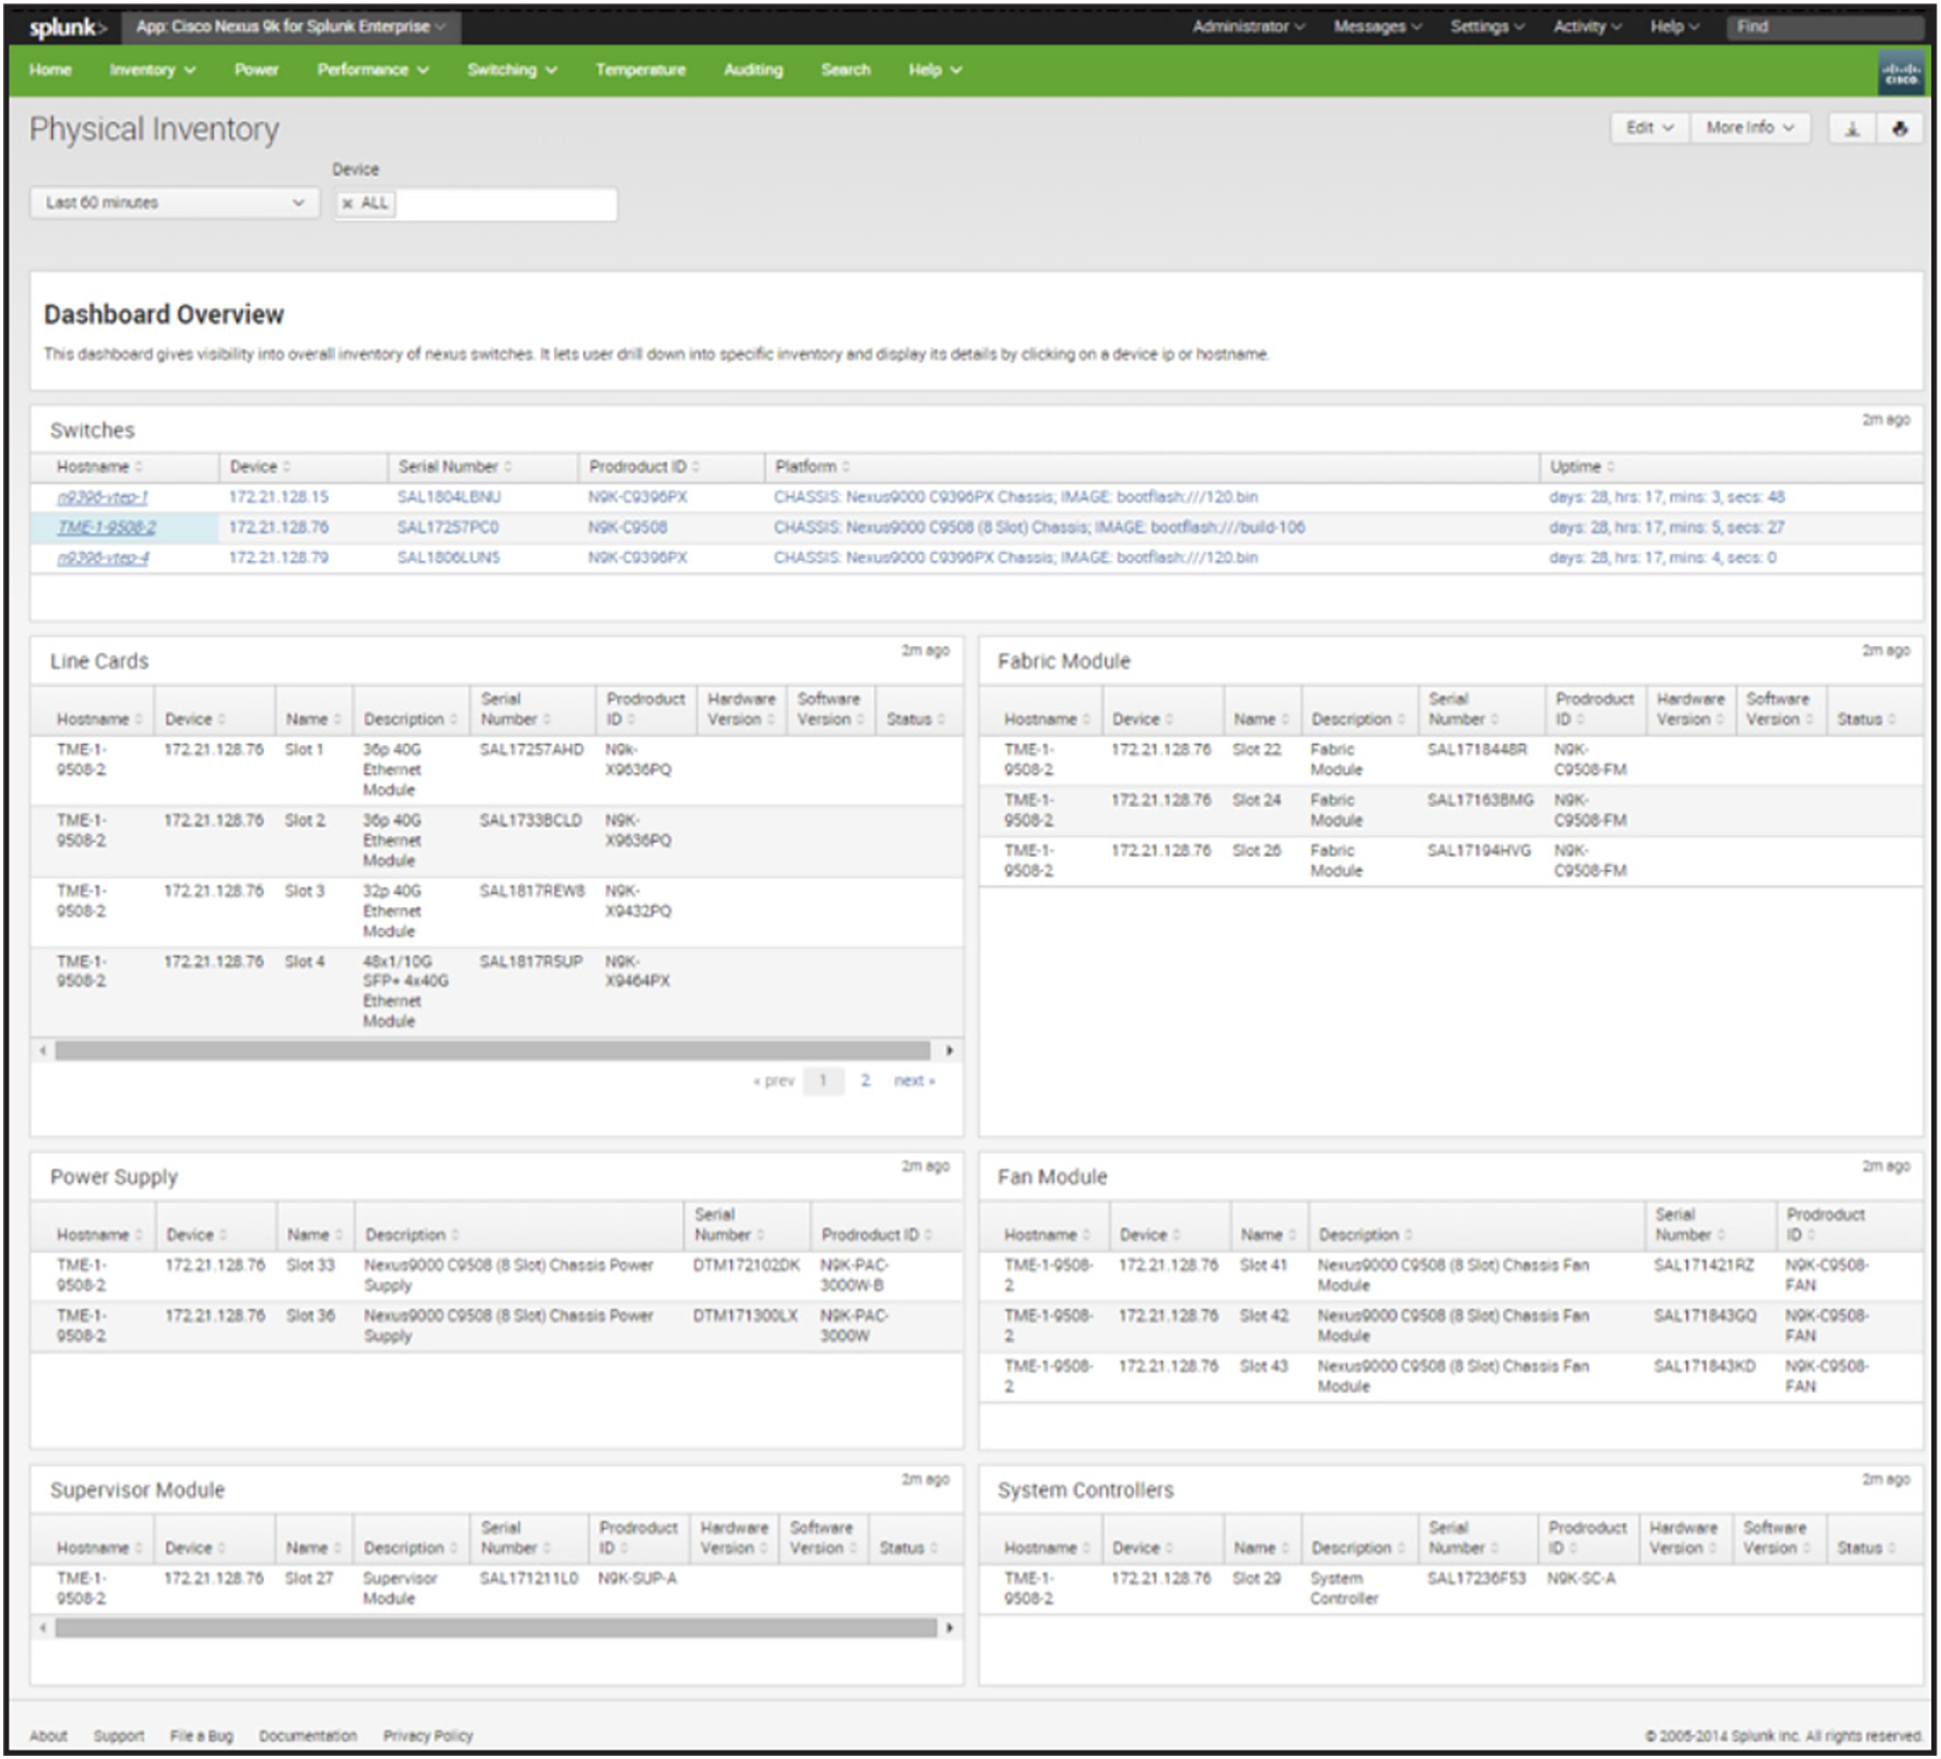
The Cisco Data Center Networking App for Splunk simplifies how teams collect, visualize, and act on telemetry from Cisco N9000 Series Switches and Cisco ACI® and Nexus Dashboard platforms. Supported on both Splunk Cloud and Splunk Enterprise, this application provides advanced dashboards and cross-correlation capabilities for comprehensive insights.
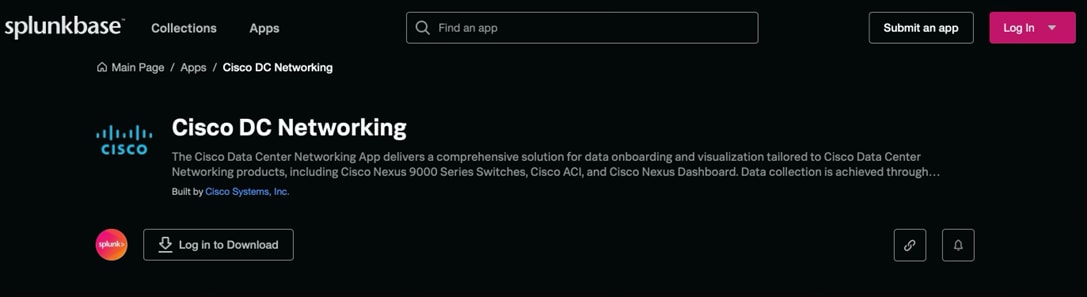
Cisco Data Center Networking on Splunkbase
Key capabilities
● Unified data integration: seamless onboarding of events, alarms, health scores, and inventory through open APIs
● Advanced dashboards: pre-built and customizable dashboards for inventory, health, fabric state, anomalies, and advisories
● Operational efficiency: optimized searches reduce resource usage and speed up dashboard performance
● Self-service installation: simplified deployment with support for Splunk 9.x and backed by Cisco® Technical Assistance Center (Cisco TAC)
● Visualization and cross-correlation: correlate telemetry across fabrics and technology tiers for actionable insights
Use cases
● Event monitoring: detect anomalies from Nexus Dashboard and monitor faults from Cisco ACI
● Infrastructure health: visualize the health of APIC and platform components
● Security and threat detection: analyze advisories and audit logs for security events
● AI workload monitoring: track interface stats, PFC/ECN, and correlate with server, GPU, and storage telemetry
● Network performance analysis: visualize host and flow data, drops, latency, and traffic patterns
Business value
The integration of Cisco Nexus platforms with Splunk transforms data center operations by:
● Simplifying telemetry management: seamlessly onboard and visualize telemetry from across the stack, reducing complexity and time-to-insight
● Enabling real-time and predictive monitoring: leverage advanced dashboards and machine learning to detect and address issues before they impact operations
● Enhancing compliance and cost efficiency: analyze data locally to reduce cloud-storage costs and ensure data sovereignty for regulated environments
● Driving operational resilience: provide unified, actionable insights that empower teams to respond faster and more effectively to network and security events
| Integration |
Use case |
Benefit |
| Cisco Data Center Networking App for Splunk |
Anomaly and event monitoring |
Rapid fault identification |
| Native Splunk for Nexus Dashboard |
Accelerated root cause analysis |
Reduce MTTR, ensure local compliance |
| Splunk ITSI Content Pack |
Predictive analytics and incident response |
Prevent outages, automate remediation |
In today’s fast-paced digital landscape, organizations need tools that not only provide visibility but also deliver actionable intelligence to stay ahead of challenges. Cisco Nexus One and Splunk integrations enable businesses to achieve operational excellence, improve service reliability, and support strategic initiatives such as AI-driven workloads and hybrid-cloud adoption. By combining Cisco’s industry-leading data center solutions with Splunk’s powerful analytics capabilities, organizations can unlock the full potential of their data centers, ensuring they remain agile, secure, and future-ready.
For more information, contact your Cisco representative or visit cisco.com/go/nexusdashboard