Deploying Highly Available Services with Cisco Nexus Dashboard, Release 3.x and Earlier
Available Languages
Bias-Free Language
The documentation set for this product strives to use bias-free language. For the purposes of this documentation set, bias-free is defined as language that does not imply discrimination based on age, disability, gender, racial identity, ethnic identity, sexual orientation, socioeconomic status, and intersectionality. Exceptions may be present in the documentation due to language that is hardcoded in the user interfaces of the product software, language used based on RFP documentation, or language that is used by a referenced third-party product. Learn more about how Cisco is using Inclusive Language.
- US/Canada 800-553-2447
- Worldwide Support Phone Numbers
- All Tools
 Feedback
 Feedback
Abstract
This white paper provides a comprehensive guide on deploying a highly available Cisco Nexus Dashboard cluster, emphasizing the importance of reliability, scalability, and fault tolerance.
The Cisco Nexus Dashboard is a powerful solution designed to streamline network operations by providing a unified view of the data center network. It encompasses various services, including Nexus Dashboard Insights, Nexus Dashboard Fabric Controller, and Nexus Dashboard Orchestrator.
The document covers essential concepts of Nexus Dashboard services, considerations for determining the optimal number of nodes, and strategies for handling failure scenarios. By following the guidelines outlined in this white paper, organizations can ensure a resilient and efficient Nexus Dashboard environment that meets the demands of modern, containerized applications.
Optional: Use this table if you need to update release notes regularly to add bugs or announce patch releases
The Cisco Nexus Dashboard is a centralized platform that enables efficient management and monitoring of data center networks. It offers a unified interface to streamline operations, enhance visibility, and improve overall network performance.
Cisco Nexus Dashboard is developed as a Kubernetes cluster that can be hosted as on-premises or a cloud appliance. This document will only focus on the on-premises deployment for Cisco Nexus Dashboard.
Cisco Nexus Dashboard runs on Kubernetes, a leading container orchestration platform, providing a robust and scalable underlying solution for managing containerized applications. Nexus Dashboard’s underlying Kubernetes infrastructure is deployed automatically and completely transparent to the user.
You can host the following services on Cisco Nexus Dashboard:
Nexus Dashboard Insights (NDI)
Nexus Dashboard Insights provides real-time analytics and monitoring capabilities, allowing administrators to gain deep insights into network performance, health, and security.
Nexus Dashboard Fabric Controller (NDFC)
The Nexus Dashboard Fabric Controller enables automated provisioning and management of network resources, ensuring a scalable and responsive infrastructure.
Nexus Dashboard Orchestrator (NDO)
Nexus Dashboard Orchestrator provides a centralized platform for policy management and automation, facilitating consistent policy enforcement across the data centers.
Deploying a Highly Available Nexus Dashboard Cluster
This white paper aims to guide organizations in the deployment of a highly available Nexus Dashboard cluster. It covers fundamental concepts, considerations, and best practices to ensure a resilient infrastructure that meets the demands of today's dynamic application landscape.
The following considerations were taken into account while writing this white paper:
● Type of deployments
● Cohosting versus co-location of services
● Consideration about onboarding of multiple independent fabrics on the same Nexus Dashboard
● Scale of primary, secondary, and stand-by nodes
● Physical placement of cluster nodes across multiple sites
● Failure scenarios and impacts
● General best practices to increase resiliency
All the above will have possibly different impacts and best practices depending on the deployed Nexus Dashboard services. Those will be discussed in this document.
Starting from Nexus Dashboard version 3.2, services have been harmonized regarding installation, operations, and high availability and failure scenarios considerations. Throughout the course of the white paper we will highlight major differences for Nexus Dashboard version 3.1 and earlier and 3.2 and later.
Physical or Virtual Type of Deployments
Cisco Nexus Dashboard can be deployed in a data center either as a virtual form factor or a physical form factor. It is not possible to mix within the same cluster physical and virtual nodes.
The physical form factor is offered as a cluster of specialized Cisco UCS servers (Nexus Dashboard platform). The virtual form factor currently allows you to deploy a Nexus Dashboard cluster using VMware ESXi or Linux KVM hypervisors. More hypervisor support is currently evaluated.
The choice of form factor does not imply consequences in terms of resiliency of the system: vMotion, Live Motion, and other technologies as DRS (Distributed Resource Scheduler) are not supported at the time of this writing. It is also not supported to backup and restore virtual machine snapshots.
The choice between virtual and physical form factors should be also made based on considerations like:
1. Scale of data center fabrics intended to be managed by the Nexus Dashboard cluster.
2. Cohosting of Nexus Dashboard services (also known as “deployment mode” from Nexus Dashboard version 3.1).
3. Operational and capital expenses.
You can verify both scale and cohosting considerations based on the Nexus Dashboard Capacity Planning tool and these considerations may force you to choose one or another form factor.
This document does not provide considerations for cost. Customers should be able to estimate the comparison between acquiring, cabling, stacking, and operation of a Nexus Dashboard cluster running on a virtual compared to a physical form factor.
Recommendation: If deployed in a virtual form factor, we recommend deploying each virtual cluster node in a different hypervisor. This will increase the resiliency in case of hypervisor failure.
Recommendation: We recommend using independent or redundant storage drives for the virtual cluster nodes to minimize the impact of storage failures.
Cisco Nexus Dashboard allows to run one or multiple services on the same cluster. This design is called cohosting of services. In this section we will explore the consequences of cohosting.
Note: Before Nexus Dashboard version 3.1, users could manually install or remove services on an existing Nexus Dashboard platform. As of Nexus Dashboard version 3.1, the platform supports different deployment modes that are chosen at cluster deployment. Deployment modes aim to simplify the lifecycle management of all services as the platform will autonomously optimize resources and manage software of platform and services as a single and unique entity, as opposed to asking the user to manage each component independently in previous Nexus Dashboard releases.
A deployment mode is a cluster installation that combines one or more Nexus Dashboard services hosted on the same cluster.
For more information, see the Nexus Dashboard Capacity Planning tool to verify the details of which services are available for cohosting.
The following list of deployment modes are supported in Nexus Dashboard 3.1:
rescue-user@pND1:~$ acs deployment show
====================================================================
Deployment Name Services
--------------------------------------------------------------------
ndfc Controller
ndi Insights
ndo Orchestrator
ndfc-ndi Controller,Insights
ndo-ndi Orchestrator,Insights
====================================================================
Note: In the current Nexus Dashboard release, you can change a deployment mode in an existing cluster, but modifying a deployment mode is a disruptive procedure, as the system reinstalls all services: their operational data and configurations are destroyed. For more information, see the Nexus Dashboard and Services Deployment and Upgrade Guide. In future Nexus Dashboard releases this limitation will be removed.
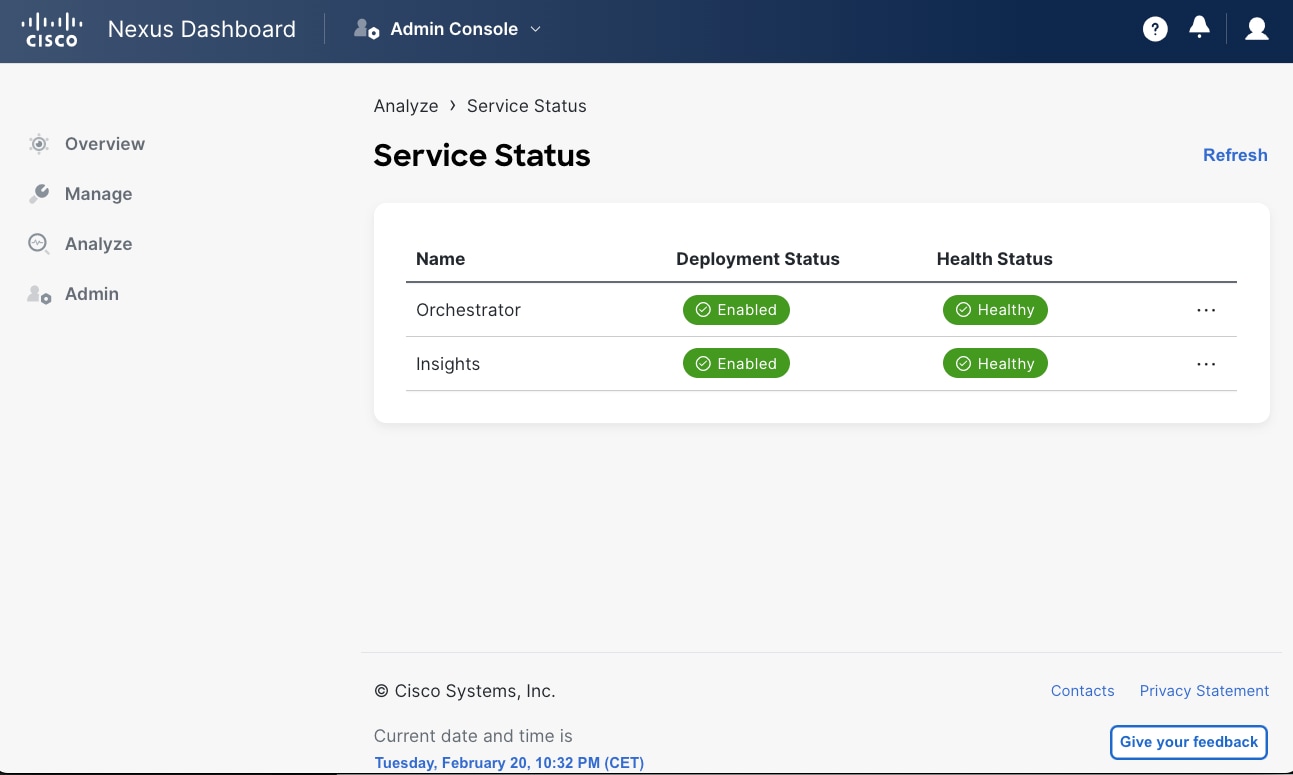
Figure 1 Running multiple services on the same ND platform
You can deploy different deployment modes and combinations of services depending on:
● Software version
● Cluster form factor
● Number of cluster nodes
Cohosting multiple services on the same Nexus Dashboard typically involves:
1. Scale impact
2. Sharing the same Nexus Dashboard version of code
3. Sharing the same Nexus Dashboard deployment specifics
4. RTT requirements follow the lowest common denominator between the cohosted services.
Use the Nexus Dashboard Capacity Planning tool to determine the exact scale support. In a cohosted design, as all services share the same Nexus Dashboard cluster, same software version and deployment specifics.
When selecting more than one service as part of the Nexus Dashboard deployment mode, the platform resources are shared across multiple services. This implies a reduction of scale of the number of switches that can be managed by the platform if the scale goes beyond the cohosting option chosen, it will be necessary to deploy multiple Nexus Dashboard clusters.
Note: This scale consideration stands because with the current design each service has access to its own database. In future releases, there will be a unification of resources, including database, for all services. This change of design aims to provide the same level of scale regardless of what services are enabled on Nexus Dashboard.
Sharing the Same Nexus Dashboard Version of Code
Cohosting services has the direct effect of sharing the same Nexus Dashboard version of code for the underlying platform across all the services. This may directly affect complexity of upgrades as there might be software dependencies between platform and each of the service cohosted to be verified in the Release Notes. Upgrading the platform also requires having a service interruption for all the services during the upgrade
Note: From Nexus Dashboard version 3.1, the deployment mode provides a unified experience for installation and management of the platform and service software. This simplifies and automates operations, removing the complexity of managing upgrades and software dependencies. As from Nexus Dashboard version 3.1, the system itself will assess and manage the upgrades for all the services packaged with a new ISO image version.
Sharing the Same Nexus Dashboard deployment specifics
When services are co-hosted, they are all deployed on a single Nexus Dashboard cluster and therefore sharing its deployment specifics. For example, if the cluster is deployed as directly connected or routed to the fabric (see Connection of Nexus Dashboard to the Fabrics), or if the nodes of the cluster are centralized or decentralized (see Centralized vs Distributed Deployments), those choices would apply to all services. Certain deployment specifics designs may better fit certain services, while being sub-optimal for other services.
Note: Deployment specifics are discussed in the next paragraph Centralized vs Distributed Deployments.
An alternative to cohosting of services on a common Nexus Dashboard cluster is the deployment of multiple Nexus Dashboard clusters managing the same network fabrics. This latter design is called colocation of Nexus Dashboard clusters. In a colocation scenario, each cluster may run different services (i.e. cluster1 dedicated to Insights, cluster2 dedicated to Orchestrator, etc.), and/or manage different fabrics (i.e. cluster1 managing ACI fabric1, cluster2 managing NX-OS fabric2, cluster3 managing ACI fabric3, etc.).
If resiliency and high availability are a priority, the general recommendation is to run collocated Nexus Dashboard clusters. This allows you to run an independent and dedicated cluster for each ND service, removing any possible dependency and allowing you to choose the most appropriate format and deployment specifics for each service.
However, as colocating different Nexus Dashboard clusters implies operating multiple platforms and dedicating the resources required for those multiple platforms, cohosting services on a common Nexus Dashboard cluster may be preferred if resiliency and high availability are not a priority.
Consideration for Onboarding of Multiple Independent Fabrics on the Same Nexus Dashboard
The typical use cases for onboarding different fabrics on the same Nexus Dashboard cluster are:
● Fabrics part of a multi-site architecture controlled by NDO or NDFC services.
● Fabrics that require inter-fabric connectivity operated by a single NDI service.
If none of the use cases above are met, the fabrics are operationally independent. In this latter case, onboarding the fabrics on the same Nexus Dashboard cluster is not strictly necessary.
Onboarding multiple fabrics on the same ND cluster could optimize resources, operations, and costs; however, several factors should be considered and respected:
● Scalability: Assess the scalability of the Nexus Dashboard cluster services. Consider the number of devices, endpoints, and the overall network size to ensure full support for the Nexus Dashboard services.
● Version Compatibility: Verify that all the devices within each fabric and the Nexus Dashboard cluster and services are running compatible software versions. Incompatible versions may lead to operational issues, so it's crucial to keep the software consistently updated. For more information, see the Nexus Dashboard Compatibility Matrix.
● RTT requirements: Make sure that all the fabrics are within the round-trip time (RTT) range of the service that needs to manage them.
Note: Onboarding multiple fabrics on the same ND cluster has no direct impact on system high availability.
Scale of Primary, Secondary, and Standby Nodes
Cisco Nexus Dashboard typically consists of a cluster of 1 or 3 primary nodes.
Note: 1-node cluster has no redundancy mechanism, and while it is fully supported for NDI or NDFC services, it is not recommended for production environments and will not be considered in this document.
In a cluster with 3 primary nodes, it is possible to provision additional secondary nodes. Cluster nodes are individual instances that work together to form a resilient and scalable cluster. These nodes collaborate to distribute the workload, enhance performance, and ensure high availability.
Primary nodes are intended to run Kubernetes control plane capabilities, like the API server, controller manager, scheduler, etc. (a distributed key-value store for cluster operational data). The control plane manages and controls the overall state of the cluster. On top of those control plane functions, primary nodes can also run Nexus Dashboard service pods.
Secondary nodes provide additional resources to the cluster to load share for Nexus Dashboard pods.
In a Nexus Dashboard deployment, as it happens for any Kubernetes cluster, first a cluster is formed with primary nodes only. Then additional secondary nodes are added to the cluster.
When adding nodes to an existing cluster, the additional nodes must be of the same form factor (physical or virtual) as the rest of the nodes in the cluster.
Once the cluster is up, you can always verify the role of nodes either from the GUI or from CLI command as shown in the following figures.
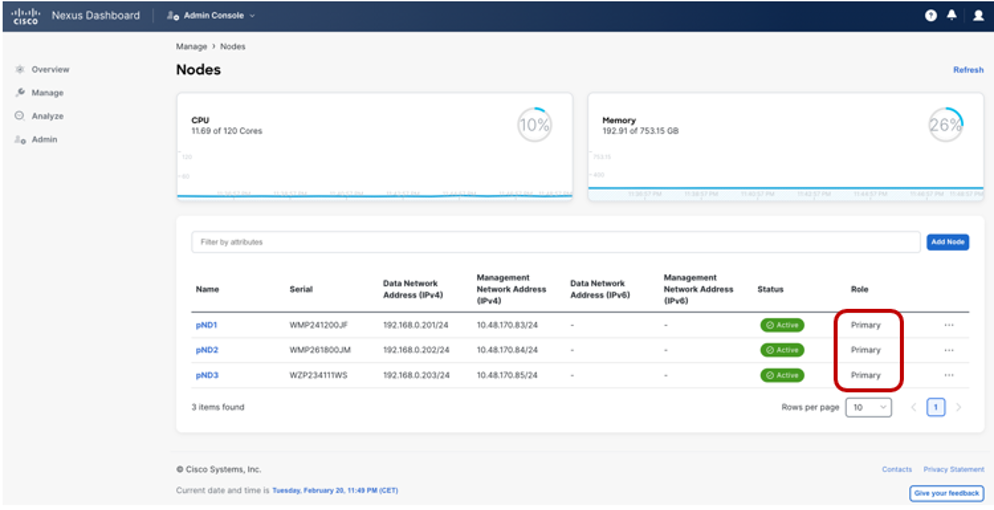
Figure 2 Nexus Dashboard UI showing the cluster node role
rescue-user@ND-SYS-100-NODE1:~$ kubectl get nodes
NAME STATUS ROLES AGE VERSION
nd-sys-100-node1 Ready master 5d11h v1.25.11
nd-sys-100-node3 Ready master 5d11h v1.25.11
nd-sys-100-node4 Ready master 5d11h v1.25.11
nd-sys-100-node5 Ready worker 5d11h v1.25.11
nd-sys-100-node6 Ready worker 5d11h v1.25.11
nd-sys-100-node7 Ready worker 5d11h v1.25.11
rescue-user@ND-SYS-100-NODE1:~$
Note: In the CLI output the role “master’ refers to primary and “worker” to secondary.
You can replace failed nodes only with nodes having the same role type.
It is possible to verify which Kubernetes pod is running in which cluster node either by using the ND GUI or by using the CLI.
From the UI, it is possible to verify which pods are running per node, as shown in the figure below.
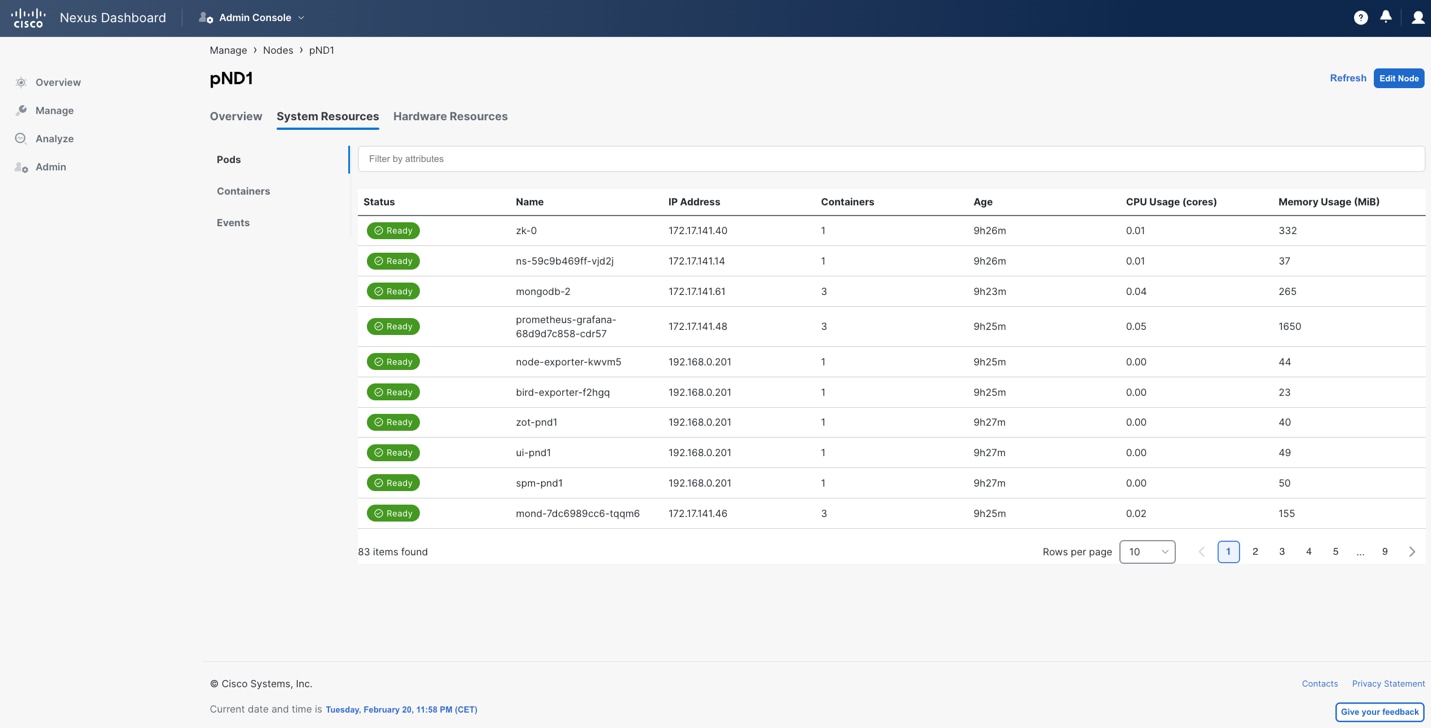
Figure 3 Nexus Dashboard UI shows the details of the pods running on the platform
From the CLI, you can use the kubectl commands to verify on which cluster node the pods are running.
rescue-user@ND-SYS-100-NODE1:~$ kubectl get pods -n cisco-nir -o=custom-columns='NAME:.metadata.name,NODE:.spec.nodeName'
NAME NODE
apicagent-6f898fcdbb-2zlwh nd-sys-100-node5
apicagent-6f898fcdbb-6ksfq nd-sys-100-node3
apiserver-5f547bf74b-dqgkn nd-sys-100-node5
apiserver-5f547bf74b-vqd97 nd-sys-100-node6
apiserver-5f547bf74b-xs5gs nd-sys-100-node7
aru-8678d6f76b-56l2g nd-sys-100-node6
aru-8678d6f76b-65b54 nd-sys-100-node3
aru-8678d6f76b-9p7mn nd-sys-100-node7
aru-8678d6f76b-hd6l4 nd-sys-100-node5
beaver-6c8c5f65-56nfg nd-sys-100-node6
beaver-6c8c5f65-d6c9q nd-sys-100-node5
beaver-6c8c5f65-wnzv4 nd-sys-100-node7
brain-7cf899964f-rbh7s nd-sys-100-node5
collector-5997685589-8kwrm nd-sys-100-node5
collector-5997685589-ggq7q nd-sys-100-node7
collector-5997685589-nc29x nd-sys-100-node3
collectorpersistent1-85d57d659-mbc89 nd-sys-100-node5
collectorpersistent2-85b4b7b6bf-n9ccz nd-sys-100-node6
collectorpersistent3-545d664d89-78xmv nd-sys-100-node7
correlator-85c979475f-2rfsq nd-sys-100-node5
correlator-85c979475f-j62tv nd-sys-100-node3
devicepolicymgr-6bf776b97c-npnlm nd-sys-100-node6
dgraph-64694ddcb-rjl42 nd-sys-100-node3
flow-aggregator-6759898ddc-25w6v nd-sys-100-node3
flow-aggregator-6759898ddc-6pc62 nd-sys-100-node7
flow-aggregator-6759898ddc-mq69d nd-sys-100-node6
flow-aggregator-6759898ddc-qglc6 nd-sys-100-node1
[…]
rescue-user@ND-SYS-100-NODE1:~$
Nexus Dashboard uses Kubernetes techniques to maximize redundancy. Most Kubernetes resources are based on Kubernetes deployments. In Kubernetes, a deployment is a crucial abstraction for ensuring redundancy in containerized applications. It enables the definition and management of pods, to enhance availability and fault tolerance. In a Kubernetes deployment, it is possible to specify the desired number of pod replicas, automatically handling their creation, scaling, and distribution across the cluster.nodes Redundancy is achieved by maintaining multiple identical replicas of the application, allowing Kubernetes to automatically replace failed pods or redistribute workloads in case of node failures. This redundancy ensures consistent service availability, resilience to hardware or software failures, making Kubernetes deployments a fundamental building block for creating robust and reliable distributed applications.
You can verify from the CLI the Kubernetes deployments using the kubectl command as per the following example:
rescue-user@ND-SYS-100-NODE1:~$ kubectl get deployments -n cisco-nir
NAME READY UP-TO-DATE AVAILABLE AGE
apicagent 2/2 2 2 5d6h
apiserver 3/3 3 3 5d6h
aru 4/4 4 4 5d6h
beaver 3/3 3 3 5d6h
brain 1/1 1 1 5d6h
collector 2/3 3 2 5d6h
collectorpersistent1 1/1 1 1 5d6h
collectorpersistent2 1/1 1 1 5d6h
collectorpersistent3 1/1 1 1 5d6h
configagent 0/0 0 0 5d6h
correlator 2/2 2 2 5d6h
debugplugin 0/0 0 0 5d6h
devicepolicymgr 1/1 1 1 5d6h
dgraph 1/1 1 1 5d6h
flow-aggregator 6/6 6 6 5d6h
flow-correlator 6/6 6 6 5d6h
flowsink 6/6 6 6 5d6h
genie 6/6 6 6 5d6h
gollum 1/1 1 1 5d6h
horcrux 1/1 1 1 5d6h
[…]
rescue-user@ND-SYS-100-NODE1:~$
In a physical form-factor cluster, all nodes should be the same type of Cisco UCS servers. If you combine multiple different hardware nodes, i.e. UCS-C220-M5 (SE-NODE-G2) and UCS-C225-M6 (ND-NODE-L4), then the lowest hardware generation scale would apply for the cluster.
In a virtual form-factor cluster, primary nodes are ‘Data’ profile nodes, while secondary nodes are ‘App’ profile nodes. This latter profile has lower requirements in terms of virtual CPU, memory, and storage compared to the Data node profile.
Note: It is not possible to change the profile for an existing virtual node.
In virtual form-factor cluster, when only 3 primary nodes are deployed, they can be deployed as ‘App’ profile. As 6-node virtual cluster requires 3 primary nodes deployed as ‘Data’ profile, it is not possible to promote an existing 3 ‘App’ profile node cluster to a 6-node virtual cluster.
App profile nodes are generally recommended for non-data-intensive applications, such as Nexus Dashboard Orchestrator or Nexus Dashboard Fabric Controller. From Nexus Dashboard 3.0 release, also Nexus Dashboard Insights supports running virtual nodes with the App profile. However, for maximum scale performance, a Data node profile is required.
The Nexus Dashboard Capacity Planning tool describes the minimum number of cluster nodes and, in case of virtual nodes, of which profile, for different services and scale.
At the time of writing of this document, the only Cisco validated options with secondary nodes are the following:
● 3 primary virtual nodes and 3 or 6 secondary virtual nodes
● 3 primary physical nodes and 3 secondary physical nodes
Note: From Nexus Dashboard 3.2 release, 6 secondary node clusters are no longer needed for greenfield deployments.
Nexus Dashboard also provides the concept of a standby node. A standby node can be added to an existing formed cluster.
You can add up to two standby nodes.
Note: Standby nodes are only supported with 3-nodes (or more) Nexus Dashboard cluster deployments. Standby nodes are not supported with a 1-node Nexus Dashboard cluster.
Note: A standby node is supported both for virtual and physical form factor. In the case of virtual form factor, the standby node must be the same type as the primary cluster nodes. i.e. ‘Data’ or ‘App’ node type.
A standby node cannot directly replace secondary nodes. If a secondary node fails, the cluster continues to operate with the remaining nodes, as long as a quorum is maintained. The following considerations should be done regarding the increase in the number of cluster secondary nodes.
Increased Performance and Enhanced Scalability
A larger number of cluster nodes within supported scale allows for better distribution of tasks and workloads, leading to improved system performance and reflected in higher scale support.
Additional cluster nodes enhance the scalability of the system, accommodating the growth of the network infrastructure. As the network expands, you can add more cluster nodes to scale to a higher number of switches and fabrics.
More cluster nodes may also increase cohosting capabilities. You can refer to the Nexus Dashboard Capacity Planning tool for further information on scale and cohosting.
Efficient Resource Utilization
The distribution of tasks across numerous nodes promotes efficient resource utilization, preventing overloading on any single node.
Resource-intensive tasks can be distributed, preventing performance degradation.
Cost Implications and Complexity of Management
The cost of additional cluster nodes, either in terms of hardware or virtual resources, should be considered.
However, as the number of nodes increases, the increase of complexity of managing the cluster is negligible. Nexus Dashboard platform fully manages all cluster nodes from a lifecycle and connectivity management standpoint. The only additional operational burden is due to the racking and stacking of the extra cluster nodes (if physical form factor) or planning of virtual computing resources (if virtual form factor), the need for reserving additional IP addresses and the replacement handling in case of failure.
For considerations regarding node failure and their impact on high availability, see Failure Scenarios and Impacts.
Recommendation: As a general recommendation, cluster size should be solely chosen based on scalability and co-hosting requirements, as adding more secondary nodes would not directly provide any benefit in terms of redundancy and resiliency of the system.
Consider standby nodes to quickly restore full cluster size in case of a node failure.
Single node failure
ND platform services remain available with a single node failure however primary or secondary node failure in an ND cluster can have an impact on platform and services:
A transient impact may be experienced on the cluster. Some services get rebalanced from the failed node to the others available. During this process the following may be experienced:
● The UI may not be responsive or providing unexpected messages. This is applicable for ND platform and all services (NDI, NDO, NDFC).
● Ingested data sent to the ND failed node from switches may be temporary lost until the collectors running on the failed node are rebalanced across the remaining nodes. This applies for NDI.
● Certain NDI dynamic jobs, including assurance collection, bug scan and user triggered jobs may fail.
In case of failure of a primary node, until the failed node is restored, the cluster would run in degraded state. Less resources are available for the cluster and as a consequence, some dynamic jobs (i.e. connectivity analysis, bug scan, pre change validation) may fail to be instantiated. Also, the capacity of the cluster may be limited, and some telemetry may fail to be collected. This would apply for NDI and NDFC.
In case of failure of a secondary node, there should not be any significant degradation of services. However, if the cluster was operating close to its maximum scale capacity, impact may be expected in performance and collection of data.
Recommendation: Restore the failed node as soon as possible, both in case of loss of a primary or secondary node. Do not to run any dynamic jobs in NDI nor provision new configuration from NDFC and NDO until the failed node is replaced and the cluster is fully restored.
Note: A standby node is meant to quickly restore the cluster functionality by replacing failed primary or secondary nodes with the standby mode. Standby nodes are not actively participating in any cluster operation until they are replacing a failed node.
The figure below shows the selection of Type (Standby) when adding a new node. The process is not dissimilar from the addition of a secondary (worker) node.
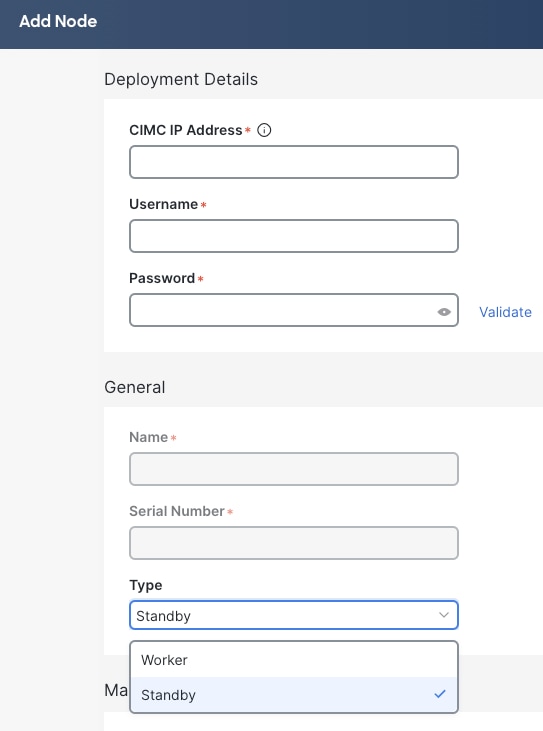
Figure 4 Nexus Dashboard UI shows how to add a new cluster node of type Standby
If a single primary or secondary node fails, Nexus Dashboard can be quickly restored to full cluster size by failing over the failed node to a standby node. The figure below shows the operation of failing over from the GUI.
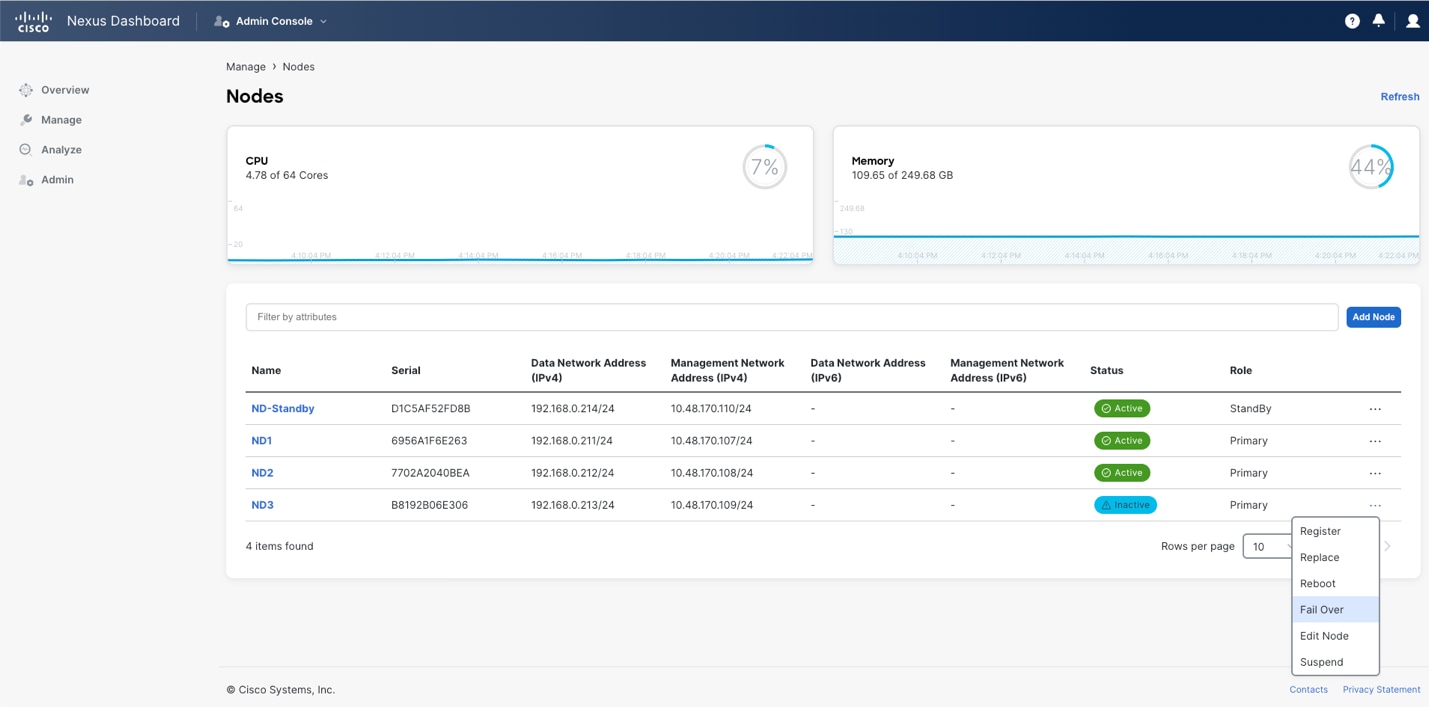
Figure 5 Nexus Dashboard UI showing how to fail over a failed node
As an alternative to failing over a primary failed node to a standby node, it is also possible to replace the node with a green-field node (the node must be simply booted up with no cluster configuration performed) that runs the same Nexus Dashboard version of code as the existing cluster. The replace option is available for inactive primary nodes on the UI as shown in the figure above as an alternative to fail over to the standby option.
The main difference between replacing and failing over is that in case of failover, an existing standby node must already be set in place and added to the cluster. With the replacing option, instead, a new node providing the replacement can be added when needed.
Note: With failover, the promoted standby node retains its original assigned IP address, whereas replace assigns the failed node's addresses to the replacement node.
For faster operation, a standby (failover) node is typically recommended. However, this implies dedicating other physical or virtual resources for standby nodes and therefore higher costs.
Note: After the failed node is replaced, some services get rebalanced to restore back the full availability of the cluster nodes. Database shards will also get redistributed during this phase and this process may take several minutes. Minimal degradation of services may be experienced during this restoration.
Double node failure
Nexus Dashboard handles double node failure differently if you are running version 3.1 and earlier or 3.2 and later. The following paragraphs describes the 3.2 and later scenario. Refer to the Appendix of this document for 3.1 and earlier behavior.
From Nexus Dashboard release 3.2, it is not possible anymore to restore the failure of two primary cluster nodes. This means that if this double failure occurs, the entire cluster must be restored from a backup. Nexus Dashboard 3.2 allows to perform a unified backup and restore procedure. This feature performs simultaneously a backup of the platform (including its cluster deployment mode) and of the services running on the platform. A restore of such backup would restore all running services and platform configuration. Details of this enhanced backup and restore capability can be found here https://www.cisco.com/c/en/us/td/docs/dcn/nd/3x/articles-321/nexus-dashboard-back-up-and-restore-unified-321.html#_how_backup_and_restore_is_implemented_with_the_unified_nd_3_2_1_release.
Recommendation: Back up your platform and services on a regular basis. Nexus Dashboard version 3.2 and above allows scheduling automated backup. It is strongly recommended to use this capability. Store backup files in multiple geographical locations. Backups can be used to restore a cluster in case of its loss.
Disk Failure
Nexus Dashboard cluster nodes are provided with RAID0 configuration for their HDDs. RAID0 has been chosen to provide best resource utilization and performance of the cluster. However, as a consequence, this implies that failure of a single disk would provide loss of operational data and could severely impact the server. If you experience a SSD, HDD, NVME, or M.2 disk failure, take a backup of the data and replace the server as soon as possible.
The following is the view of the HDD from the Cisco Integrated Management Controller (CIMC) of a Nexus Dashboard node.

Figure 6 View of the HDD from CIMC of a Nexus Dashboard node
NIC Failure
All physical Nexus Dashboard cluster nodes are provisioned with 2 management network NICs and 2 data network NICs.
The best practice is to connect each of the interfaces to a different switch. Nexus Dashboard automatically creates two Linux bond interfaces, one for management and one for data networks. Those bond interfaces will work as an active/standby pair.
If the active port connectivity is lost, Nexus Dashboard node automatically failovers to the standby interface.
Centralized vs Distributed Deployments
Nexus Dashboard, a critical component in network management, demands careful consideration for the physical placement of its cluster nodes to ensure optimal system resiliency.
Note: Refer to previous paragraph Failure Scenarios and Impact for more information about cluster resiliency.
In this context, the definition of Availability Zone (AZ) is a location which is independent from another with regards to disasters. The decision to deploy nodes in the same Availability Zone (AZ) (also known as ‘Centralized’ design) or across different AZs (also known as ‘Distributed’ design) directly influences the system's ability to withstand failures and maintain seamless operation. This analysis explores the implications of these choices, focusing on their impact on resiliency.
Centralized Deployment
The figure below shows an architecture where all the nodes in a Nexus Dashboard cluster are in the same Availability Zone. In this case, the concept of Availability Zone is directly mapped to a DC location.
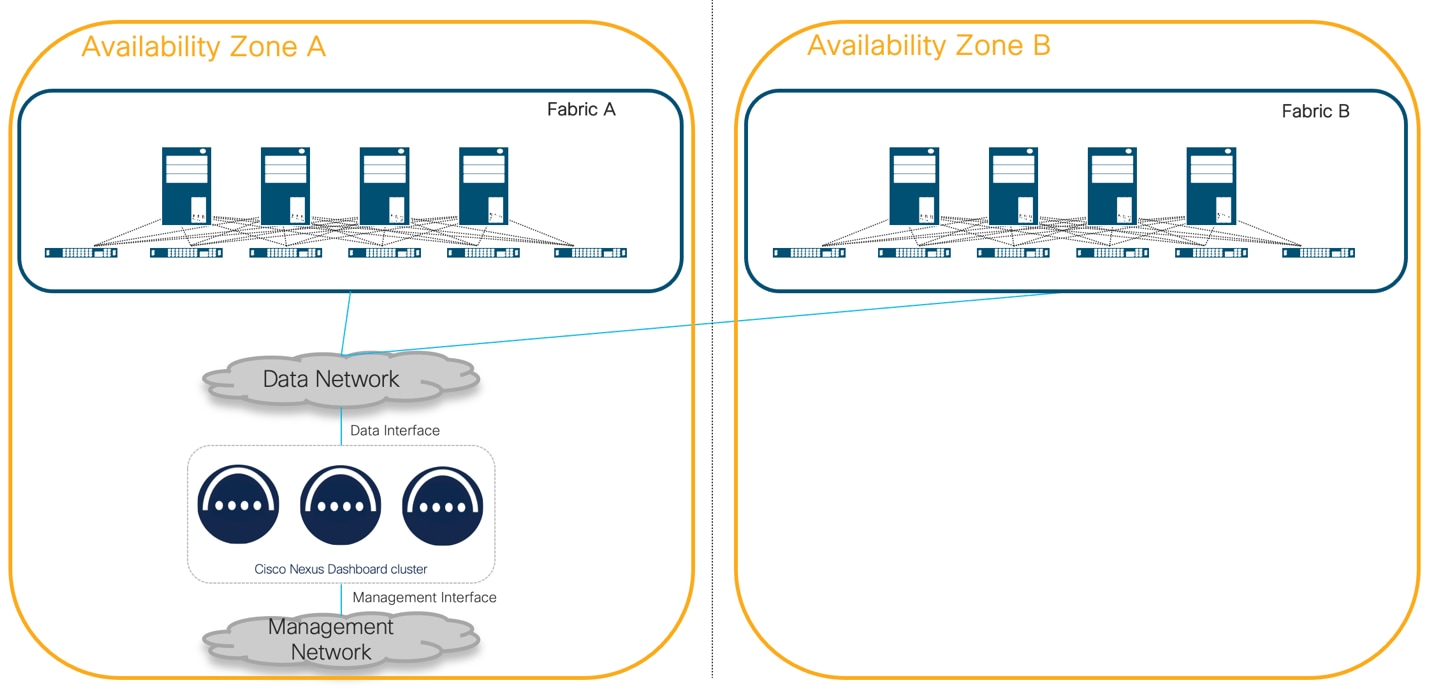
Figure 7 Nexus Dashboard cluster located in the same Availability Zone
The benefits of this type of deployment are:
● Low Latency Communication: Nodes within the same AZ benefit from reduced communication latency, facilitating quick data exchange. Services do require RTT between the nodes that ranges between 50ms and 150ms. This is documented and can vary depending on the software version. This information is available in the Nexus Dashboard and Services Deployment and Upgrade Guide.
● Simplified Network Topology: Intra-AZ communication is typically simpler, reducing potential points of failure and easing network management. Some Nexus Dashboard services require Layer 2 adjacencies between cluster nodes. For more information, see the Nexus Dashboard and Services Deployment and Upgrade Guide.
The limitations of this type of deployment are:
● Limited Geographical Diversity: In the event of a catastrophic event affecting the entire AZ, all Nexus Dashboard nodes are exposed to the same risks, potentially leading to a complete system outage.
Recommendation: To limit the impact of a catastrophic failure with a loss of a geographical region where a Nexus Dashboard cluster is deployed, the recommendation is to back up platform and services regularly and store the backup files in multiple geographical locations. You can use the backup files to restore the cluster and service configurations to a new cluster. Refer to the section below for more details.
To ensure quick restoration of services, resources to redeploy the cluster in a different location should be available. If the lost cluster is virtual, enough virtual resources should be available in a different location. If the lost cluster is physical, a physical cluster with the same size should be available at a different location.
The figure below shows an architecture where nodes in a Nexus Dashboard cluster are in different Availability Zones. In this case, the concept of Availability Zone is directly mapped to a network fabric.
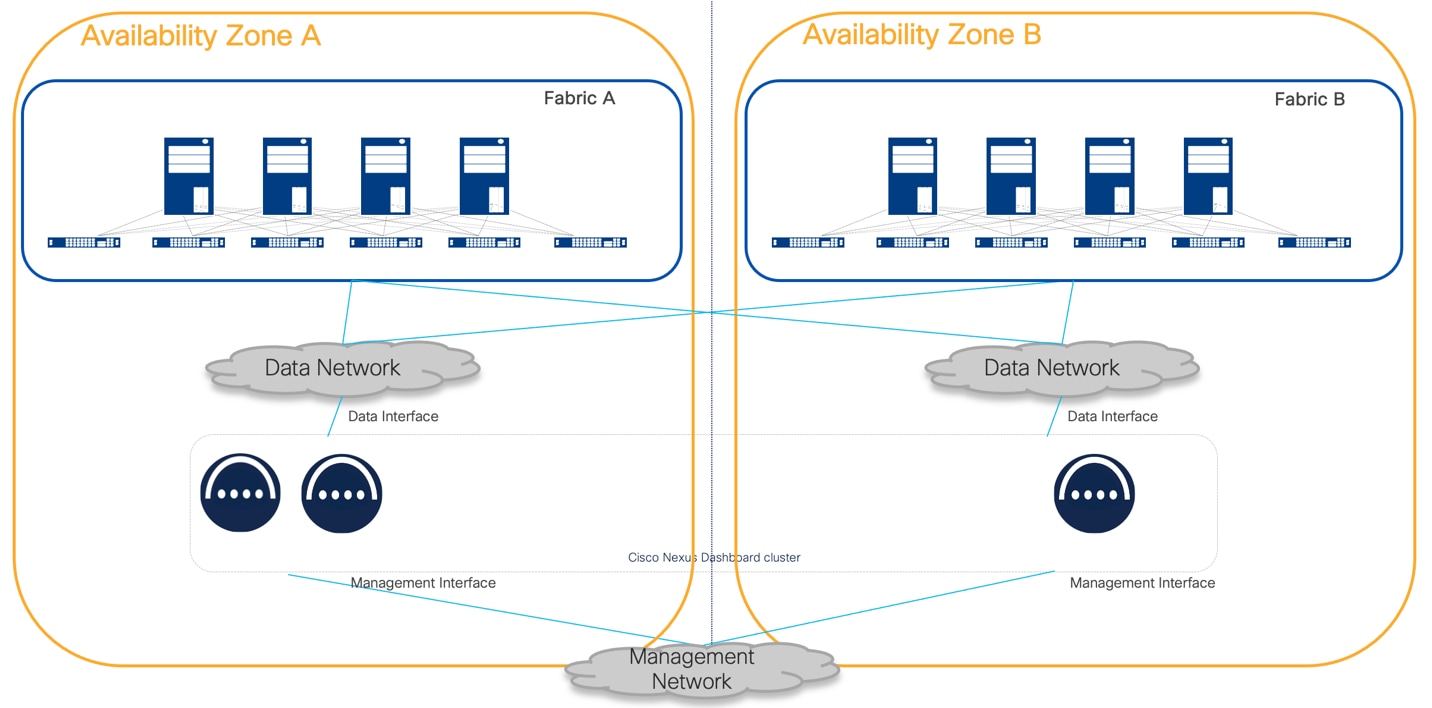
Figure 8 Nexus Dashboard clusters located in different Availability Zones
The limitations of this type of deployment are:
● In Nexus Dashboard 3.2 and later, the failure of Availability Zone A where two primary cluster nodes reside makes the cluster unavailable and unrecoverable.
● Complex Network Configuration: Managing communication between nodes in different AZs requires a more sophisticated network architecture, potentially leading to increased operational complexity. For example, in the software release current at the time of writing this white paper, NDI requires Layer 2 cluster node connectivity for NDFC fabric types. This poses the strict requirement to extend Layer 2 across AZs where the ND cluster nodes are placed.
● Higher Operational Costs: Data transfer between AZs may incur additional costs, and the need for redundant resources in different AZs can increase overall operational expenses.
● If a deployment with L2 adjacency for data network of the Nexus Dashboard cluster nodes is chosen, it implies the requirement to stretch this L2 data network across the locations where the cluster nodes are deployed.
● A deployment with L3 mode for data network of the Nexus Dashboard cluster nodes allows to use different subnets for each cluster node data interface. If cluster nodes are placed in different sites and they are in L3 mode, routed connectivity across data network L3 subnets is sufficient. However, consider that L3 adjacency for data network interfaces of the ND cluster nodes is not supported if NDI is deployed.
Note: NDI does not support L3 mode deployment for ND Data interface: in a distributed cluster with NDI deployment, L2 must be stretched across sites to allow having a single subnet for data interface of the cluster nodes.
Best Practices for Placement of Cluster Nodes
Nexus Dashboard handles failure scenarios differently if you are running version 3.1 and earlier or 3.2 and later. The following paragraphs will describe best practices for placement of cluster nodes based on release ND 3.2 and later. For Nexus Dashboard 3.1 and earlier refer to the Appendix of this document.
Nexus Dashboard cluster can’t tolerate the loss of two primary nodes. This statement is valid for any service installed on the platform. This design has been chosen to provide more predictable failure and recovery scenarios for ND users, regardless the service combination running on the platform.
As a consequence, NDO, NDI and NDFC services tolerate the loss of a single ND primary node. A single cluster node loss can be restored by failing over to a standby node. If a single primary node failure happens, Nexus Dashboard may experience a short temporary disruption of services while the platform rebalances its resources.
Recommendation: In a single node failure scenario, we recommend restoring the failed node as soon as possible to restore high availability and to avoid loss of data following an eventual second primary node failure.
Restoring a single primary node can be achieved by either failing over the failed node to a standby node if available, or to replace it with a spare virgin node running the same Nexus Dashboard version.
When running ND 3.2 and later, NDO, NDI and NDFC services do not support the loss of two primary nodes. Platform and services would suffer a complete disruption. The UI and API would not be accessible and services cannot be restored on the failed cluster. Restoration of services require reinstallation of the ND green-field cluster and restoration of backup taken from the failed platform.
Note: While writing this document, Nexus Dashboard Orchestrator has a limitation related to restoring its configuration via backup. The limitation consists in the fact that the restoration of the configuration would fail if one or more fabrics managed by NDO are not reachable. This implies that currently the backup restore procedure in a DR scenario, is not supported for NDO.
Secondary nodes may provide an increase of scale for services; however secondary nodes do not provide direct resiliency increases, as the ND platform core pods run on primary nodes.
We recommend adding secondary nodes as per scalability user requirements as defined in the ND Capacity Planning tool.
Loss of secondary nodes are tolerated, and services be operational, but, as resources decrease, performance are degraded until the cluster size is restored by replacing the faulty node.
Note: Losing secondary nodes may destabilize the system for a short period of time as services must rebalance across the remaining nodes. This implies possible slowness of the system in terms of responsiveness.
When running Nexus Dashboard 3.2 and later, Cisco supports Nexus Dashboard deployments only as a centralized cluster in a single site. Stretched Nexus Dashboard clusters are not supported in Nexus Dashboard 3.2 and later. This architecture is simpler and more resilient because inter-AZ communication loss does not affect the cluster.
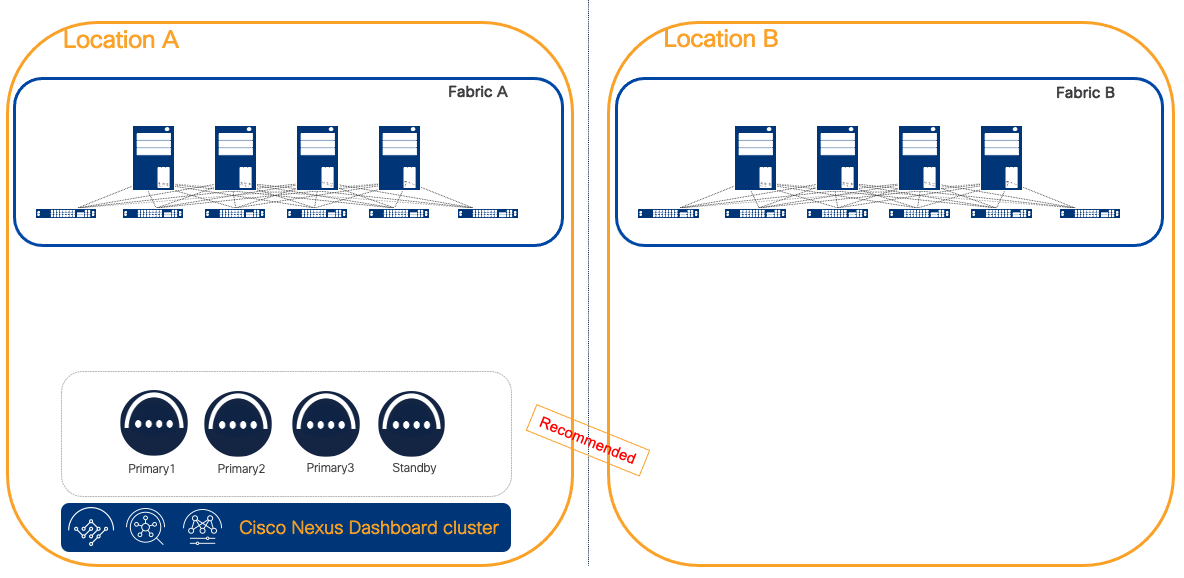
Figure 9 Recommended deployment as a centeralized ND cluster 3.2 and later
Recommendation: As the loss of two primary nodes would not be tolerated, we highly recommend restoring a single primary faulty node as soon as possible. This would limit any risk to lose data. To facilitate this process, we always recommend using a standby node for physical form factor-based clusters, thereby speeding up the failover of a faulty node. The alternative would be to request for a Return Material Authorization (RMA) of the faulty node, which would be more time-consuming and extend the system’s degraded services and lack of high availability.
Disaster Recovery Consideration
In the case of a disaster, i.e. the loss of an entire Nexus Dashboard cluster as a consequence of a site loss, consider these things:
- A backup for platform and each of the services is required for restoration of the cluster. The recommendation is to store frequently backups in a multiple geographical locations.
- The cluster can be restored through the backup, assuming that it is available another Nexus Dashboard cluster. The recommendation is to restore the backup into a cluster with the same form factor and size as the failed one.
- If DR scenarios must be supported with a certain SLA, the recommendation is to keep a spare standby Nexus Dashboard cluster in a different location as opposed to the primary. This latter shall have connectivity and respect RTT requirements to all fabrics as onboarded on the active cluster.
- Currently NDO backup cannot restored unless all sites are reachable. This means that DR scenarios are currently not supported by NDO if a cluster restoration is necessary.
Note: In disaster recovery scenarios, it is important to consider that Nexus Dashboard Insights can only restore the service configuration, but historical telemetry and analysis cannot be restored from a backup.
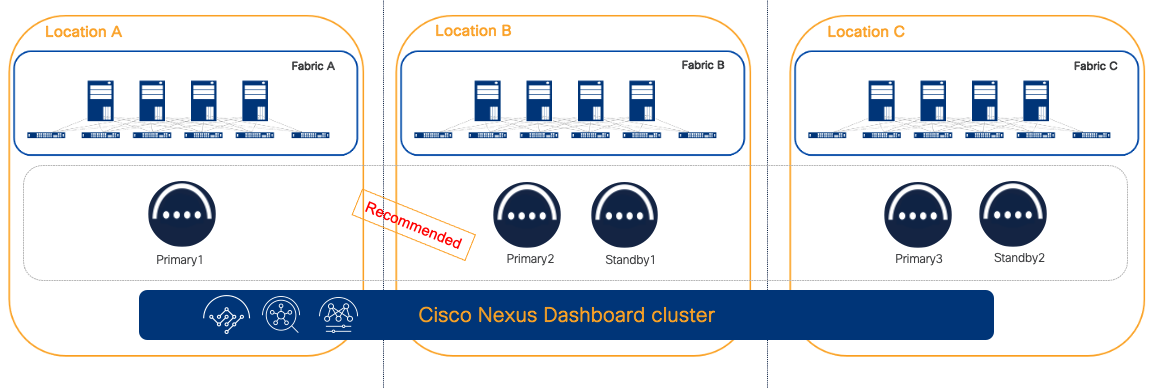
Figure 10 Active and standby Cluster for DR design
Recommendation: If disaster recovery scenarios require a strict SLA, a standby Nexus Dashboard cluster of the same format and size of the active cluster should be available.
Connection of Nexus Dashboard to the Fabrics
Nexus Dashboard clusters can be connected to the fabrics using either of the following options:
● Connectivity via fabric routed network
● Direct connectivity to fabric switches (i.e. ACI EPG or Cisco NX-OS In-band management)
Recommendation: We recommend connecting the Nexus Dashboard cluster to the fabric through a routed network if there is more than one fabric managed by ND services.
This solution is preferred because it does not tie the cluster to any specific fabric. The routed network should be able to route traffic to all the fabrics independently.
For more information, see the Nexus Dashboard and Services Deployment and Upgrade Guide for further guidance on the requirements for this architecture.
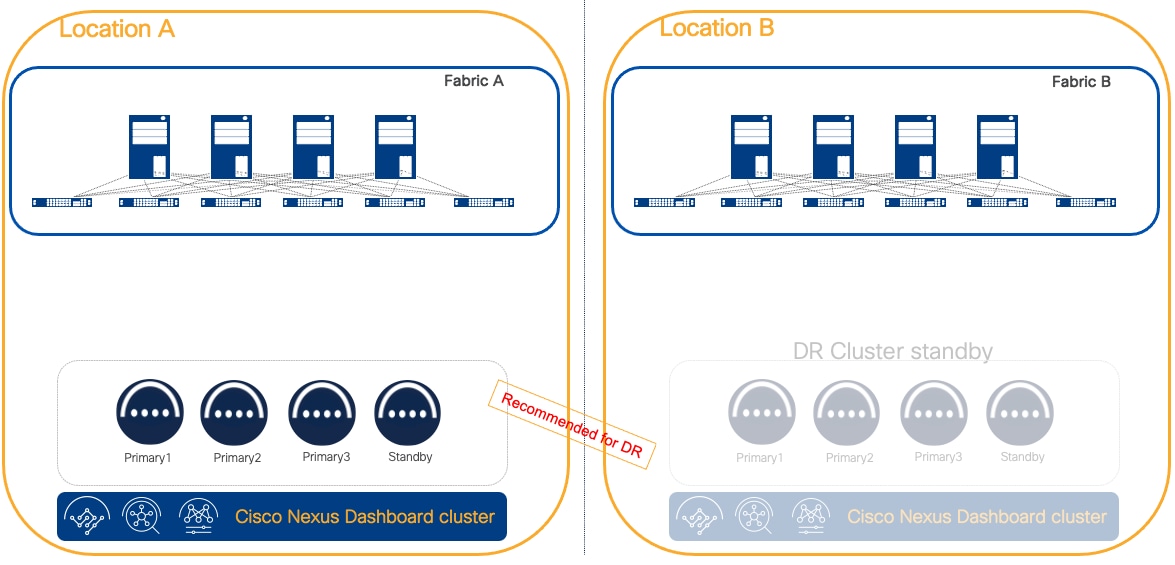
Figure 11 Nexus Dashboard routed connectivity to the fabrics
The benefit of this connectivity is that failure of any fabric would not affect the connectivity of Nexus Dashboard clusters to any other. It is crucial to plan the routed network to make sure it is redundant, provides the bandwidth and RTT guaranteed to ensure a solid and reliable connection.
From a topology design standpoint, there is a direct connection to the Nexus Dashboard cluster nodes that are directly attached to the fabric. Consider the physical and logical topology of the network to ensure that direct connections align with your overall network design. For more information, see the Nexus Dashboard and Services Deployment and Upgrade Guide for further guidance on the requirements for this architecture.
This connectivity is less preferred than routed connectivity as it ties the ND cluster to a specific fabric. If ND is dedicated to a single fabric, this design can be simpler as it removes the need to build an external independent routed network to connect to the fabric.
One important consideration with direct connectivity, is that in case of multiple fabrics managed by the same Nexus Dashboard, connectivity of ND cluster nodes to other fabrics must use an ACI L3Out or Cisco NX-OS external connectivity. In other words, you cannot extend in-band fabric connectivity to the Nexus Dashboard cluster nodes through VXLAN data plane across the IPN or ISN networks.
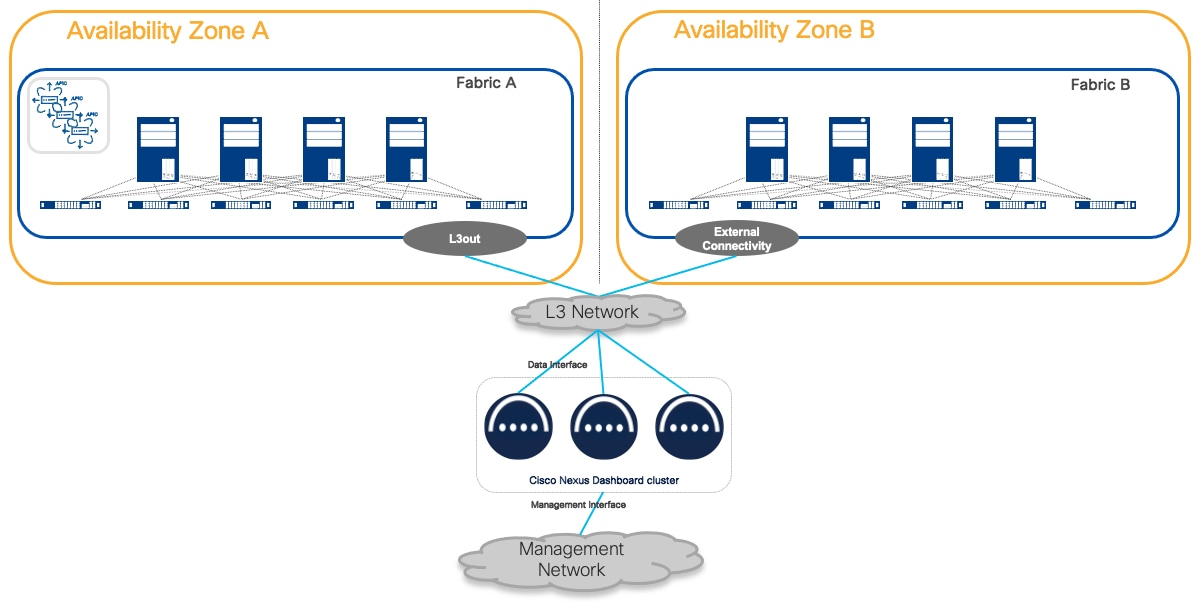
Figure 12 Nexus Dashboard connectivity to fabric in a centralized design
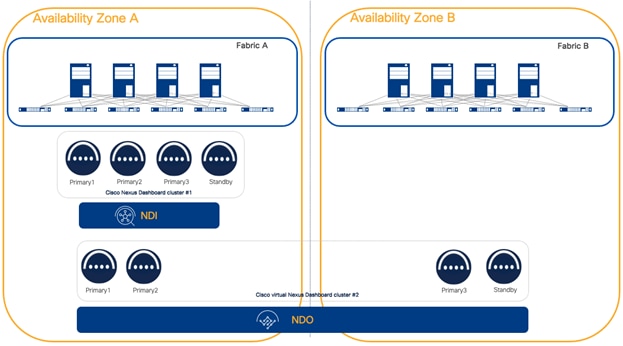
Figure 13 Nexus Dashboard connectivity to a fabric in a centralized design
This white paper has provided a comprehensive guide to deploying a highly available Cisco Nexus Dashboard cluster. By following the outlined steps and considering the recommended best practices, network administrators can ensure the efficient operation and resilience of their data center network management infrastructure.
Cisco Nexus Dashboard Documentation
Cisco Nexus Dashboard Capacity Planning
Note: The information provided in this white paper is based on the Nexus Dashboard 3.2 and older release and corresponding services. Always refer to the latest Cisco documentation for the most accurate and up-to-date information.
Double primary Node failure with Nexus Dashboard 3.1 and earlier
Up until Nexus Dashboard 3.1 included, in the case of the loss of two primary nodes, the ND platform becomes unavailable. In this situation, if 2 standby node(s) are available, the ND platform can be fully restored by accessing the CLI of the survival node using the rescue-user and manually failing over the failed nodes to a new available primary node.
You can verify from the working node the nodes that failed and the standby nodes using the “acs show nodes” command.
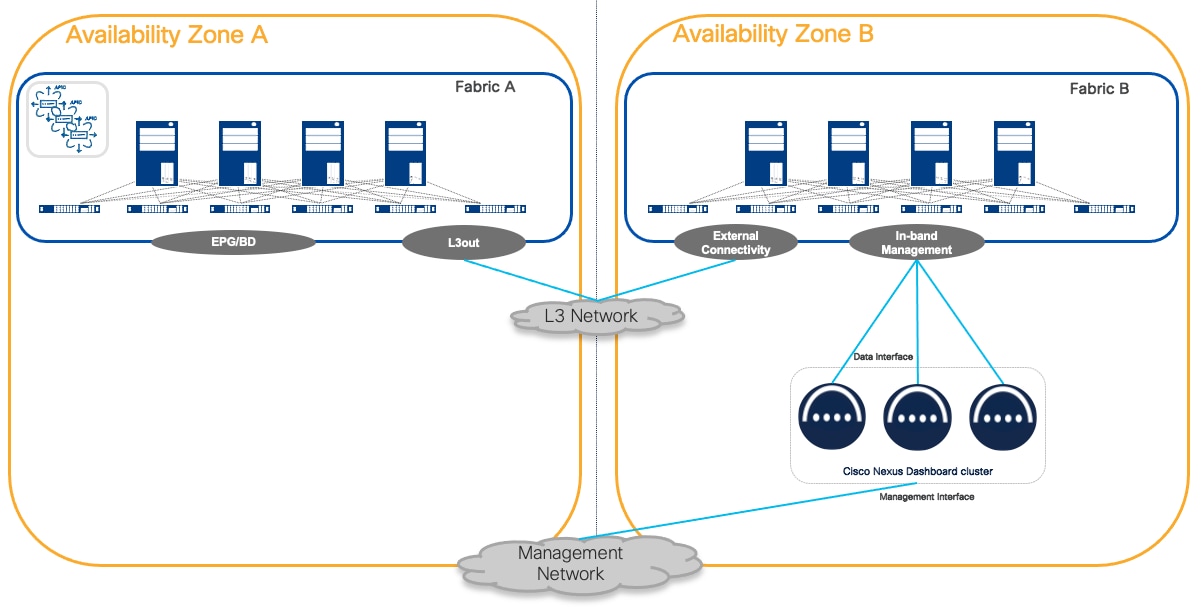
Figure 14 acs show nodes command displays the status of the cluster nodes
After verifying this, you can use the command “acs failover --failedIP <IP_failed_node1> --failedIP <IP_failed_node2> --standbyIP <IP_Standby>”.
rescue-user@ND1:~$ acs failover --failedNode 192.168.0.212 --failedNode 192.168.0.213 --standbyNode 192.168.0.214
Warning: Failover can be a disruptive operation and should only be performed as last resort option to recover cluster from disasters using standby where two master nodes have lost their state due to hardware faults. Proceed? (y/n):y
Following this command, state is copied from the remaining primary to the standby node. Both nodes will reboot and the standby node will boot up as a primary node.
The recovery process may take several minutes. At the end of this process, the ND platform will be restored. However, when two primary nodes are lost, some services may suffer complete operational data loss and once the platform is restored, they may have to be reinstalled. Specifically, NDI and NDFC would not survive double primary node failure scenarios, while NDO service will be fully restored as soon as at least two primary nodes are available.
Once the recovery process is completed, you will be in a 2 primary cluster node state. At this point ND user interface is fully operational, so the second standby node can be used to replace the second failed primary node and restore fully Nexus Dashboard.
Note: In case of a double failure scenario, only if a standby node is available, it is possible to restore the cluster.
In version 3.1 and earlier, ND platform and services do not support unified backup of services and platform so they must be taken individually. Also, scheduled backups are not supported up until Nexus Dashboard 3.1 included. You can retrieve platform backups from the UI as per the following example.
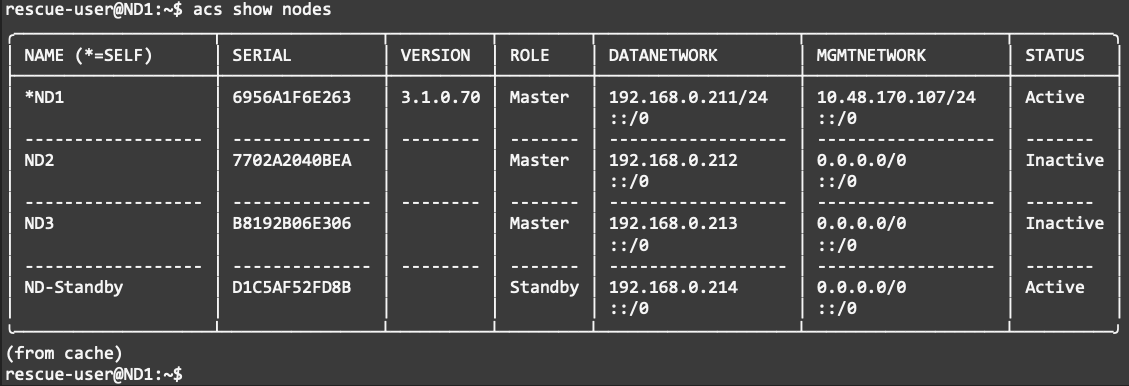
Figure 15 Backup and restore on the Nexus Dashboard Admin Console
Each service can export its configuration at the service level, as per the following example for the NDI service.
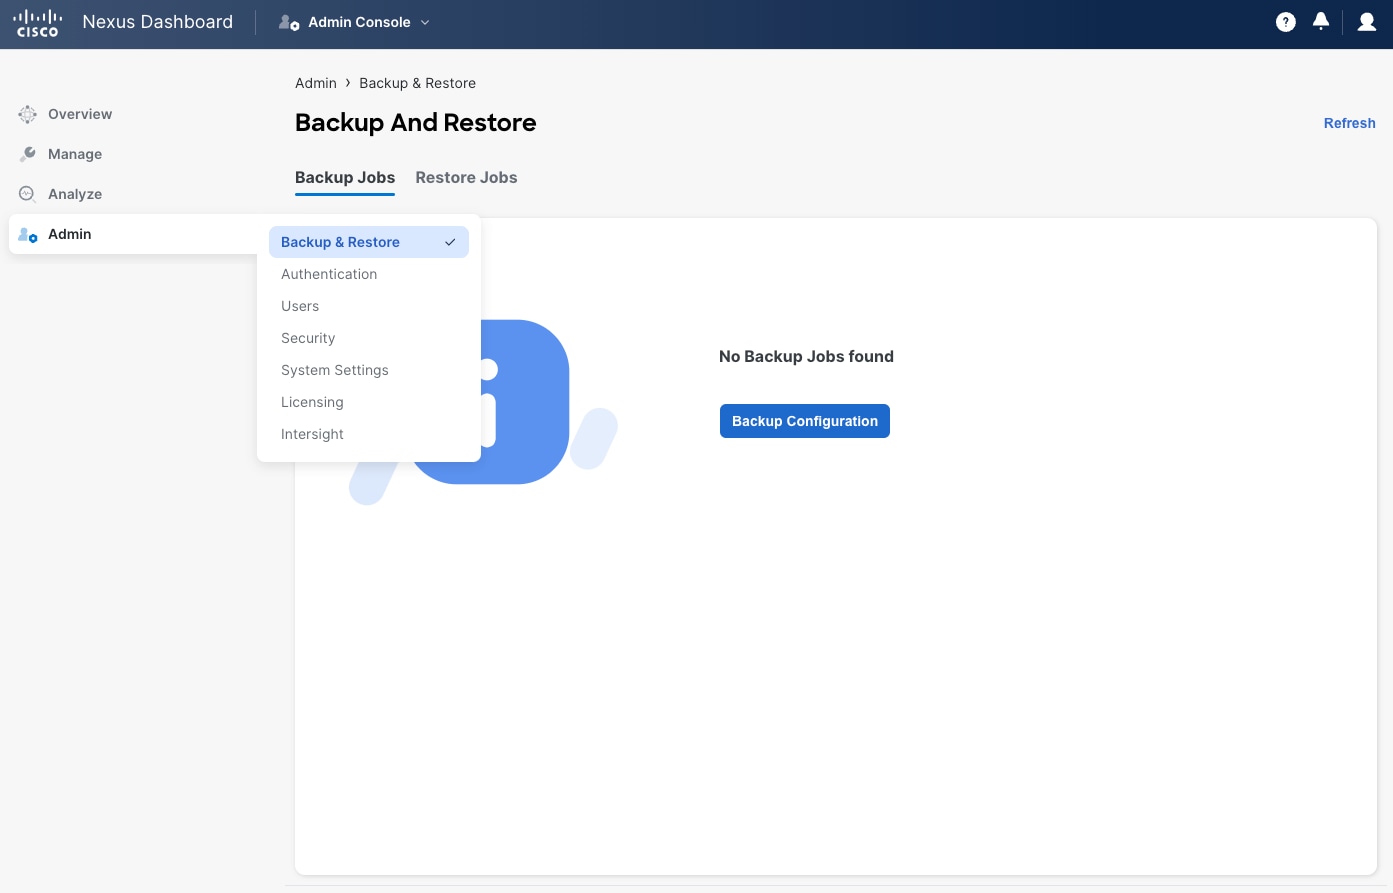
Figure 16 Export configurations at the NDI service level
Use backup files to restore the cluster and service configurations into a new cluster.
To ensure quick restoration of services, make sure resources to deploy a backup cluster are available. If the lost cluster is virtual, enough virtual resources should be available. If the lost cluster is physical, a backup cluster with the same size is available.
Note: It is important to consider that Nexus Dashboard Insights can only restore the service configuration. You cannot restore historical telemetry and analysis from a previous backup. Both NDO and NDFC can restore all operational data from a backup.
Best Practices for placement of cluster nodes with Nexus Dashboard 3.1 and earlier
The physical placement of Nexus Dashboard cluster nodes plays a crucial role in determining the resiliency of the system. If running Nexus Dashboard version 3.1 and earlier, deploying nodes within the same AZ offers advantages such as low latency and simplicity, it comes with the risk of a single point of failure. On the other hand, distributing nodes across different AZs enhances system resiliency, providing protection against broader infrastructure issues, albeit at the cost of increased complexity and potential latency. The decision ultimately depends on the specific requirements of the organization, weighing factors such as the criticality of low latency, the level of geographic diversity needed, and the tolerance for increased operational complexity and costs. Careful consideration of these implications is essential to design a Nexus Dashboard cluster that meets the desired balance between performance and resiliency.
Certain ND services would however not benefit a higher HA when cluster nodes are spread across AZs.
Let’s review the details service by service.
ND Platform
The recommendation of placement for an ND cluster is based on the services that the ND platform runs. In this section we will only describe considerations regarding the resiliency of the platform.
NDO
For NDO, the general best practice is to distribute the cluster nodes across different sites for the following reasons:
● NDO does not require Layer 2 across nodes and this simplifies stretching the cluster.
● When deploying the NDO service, 3 primary nodes are needed, but the system can survive the failure of 1 ND primary node to be fully operational. However, even if two primary nodes are lost, the system allows to promote a standby node if this is available. For more information, see the procedure as described in the section Failure Scenarios and Impacts.
In the case of a stretched Nexus Dashboard cluster across multiple AZs deployed as a physical form factor, to maximize resiliency, we recommend deploying an ND standby node in the site with a single ND primary node.
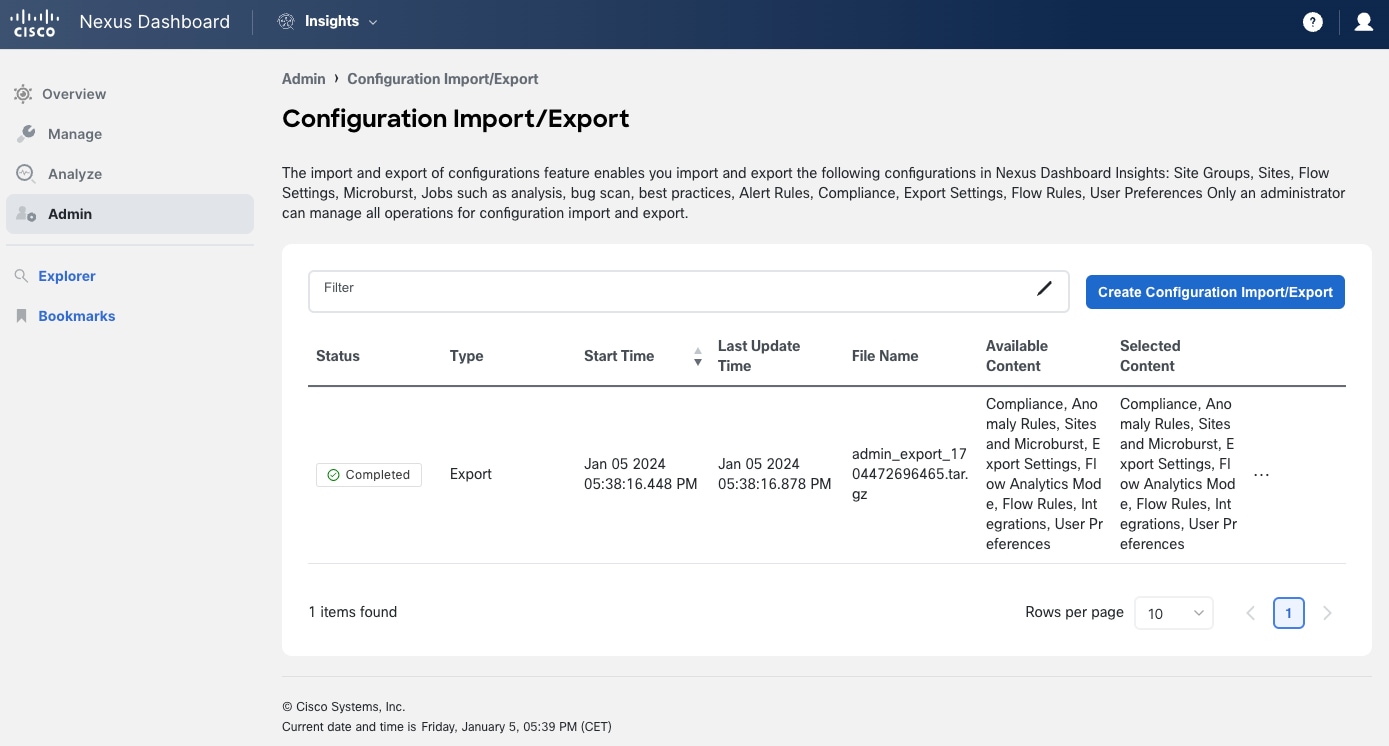
Figure 17 Nexus Dashboard cluster across multiple AZs deployed as a physical form factor
A standby node allows you to replace in very short time a faulty node limiting any impact to the HA in a single failure scenario, or the operations in case of a double failure scenario.
If the cluster is deployed as a virtual form factor, the placement of a standby node does not provide the same benefit as per a physical one. You can deploy a virtual Nexus Dashboard node in a short time, ensuring minimum delay to restore full system resiliency. However, in a double failure scenario, for example with the loss of Availability Zone A in the figure above, a standby node is required to restore the cluster.
Recommendation: In a distributed deployment, we recommend having a standby node for failing over to the standby node as soon as one or two primary node failure occurs.
Currently NDO limits the editing of templates that are deployed to non-reachable fabrics. This means that if a fabric is unreachable from NDO (for example in the case of a disaster where fabric A in the figure above is lost), templates affecting this fabric can’t be edited until the fabric connectivity is restored.
The table below shows the best practices for deploying ND cluster nodes in a distributed environment with multiple site options running the NDO service. P# represents a primary node. S# represents a standby node.
| Number of Sites/Placement of nodes |
1 |
2 |
3 |
4 |
| 1 |
P1,P2,P3 |
|
|
|
| 2 |
P1,P2 |
P3,S1 |
|
|
| 3 |
P1 |
P2 |
P3 |
|
| 4 |
P1 |
P2 |
P3 |
S1 |
Recommendation: As the NDO service does not benefit from adding secondary nodes, neither from a scale nor from a resiliency perspective, we recommend not deploying secondary cluster nodes.
NDI and NDFC
Both NDI and NDFC services tolerate the loss of a single ND primary node. A single cluster node loss can be restored by failing over to a standby node.
If a single primary node failure happens, Nexus Dashboard may experience a short temporary disruption of services while the platform rebalances its resources. Services will run in degraded state and will try as best effort to support all functions.
Recommendation: We recommend restoring the failed node as soon as possible to restore high availability and to avoid loss of data following an eventual double primary node failure.
Restoring a single primary node can be achieved by either failing over the failed node to a standby node if available, or to replace it with a spare green field node running the same Nexus Dashboard version.
NDI and NDFC services do not support the loss of two primary nodes. Platform and services would suffer a complete disruption. The UI and API would not be accessible and services cannot be restored, and as a result you must reinstall the services.
In the case of the loss of two primary nodes, the ND platform can be restored only if there is a standby node by accessing the CLI of the remaining primary node using the rescue-user and manually failing over the failed nodes to the standby node. The procedure is described in the section Double node failure. When two primary nodes are lost, NDI and NDFC services would suffer complete data loss and even if the platform is restored, they must be reinstalled. If a backup exists, configuration of those services can be restored, but for NDI historical data and collected statistics will be lost.
Secondary nodes may provide an increase of scale for services; however secondary nodes do not provide direct resiliency increases, as the ND platform core pods run on primary nodes.
Loss of secondary nodes are tolerated, and services remain operational, but, as resources decrease, performance would degrade until the cluster size is restored by replacing the faulty node.
Note: Losing secondary nodes may destabilize the system for a short period of time as services must rebalance across the remaining nodes. This implies possible slowness of the system in terms of responsiveness.
We recommend adding secondary nodes as per scalability user requirements as defined in the ND Capacity Planning tool. We also recommend restoring failed secondary nodes as soon as possible to restore full cluster capability.
When running NDI and NDFC, as there would be no increased resiliency by distributing the cluster, the recommendation is to deploy NDI as a centralized Nexus Dashboard cluster. This architecture is simpler and more resilient as in cases of inter-AZ communication loss, there will be no impact to the cluster.
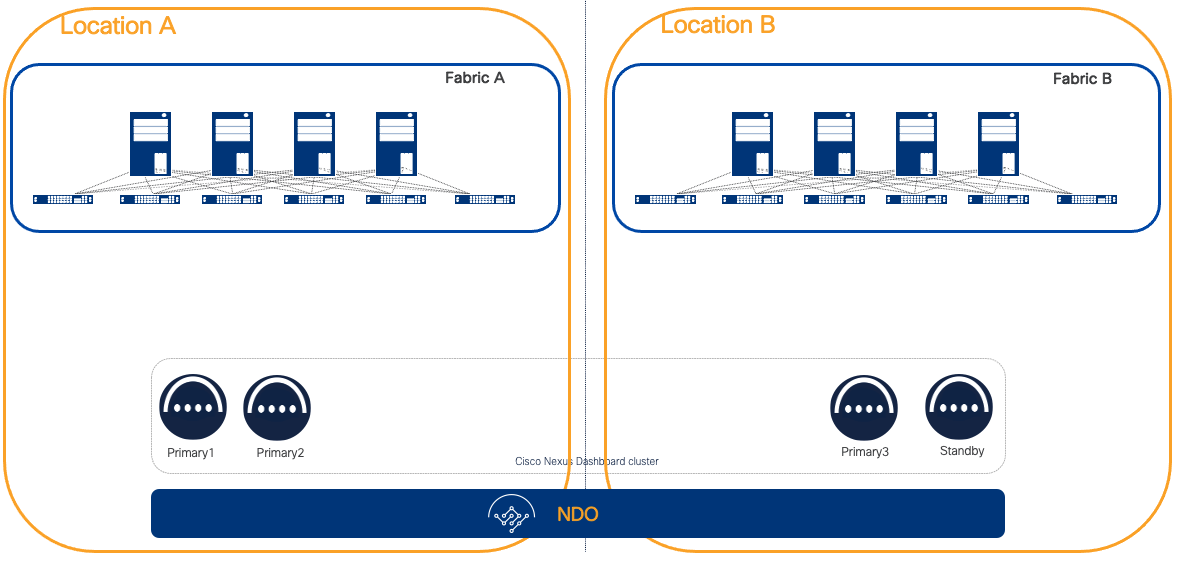
Figure 18 NDI deployed as a centralized ND cluster
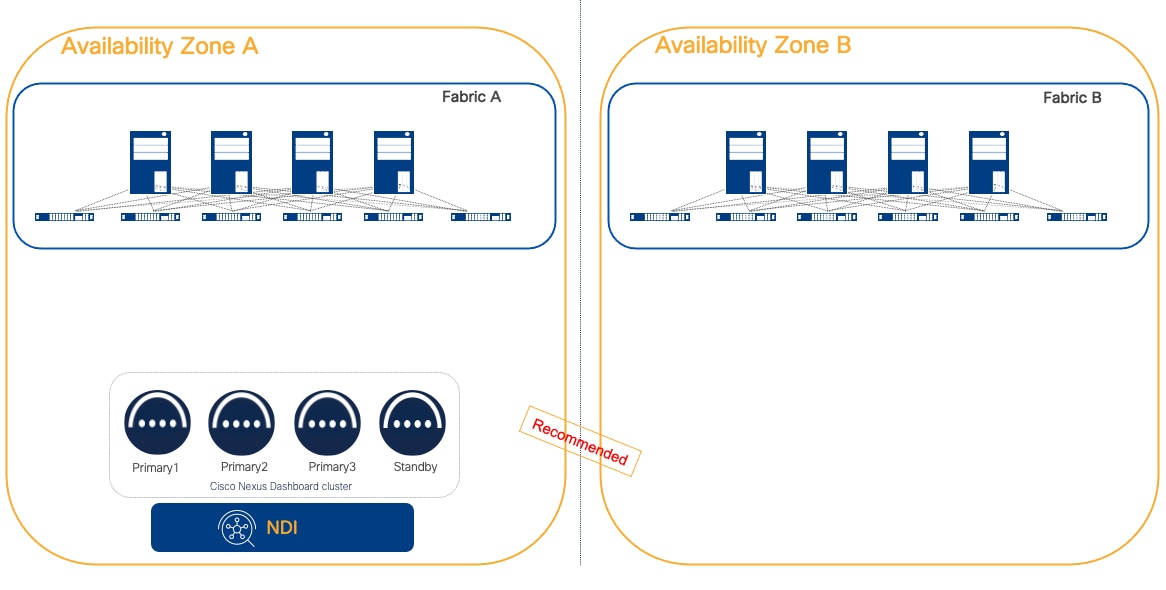
Figure 19 NDFC deployed as a centralized ND cluster
As the loss of two primary nodes would not be tolerated and would require reinstalling the services, we highly recommend restoring a single primary faulty node as soon as possible. This would limit any risk to lose data. To facilitate this process, we always recommend using a standby node for physical form factor-based clusters, thereby speeding up the failover of a faulty node. The alternative would be to Return Material Authorization (RMA) the faulty node, which would certainly be more time-consuming and extend the system’s inoperability (for a primary node fault) or reduction of performance (in case of a secondary node fault).
NDI and NDO
If NDI and NDO are needed in a multi-fabric design, the recommendation is to deploy two different ND clusters, each dedicated to one service:
● Physical or virtual ND cluster for NDI
● Physical or virtual ND cluster for NDO
The choice of physical or virtual is mainly based on the fabric scale requirements.
By deploying dedicated platforms for NDI and NDO, it would be possible to place the ND nodes as per best practices:
● Distributed deployment for NDO
● Centralized deployment for NDI
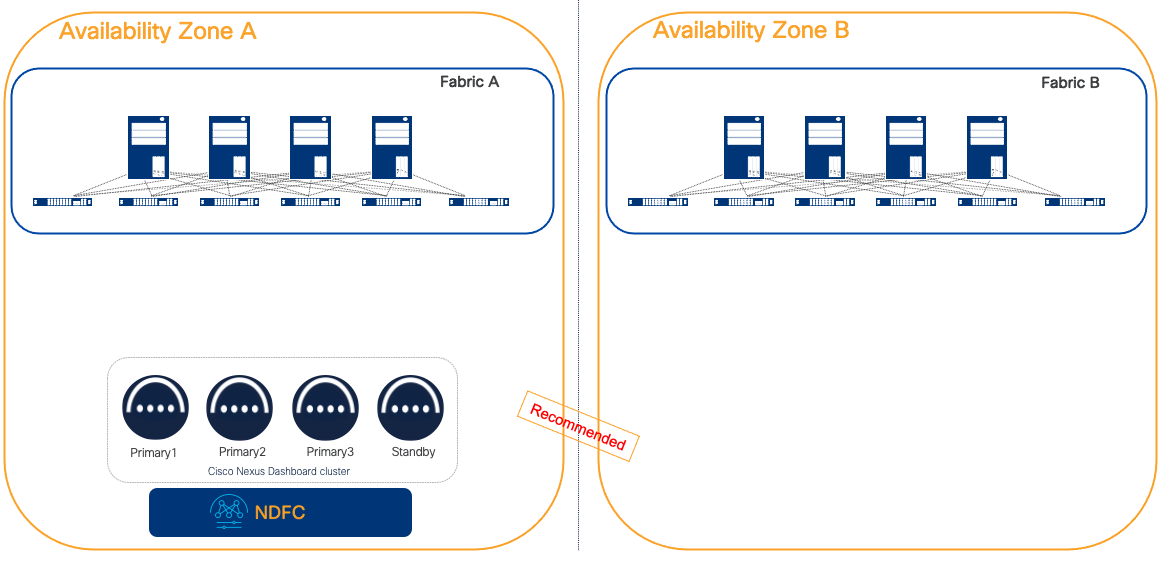
Figure 20 NDI deployed as a centralized cluster and NDO deployed on a separate distributed cluster
Cohosting NDI and NDO services on the same ND cluster is a sub-optimal design either for one or the other service. In fact, the general recommendation for NDO is to place it on a distributed cluster while the general recommendation for NDI is to place it on a centralized cluster.
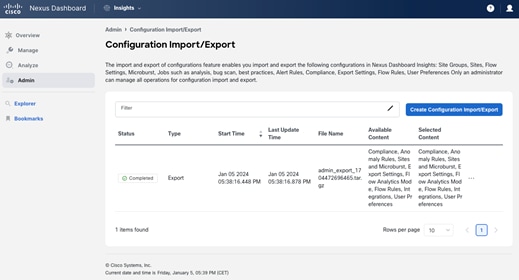
Figure 21 One NDI centralized dedicated cluster per fabric and NDO deployed on a separate distributed cluster
For a very large-scale deployment that is not supported by a single NDI cluster, we recommend placing different NDI clusters in different AZs. Similarly, if the fabrics are geographically distant and RTT latency is above the supported thresholds.
For convenience, the table below describes the RTT requirements for ND cluster node connectivity.
Table 1 RTT requirements for Nexus Dashboard
| Application |
Connectivity |
Maximum RTT |
| Nexus Dashboard |
Between nodes within a cluster |
50 ms |
| Nexus Dashboard Multi-Cluster connectivity |
Between nodes across clusters that are connected via multi-cluster connectivity |
500ms |
| Nexus Dashboard Orchestrator |
To sites |
For APIC sites: 500 ms For NDFC Sites: 150 ms |
| Nexus Dashboard Insights |
To switches |
150 ms |