On-premises Managed Nexus One Cisco Nexus Dashboard At a Glance
Available Languages
Bias-Free Language
The documentation set for this product strives to use bias-free language. For the purposes of this documentation set, bias-free is defined as language that does not imply discrimination based on age, disability, gender, racial identity, ethnic identity, sexual orientation, socioeconomic status, and intersectionality. Exceptions may be present in the documentation due to language that is hardcoded in the user interfaces of the product software, language used based on RFP documentation, or language that is used by a referenced third-party product. Learn more about how Cisco is using Inclusive Language.
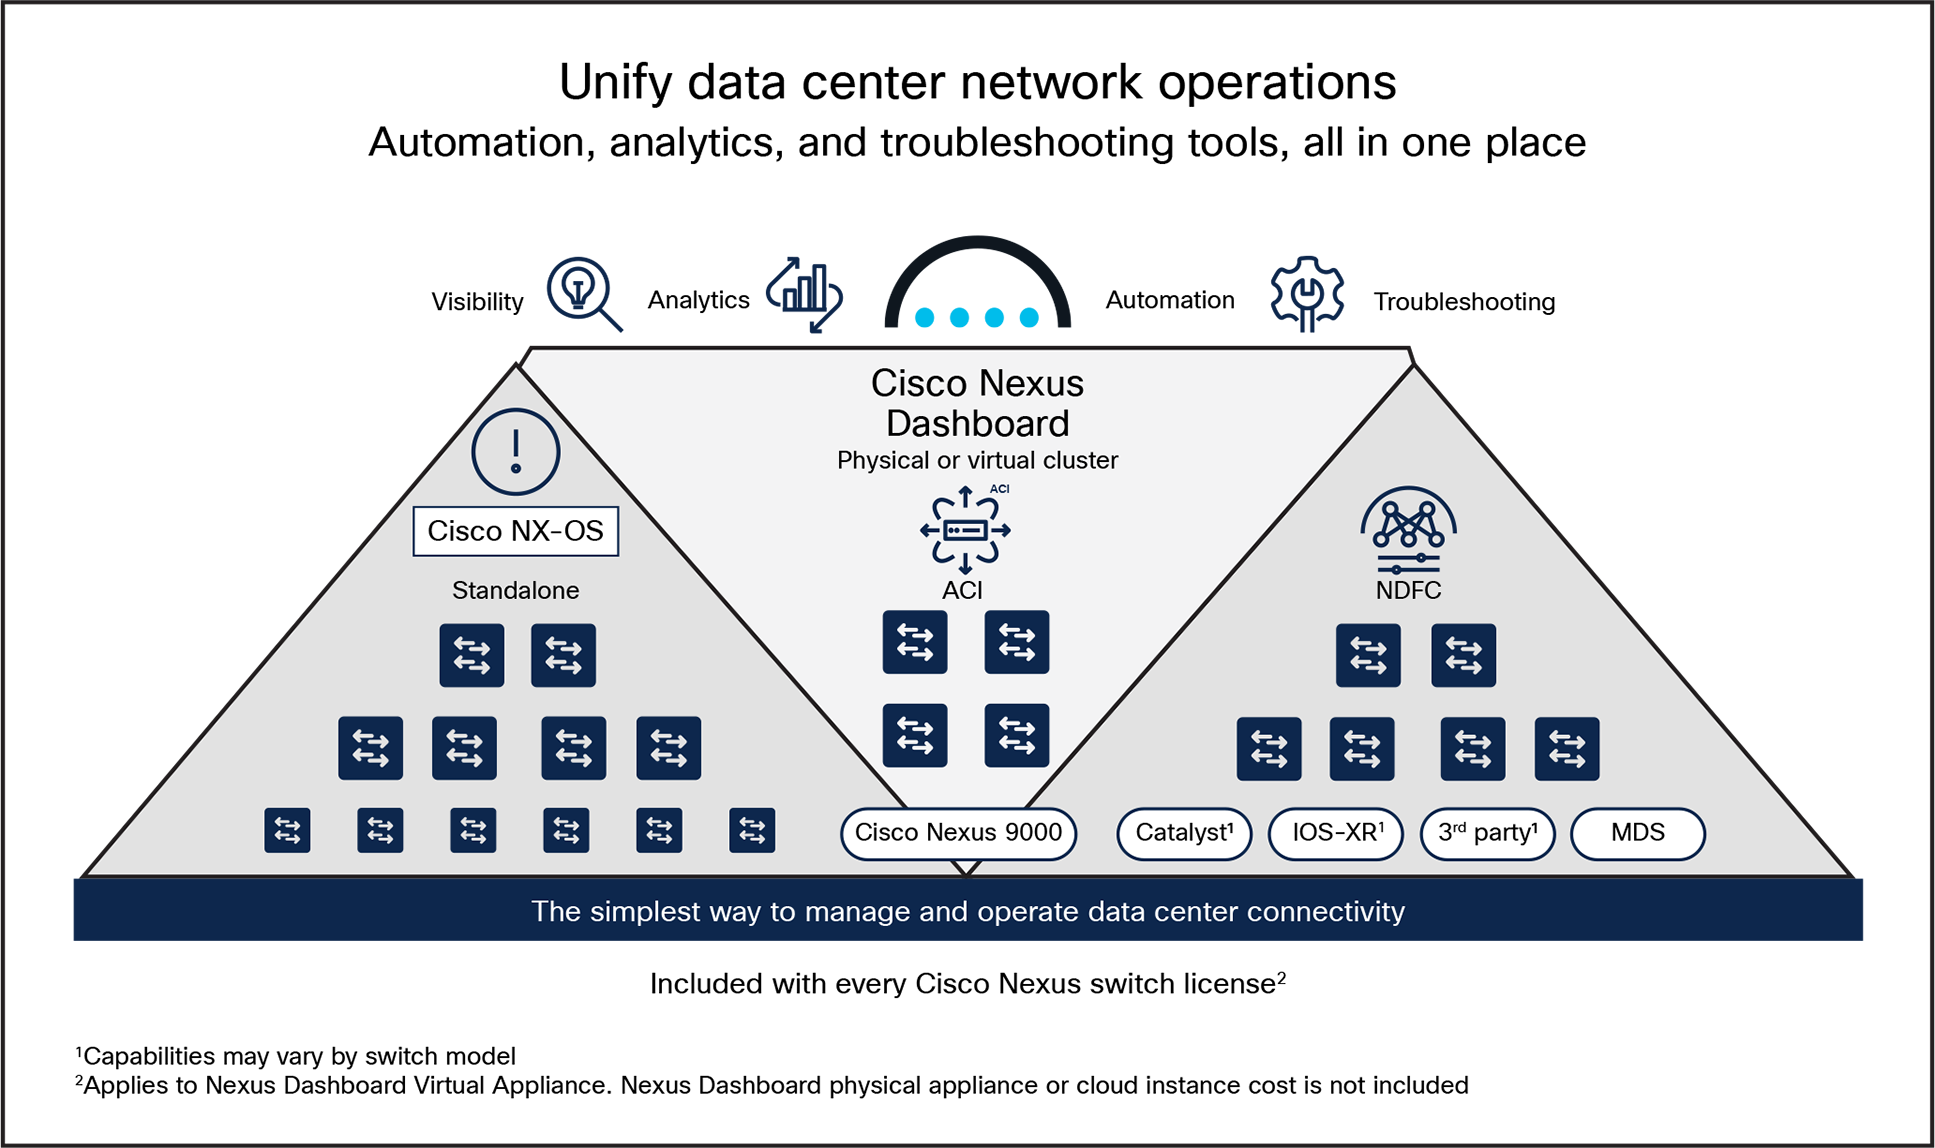
Cisco Nexus® Dashboard is the on-premises management plane for Cisco Nexus One. It streamlines data-center networking through powerful automation and analytics. Modern data-center networks are critical to meeting business demands, and organizations need to deploy reliable networking services quickly and consistently. Yet managing today’s infrastructure is increasingly complex—distributed environments, diverse platforms, multiple configuration and monitoring tools, and massive volumes of real-time data all add to the operational burden. Nexus Dashboard brings these elements together to simplify operations and enhance visibility across the entire network.
Cisco Nexus Dashboard
Benefits of Cisco Nexus Dashboard
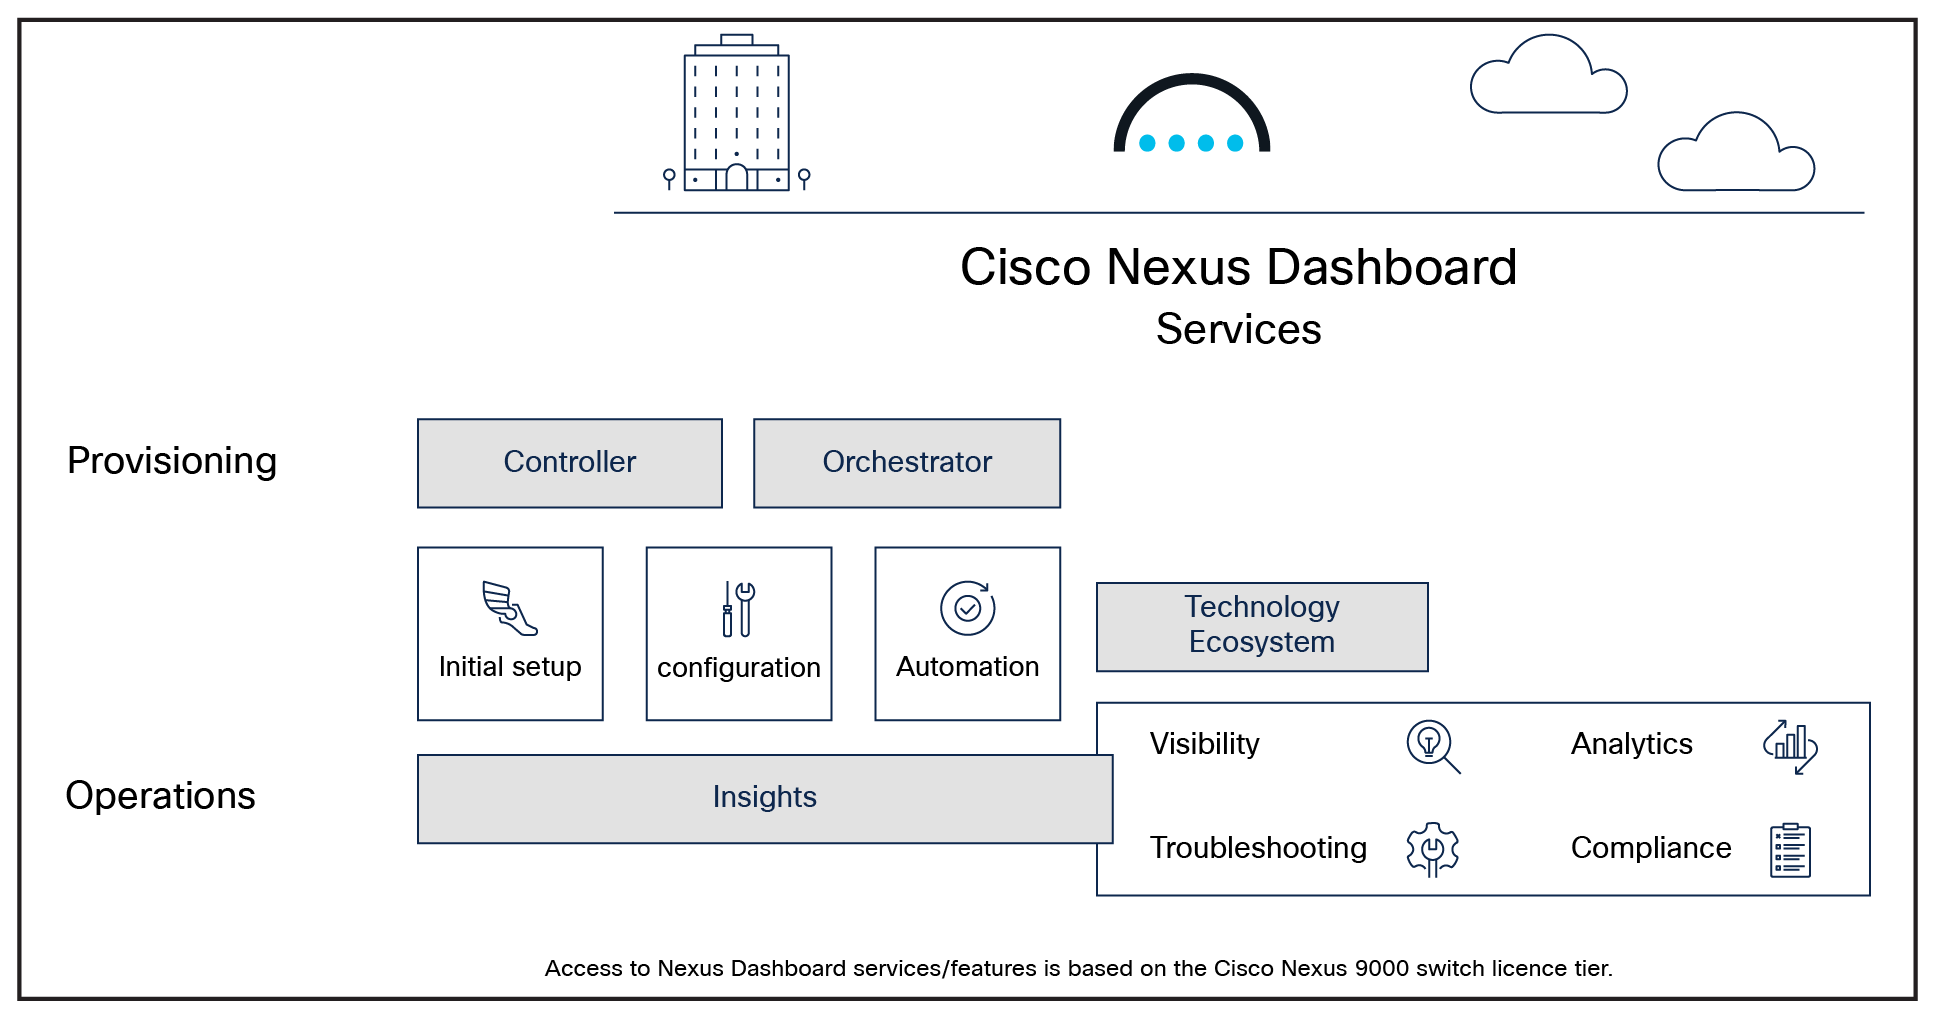
Cisco Nexus Dashboard is a comprehensive management platform that transforms data center network operations and automation. With its unified approach and cutting-edge features, it delivers unparalleled efficiency and control. Here’s how it can benefit your network:
● Cisco Nexus One architecture: Cisco Nexus Dashboard is the on-premises operational model in Cisco Nexus One. Cisco Nexus One is a transformative, open, unified networking architecture that integrates silicon, systems, software, and a single operating model with security and observability fused at every layer.
● Common policy: data, control, policy, and management plane across Cisco NX-OS VXLAN EVPN and Cisco ACI fabrics. Ensures consistent operations, segmentation, L4–L7 service insertion, and interoperability across data-center fabrics, enabling innovation and lower TCO.
● Unified Fabric Management: Seamlessly manage Cisco ACI, NX-OS, IOS-XE and SONiC fabrics through a single platform, delivering a consistent and cohesive operational experience.
● AI-Driven Intelligence: Maximize AI network performance with Cisco Intelligent Packet Flow, and advanced analytics to accelerate troubleshooting.
● Streamlined Operations: Simplify workflows and improve efficiency with an intuitive interface, robust automation tools, and Infrastructure-as-Code (IaC) capabilities for accelerated deployments.
● Enhanced Visibility and Sustainability: Gain actionable insights into network performance, avoid unplanned outages, discover energy usage, costs, and emissions, with recommendations to optimize uptime and minimize environmental impact.
● Digital Resilience and Innovation: Ensure compliance, faster connectivity, and operational assurance across environments with built-in automation, resilience capabilities, and integration with tools like Splunk®.
● AgenticOps Excellence: Cisco Cloud Control streamlines troubleshooting across Cisco infrastructure with intelligent, automated, multi-agent operations—from data-center tasks to advanced AI workloads.
Cisco Nexus Dashboard is the key to unlocking the full potential of your data center networks, ensuring optimized performance and operational excellence.
Unified operations with Cisco Nexus One
Customer and partner quotes
“Nexus Dashboard streamlines our architecture deployment and fuels our expansion strategy with crucial insights to minimize downtime for consumers.”
Nathan Litz,
Lead Network Architect of Advanced Technology Center, WWT - View WWT story
Deliver next-gen live broadcasting
“Cisco developed NBM and I think it’s a perfect way of running an IP infrastructure for broadcast. It’s a non-blocking infrastructure with mechanisms to protect flow policies.”
Yannick Olivier, Broadcast Engineer
France TV - View France TV story
Connect fans worldwide
“The Nexus platform allows us to scale out to faster speeds and bandwidth. It also lets us utilize higher buffer rates to ensure that all of our data—whether it’s storage, video, voice, or audio—is sent seamlessly throughout our network.”
Ralph Riley, Director, Broadcast IT Systems
WWE - View WWE story
“Together, Cisco and Panduit help our joint customers build resilient, energy efficient, and high-performance data centers.
Our collaboration has grown beyond network infrastructure to the strategic area of power and sustainability.
We have partnered with Cisco to streamline data from our intelligent PDU (iPDU) into Sustainability Insights on Cisco Nexus Dashboard. We are dedicated to driving greater visibility into sustainability innovations with Cisco, enabling customers to monitor and forecast their future energy needs, costs, as well as carbon emissions through our integration with Cisco Nexus Dashboard.”
Holly Garcia,
VP Data Center, Panduit
Cisco Nexus Dashboard software is included with all Cisco N9000 Series Switch tiered-license purchases.
● Learn more about Cisco Nexus Dashboard.
● Try Cisco Nexus Dashboard today.
● Learn more from the Cisco Nexus Dashboard data sheet and ordering guide.
● Cisco Nexus One Solution Overview