Cisco Nexus Dashboard Insights for the Data Center Data Sheet
Available Languages
Bias-Free Language
The documentation set for this product strives to use bias-free language. For the purposes of this documentation set, bias-free is defined as language that does not imply discrimination based on age, disability, gender, racial identity, ethnic identity, sexual orientation, socioeconomic status, and intersectionality. Exceptions may be present in the documentation due to language that is hardcoded in the user interfaces of the product software, language used based on RFP documentation, or language that is used by a referenced third-party product. Learn more about how Cisco is using Inclusive Language.
In this era of digital transformation and business resiliency, continuous innovation is critical for organizations to succeed, and experiencing downtime along the way is not an option. Users increasingly demand more features and better usability, reliability, and environmental sustainability from the applications they use.
The network plays a huge role in meeting such demands, and provisioning reliable data-center and cloud-networking services as fast as possible, when and where organizations need them, is a must. However, network infrastructure management is becoming more complex, diverse, and distributed, with multiple configuration points, monitoring tools, and vast amounts of data being generated every second (Figure 1).
Cisco Nexus Dashboard software does not require an additional license and it is included with all Cisco Nexus 9000 switch tiered-license purchases. Cisco Nexus Dashboard provides a single focal point to unite disparate network configurations and views of multiple switches, data centers, and clouds (Figure 2). Through its Insights service, network operators can now accelerate time to resolution and preserve compliance in their networks by leveraging years of Cisco knowledge hosted on Nexus Dashboard’s analytics engine.
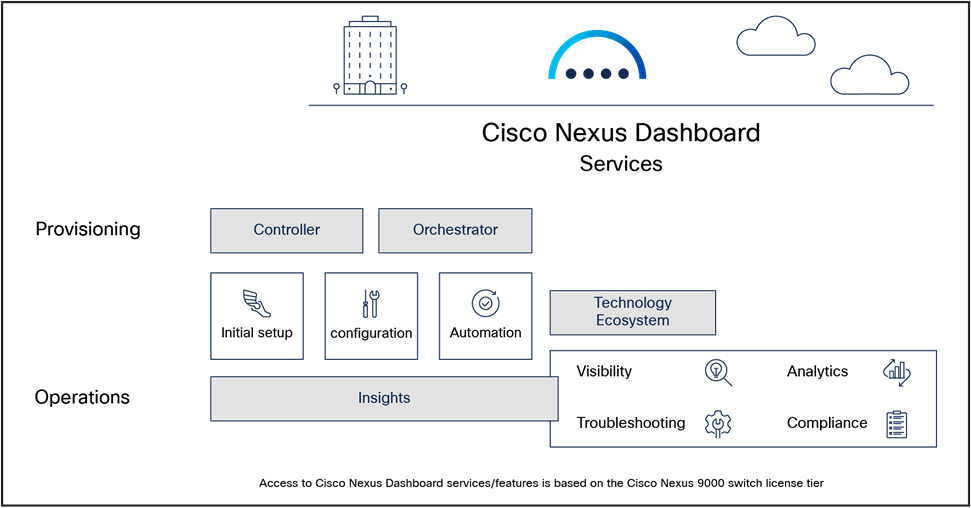
Cisco Nexus Dashboard and services
Cisco Nexus Dashboard Insights supports Cisco® Application Centric Infrastructure (Cisco ACI®), standalone Cisco NX-OS switches, and networks with Cisco Nexus Dashboard Fabric Controller (NDFC). It is a microservices-based service natively hosted on Cisco Nexus Dashboard.
The operational intelligence engine of Cisco Nexus Dashboard Insights incorporates a set of advanced alerting, baselining, correlation, and forecasting algorithms to provide deep insights into the behavior of the network by utilizing telemetry data obtained from networking and compute components.
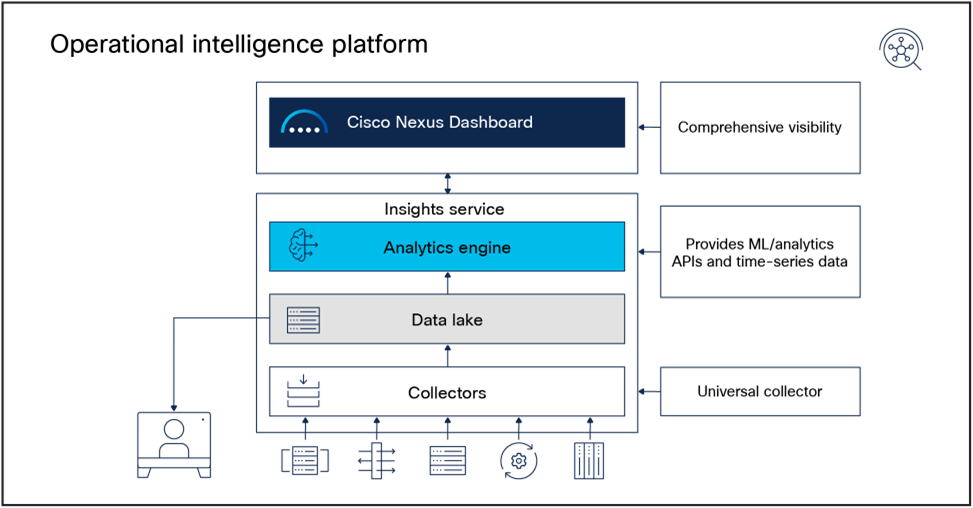
Cisco Nexus Dashboard: Operational intelligence engine
Cisco Nexus Dashboard Insights accelerates troubleshooting and helps rapid root-causing and early remediation. Compliance rules keep the network state aligned with operator intent. It simplifies audits and ensures compliance while also helping infrastructure owners comply with SLA requirements for their users.
Nexus Dashboard provides a cluster of compute nodes that are horizontally scalable. The sizing and number of compute nodes required for Nexus Dashboard Insights depends on the number of sites, the number of switches in each site, and the workflows per second that the users want the application to support.
Cisco Nexus Dashboard Insights features and benefits
Table 1. Features and benefits
| Feature |
Benefit |
| Multisite support |
Use a single instance of Cisco Nexus Dashboard Insights to monitor, maintain, and troubleshoot multiple data-center sites. |
| Global view |
View and monitor the health of multiple fabrics distributed across multiple Cisco Nexus Dashboard clusters from a single point of control. |
| Mixed fabric ISN/IPN support |
Onboard standalone NXOS switches (ISN/IPN) with ACI fabrics. |
| Time-series database |
Gather evidence from past data. Peek back in time to look at a specific sequence of events and gather intelligent insights. |
| Anomalies |
Proactively monitor network health over time by using time-synced data across multiple parameters to derive deeper understanding of issues and behaviors. Know the impacted endpoints, applications, and flows due to network anomalies. Customize anomaly thresholds to your network needs. |
| Anomaly correlation |
Reduce manual troubleshooting by auto-correlating network anomalies to determine single root cause for faster remediation. |
| Anomaly advanced search |
Accelerate root-cause diagnosis by searching specific endpoints or objects and see all associated anomalies in the network. |
| Assurance |
Ensure intended configurations managed by Cisco Application Policy Infrastructure Controller (APIC), Cisco NDFC, or Cisco Nexus Dashboard Orchestrator (NDO) are deployed across your environment. |
| Traffic analytics |
Learn about services running in your fabric (web, file transfer, storage, etc.) and monitor their latency, congestion, and drops over time. |
| Flow analytics |
Use Flow Telemetry (FT) and Flow-Telemetry Events (FTEs) to minimize troubleshooting time through automated root-cause analysis of data-plane anomalies, such as packet drops, latency, workload movements, routing issues, ACL drops, and more. Monitor flow-rate usage to optimize FT performance. |
| L4-L7 traffic visibility |
Track end-to-end flows across externally connected devices such as firewalls, to help locate data-plane issues across device silos and deduce the locations of packet drops. |
| AI/ML and storage traffic congestion detection |
Gain visibility into RoCEv2 traffic congestion and performance over time with ECN and PFC counters. |
| Remote storage |
Collect evidence of network innocence for audits by exporting and storing flow-telemetry JSONs in external servers. |
| NetFlow collector |
Maintain business continuity by having backward compatibility with legacy protocols. |
| Search and Explore |
Quickly locate objects across sites when troubleshooting issues. Explore policy to network associations and connectivity across multiple sites to understand the state of network deployment using powerful natural-language queries. |
| Connectivity analysis |
Verify software and hardware programming consistency across all available traffic paths between source and destination endpoints. Track per-hop information and behavior. |
| Compliance |
Automatically enforce your IT governance and security policies in the network by establishing golden configuration and communication rules. |
| Pre-change analysis |
Avoid network disruption when changing configurations by predicting the impact of the intended changes before deploying. |
| Delta analysis |
Narrow down what network changes occurred between two points in time and quickly identify network health, configuration, and resource changes. |
| Upgrade assist |
Perform 40+ checks prior to upgrades and detect changes in configuration or operational state before and after switch upgrades. |
| Microburst detection |
Expose and locate invisible microbursts. Find out congestion hot spots and protect application performance. |
| AppDynamics® and VMware vCenter integrations |
Break operational silos between network and server teams. Gain cross-domain visibility and rapidly troubleshoot with qualitative and quantifiable data. Know the application geography and layout through the mapping of application topology to physical topology. |
| Multicast control plane |
Use detailed statistics and state information of PIM, IGMP, and IGMP-snooping protocols to monitor multicast control plane health. |
| Multicast traffic visibility |
Gain visibility into multicast sources, groups, receivers, switches, and traffic rates to monitor state and accelerate troubleshooting. |
| Sustainability |
Optimize energy consumption and costs per site on a device level and measure carbon footprints across your energy sources. |
| Real-time telemetry |
Reflect new events, changes and/or anomalies for interfaces, telemetry collection status, and hardware statistics in near real-time. |
| Routing table |
View routing table changes at fabric and switch level, including next hop and historical details. |
| Resource utilization |
Provide efficient capacity planning to maintain top network performance. Get fabric-wide visibility of resource utilization and historical trends. Detect components exceeding capacity thresholds ahead of time. For example, TCAM, routes, ACL entries, ports, tenants, VRFs, and EPGs. |
| TCAM utilization |
Manage TCAM capacity resources and security policy with advanced utilization analysis. |
| Hardware resources |
Proactively monitor and report hardware-related anomalies by leveraging telemetry data from sensors such as CPU, memory, disk, power supply, fan speed, and temperature. |
| Statistics |
Use detailed data-plane statistics to diagnose, locate, and remediate issues. Monitor and use protocol anomalies and state information to remediate BGP, vPC, LACP, CDP, and LLDP problems. |
| Endpoints |
Locate virtual machines, bare-metal hosts, and other endpoints in the data-center fabric. Use historical data to track their movements. |
| Topology view |
Use your natural visuo-spatial ability to explore, navigate, discover, and zoom into issues. Perform rapid troubleshooting using filters to focus on problematic nodes. |
| Customizable dashboards |
Create custom views to monitor high priority parameters of your choice. |
| Advisories |
Get notified on PSIRTs, bugs, field notices, and EoS/EoL announcements. Take necessary action to stay secure and compliant and prevent unscheduled outages. |
| Software and hardware conformance |
Minimize risk of running End-of-Sale (EoS) or End-of-Life (EoL) devices. View current and project the future status of network software and hardware inventory against known EoS/EoL notices to plan for upgrades. |
| Scale conformance |
Automatically ensure that deployments are within recommended scale limits to minimize potential outages. |
| Cisco Technical Assistance Center (TAC) support |
Automate the mundane, repetitive tasks of log collection and attach them to TAC Service Requests (SRs). Delegate additional log collection to the TAC team and free yourself from dull work. |
| Messaging support |
Share Cisco Nexus Dashboard Insights’ enriched, value-added output with the application ecosystem through Kafka or syslog. Build synergetic workflows with third-party IT applications. |
| Email notification |
Get offline alerts about network health using the email-notification facility. Pick and choose which issues you need to be alerted about. |
| Air-gap support |
Utilize Insights’ anomaly and advisory features to better identify network health and infrastructure risks for air-gapped sites. |
| Reporting |
Export anomaly and advisory summaries through email and PDFs. Download content as PDF via Brower Print and Save. |
| Product-usage telemetry |
Enabled by Cisco to significantly improve product lifecycle management for IT teams that have deployed Cisco data-center fabrics. These data and related insights proactively identify product issues, improve services and support, and activate discussions to glean additional value from new and existing features. |
Table 2. Hardware platform support
| Feature |
Cisco Nexus 9300/9500/9700 EX/FX/FX2/FX3/GX series switches |
Cisco Nexus 7000 Series Switches*** |
Cisco Nexus 3000 Series Switches*** |
| Multisite |
Yes |
Yes |
Yes |
| Global view |
Yes |
Yes |
Yes |
| Mixed fabric ISN/IPN support |
Yes |
No |
No |
| Time-series database |
Yes |
Yes |
Yes |
| Anomalies |
Yes |
Yes |
Yes |
| Anomaly correlation |
Yes |
Yes |
Yes |
| Anomaly advanced search |
Yes |
Yes |
Yes |
| Assurance |
Yes |
No |
No |
| Traffic analytics |
Yes* |
No |
No |
| Flow analytics (FT/FTE*) |
Yes* |
No |
No |
| L4-L7 traffic visibility |
Yes |
No |
No |
| AI/ML storage traffic visibility |
Yes (Cisco NX-OS only) |
No |
No |
| Remote storage |
Yes* |
No |
No |
| NetFlow collector |
Yes |
Yes |
Yes |
| Search and Explore |
Yes |
No |
No |
| Connectivity analysis |
Yes |
No |
No |
| Compliance |
Yes (Cisco ACI only) |
No |
No |
| Pre-change analysis |
Yes (Cisco ACI only) |
No |
No |
| Delta analysis |
Yes |
No |
No |
| Upgrade assist |
Yes |
No |
No |
| Microburst detection |
Yes** |
No |
No |
| AppDynamics |
Yes |
No |
No |
| VMware vCenter |
Yes |
Yes |
Yes |
| Multicast control plane |
Yes |
No |
No |
| Multicast traffic visibility |
Yes (Cisco NX-OS only) |
No |
No |
| Sustainability |
Yes |
No |
No |
| Real-time telemetry |
Yes |
Yes |
Yes |
| Routing table |
Yes |
No |
No |
| Resource utilization |
Yes |
Yes |
Yes |
| TCAM utilization |
Yes (Cisco ACI only) |
No |
No |
| Hardware resources |
Yes |
Yes |
Yes |
| Statistics |
Yes |
Yes |
Yes |
| Endpoints |
Yes |
No |
No |
| Topology view |
Yes |
Yes |
Yes |
| Customizable dashboards |
Yes |
Yes |
Yes |
| Advisories |
Yes |
Yes |
Yes |
| Software and hardware conformance |
Yes |
No |
No |
| Scale conformance |
Yes |
No |
No |
| Cisco Technical Assistance Center (TAC) support |
Yes |
Yes |
Yes |
| Messaging support |
Yes |
Yes |
Yes |
| Email notification |
Yes |
Yes |
Yes |
| Air-gap support |
Yes |
Yes |
Yes |
| Reporting |
Yes |
Yes |
Yes |
Cisco Nexus Insights Cloud Connector
Cisco Nexus Insights Cloud Connector is a prepackaged application with all Cisco data-center platforms to automatically connect and transmit product usage data to Cisco. All product-usage telemetry data is transmitted to Cisco through an encrypted channel.
The Cisco Nexus Insights Cloud Connector (Cisco NI Cloud Connector) application provides customers with the benefit of faster time to remediation with Cisco Technical Assistance Center (TAC) functionalities along with automatic, secure collection of tech-support logs. Cisco Nexus Insights Cloud Connector will empower IT teams to provide inventory reports of license entitlement, upcoming renewals, and proactive defect notifications, along with lifecycle management support from integrated Cisco Customer Experience (CX) programs.
The categories of data collected are limited to product usage. For details about the product usage telemetry information that is collected, please see the table below.
Table 3. Product usage telemetry
| Category |
Data elements |
Purpose of collection |
| Cisco.com |
● Cisco.com user ID
|
Identify customer account |
| System |
● Controller and device information (Cisco APIC/Cisco Data Center Network Manager [DCNM]/NDFC switch/appliance serial number, type, software versions, platform ID)
● Operational metrics – (including CPU, memory, file system, and uptime) for deployed fabric components
|
Identify potential device issues in customers’ environments to prevent problems and improve the product |
| Feature usage |
● Number of fabrics created, number of leaf nodes, spine nodes, border nodes, number of IP subnets, routing protocols in use, and fabric and switch-level capacity
● Number of tenants/contracts/endpoints/endpoint groups/etc. (Cisco ACI), access lists/hosts/VLANs/etc. (Cisco NX-OS/DCNM/NDFC), virtual networks, features enabled, and feature scale
|
Facilitate customer adoption and customer value |
| License entitlement |
● License-entitlement information (network device type, IP address of network device, Cisco Smart Software Manager registration status, Cisco ACI and NX-OS license information, number of days until license expires)
● Signed EULA flag
|
Assist customers in tracking and maintaining license entitlement and renewals |
For information on Cisco data protection and privacy, please refer to the following:
https://www.cisco.com/c/en/us/about/trust-center/data-protection-and-privacy.html.
Users can also choose to opt out of the data collection of product-usage telemetry by switching off the device connector in their specific data-center platforms. For further information, please refer to the Cisco Nexus Insights Cloud Connector configuration guides.
Cisco Nexus Dashboard Insights
● Minimum supported release for Cisco ACI APIC controller is 4.2(5) and for Cisco ACI switch software is 14.2(5).
● Minimum supported release for Cisco NX-OS DCNM/NDFC controller is 11.4 and for Cisco NX-OS 9000 and 3000 managed switches software is 7.0(3) I7(6) in the 7 train and 9.3(2) in the 9 train.
● Minimum supported release for Nexus 7000 managed by Cisco DCNM/NDFC is 8.4.
● Minimum supported release for standalone NX-OS Nexus 9000 switches software is 7.0(3)l7(6), 8.4(2).
● Please refer to the product compatibility matrix by clicking here for detailed information.
Cisco Nexus Insights Cloud Connector
● Supported with Cisco ACI APIC controller releases 3.2(9), 4.2(4), and beyond. Minimum supported release for Cisco NX-OS DCNM controller is 11.3.1.
● Please refer to the latest configuration guides and release notes by clicking here for detailed information.
The Cisco Nexus Dashboard Insights service run on Cisco ACI and NX-OS/NDFC–based deployments, and have the following installation requirements:
● Starting with Cisco Nexus Dashboard Insights Release 5.1, the Cisco Nexus Dashboard platform is required to host the Cisco Nexus Dashboard Insights service. This is applicable for Cisco ACI, NX-OS, and Cisco NDFC–based fabrics.
How to get access to Cisco Nexus Dashboard Insights
● Cisco Nexus Dashboard Insights service is included as part of the Cisco Data Center Networking (DCN) Essentials, Advantage and Premier licenses. Please refer to the Data Center Subscriptions page for more details.
● For a more detailed overview on Cisco licensing, go to
https://www.cisco.com/c/en/us/products/collateral/data-center-analytics/nexus-dashboard/guide-c07-744361.html.
● Contact your Cisco account team to learn pricing and additional details.
See the Ordering Guide for Nexus Dashboard Insights to learn how to get access to the platform details.
Flexible payment solutions to help you achieve your objectives
Cisco Capital® makes it easier to get the right technology to achieve your objectives, enable business transformation and help you stay competitive. We can help you reduce the total cost of ownership, conserve capital, and accelerate growth. In more than 100 countries, our flexible payment solutions can help you acquire hardware, software, services, and complementary third-party equipment in easy, predictable payments.
Learn more.
| New or Revised Topic |
Described In |
Date |
| Global View Mixed Fabric ISN/IPN Support Anomaly Correlation Search and Explore Routing Table |
September 2024 |