Configuring IW Monitor Statistical Settings

Changing the Interval at which Statistical Data is Logged

Procedure


Step 1

Click Settings in the top right corner.

A new settings page is shown.

Step 2

Click .

A new statistics settings page is shown.
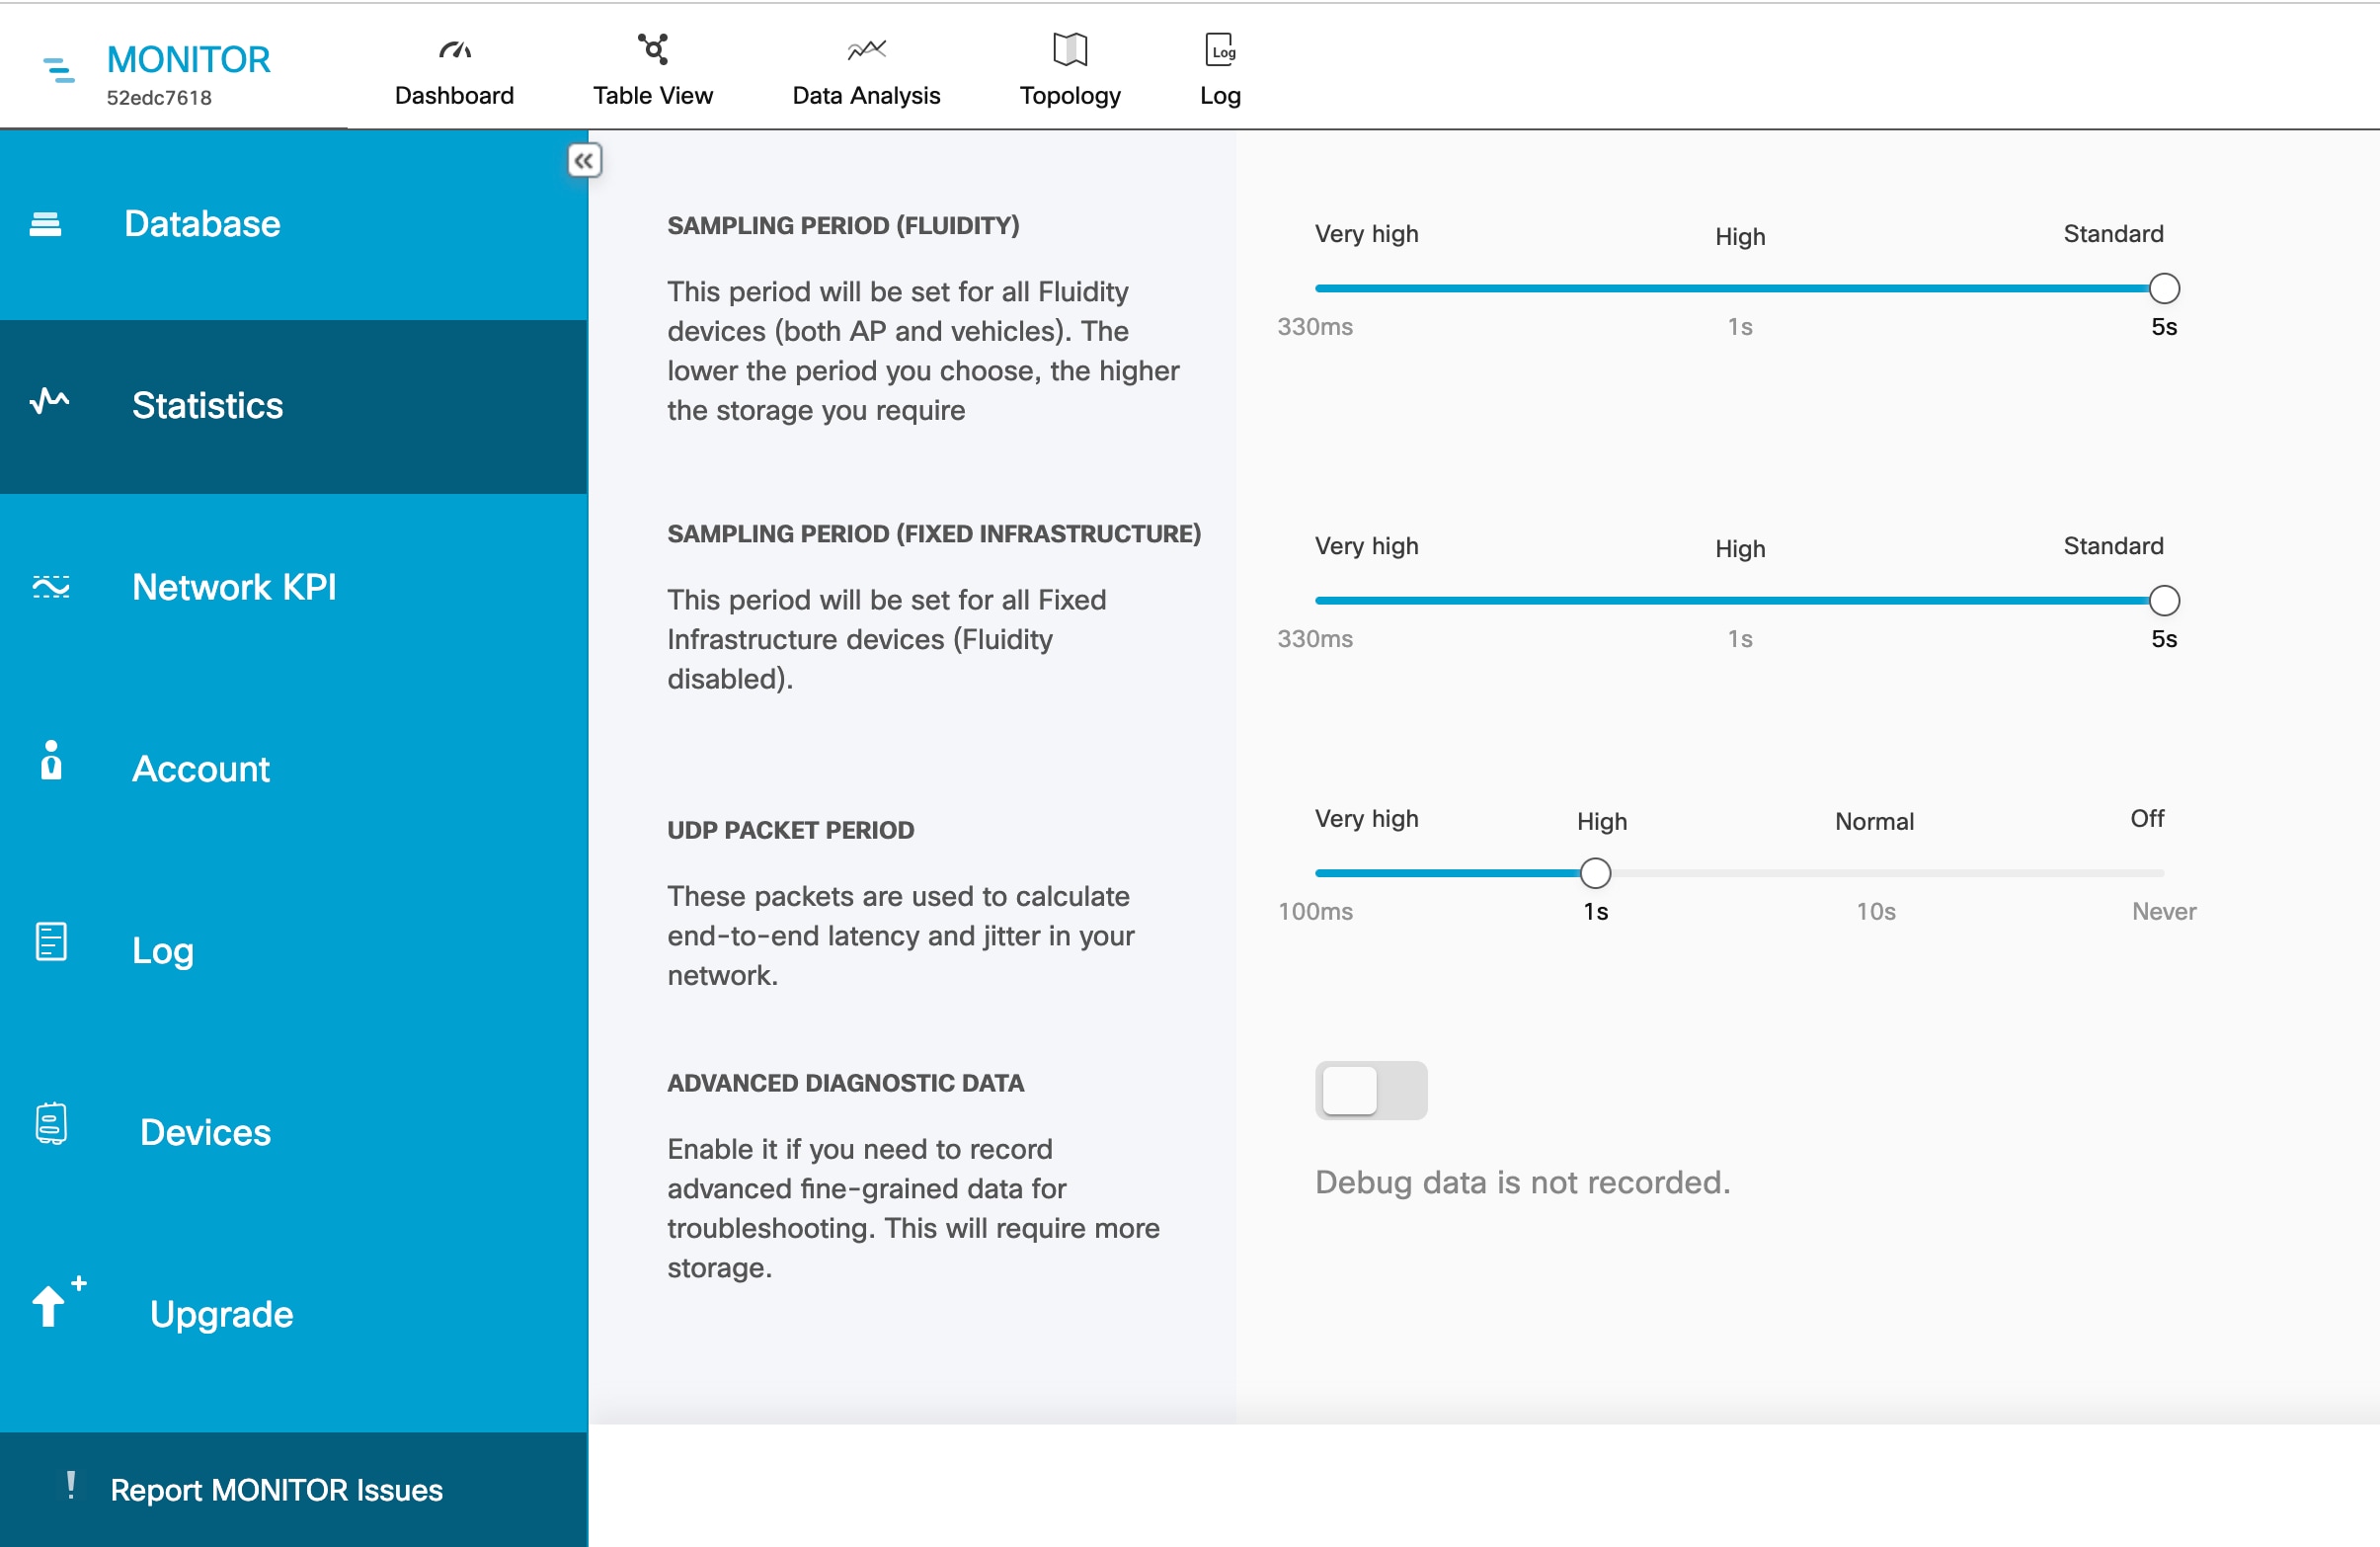
Step 3

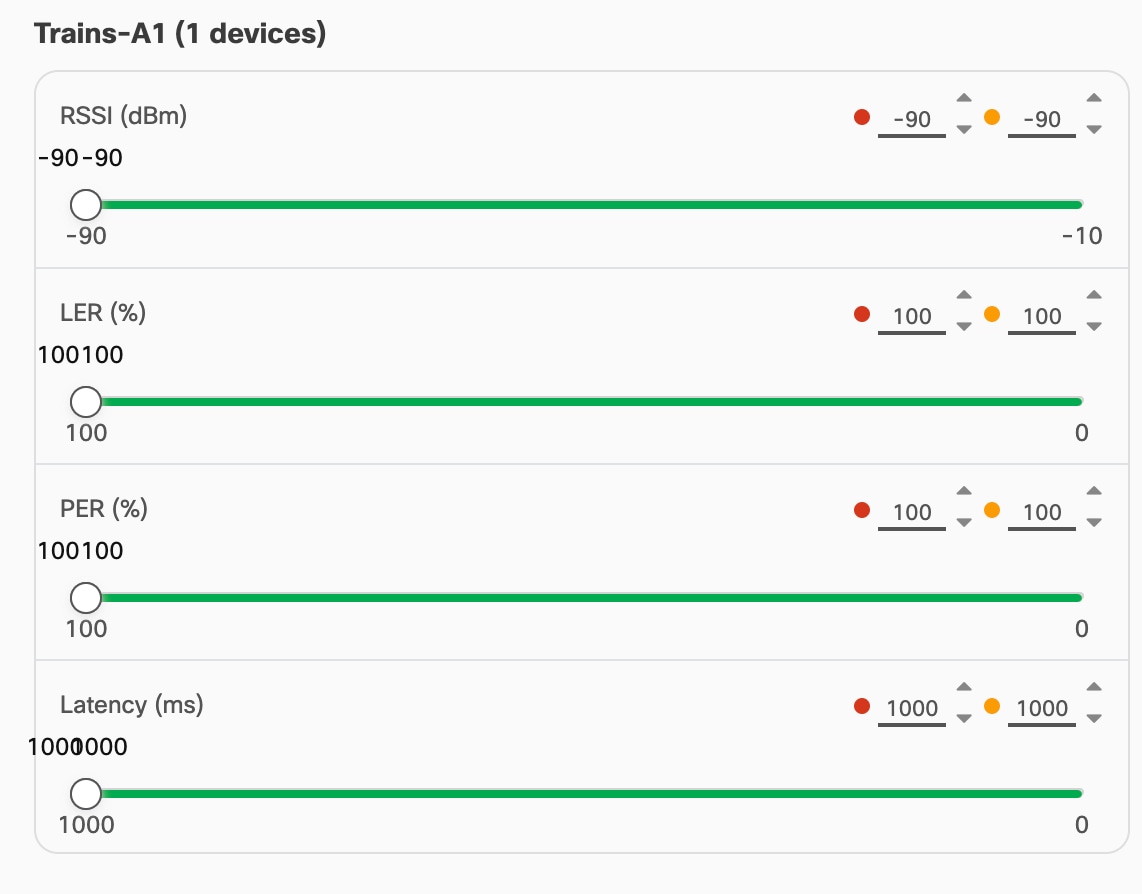
To change the time interval at which statistical data is logged, click-and-drag the SAMPLING PERIOD (Fluidity devices) slider and/or the SAMPLING PERIOD (Fixed infrastructure) slider.
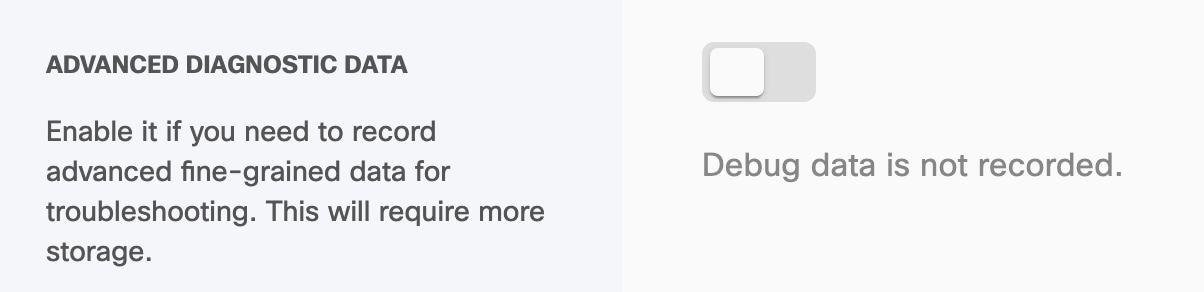
The recommended data-logging frequency intervals are:
  • 330 ms (Fluidity)

  • 5 s (Fixed)

Note

 
Logging data at a higher-than-normal frequency increases the rate at which the IW Monitor database occupies the hard disk space.
  • Higher data-logging frequency gives a more detailed statistical log with less possibility of missed errors.

  • Lower data-logging frequency uses less hard disk space.

Step 4

To collecting debugging data:
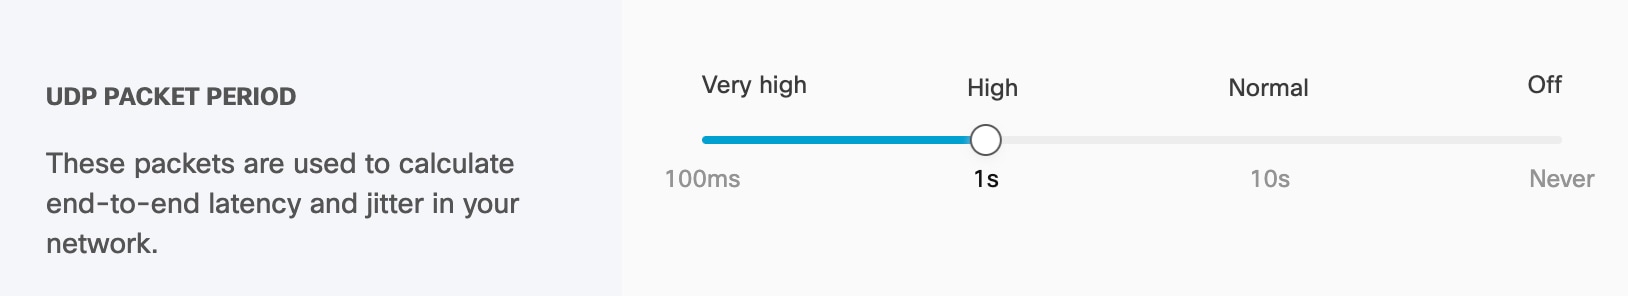
  1. Enable ADVANCED DIAGNOSTIC DATA to log debugging data for quicker and more advanced technical support.

Step 5

To increase the accuracy with which the IW Monitor host calculates network latency and jitter:

  1. Click-and-drag the UDP PACKET PERIOD slider.

  2. To disable the UDP packet transmission, click-and-drag the UDP PACKET PERIOD slider to Off.

    The higher UDP packet frequency sampling gives more accurate latency and jitter readings, and the lower UDP packet frequency sampling helps reduce network congestion.

    Note


    The minimum interval at which UDP packets are sent is every 100 ms, and the maximum interval at which UDP packets are sent is every 10 s.


Customizing Event-Logging Settings

Procedure


Step 1

Click Settings in the top right corner.

A new settings page is shown.

Step 2

Click .

The log settings page is shown.

Step 3

Enable the Log Storage toggle.

Step 4

Enable the Remote Syslog to collect the system logs remotely.

A new screen with Remote Syslog settings appears.
  1. Fill the remote syslog server IP address, port, and change the settings based on the requirement.

Step 5

Click-and-drag the LOGGING LEVEL slider based on the required logging level.

The four logging levels are:

  • Trace - Trace-level events are considered trivial, but can be useful for diagnostic troubleshooting.

  • Info - Info-level events are normal system events. This is the default event display level.

  • Warning - Warning-level events are those that have a potentially negative impact on system performance, and should be addressed as soon as practically possible.

  • Critical - Critical-level events are those that have an immediate, negative impact on system performance and/or system integrity, and should be addressed immediately.

Step 6

In the Event section, check and uncheck the type of events you want to log.

All network event types are grouped into one of the following categories:
  • Users account management

  • RADIUS events

  • Devices credentials

  • Network events/failures

  • Settings

  • Device management

  • Configuration changes

  • Network performance

  • License management

  • Database

  • System

  • Titan (Fast-Failover)

  • Ethernet Port

Step 7

Click Save Changes.


Setting Performance Thresholds

Procedure


If you want to apply the same performance-alert thresholds to all sections that are part of the network, adjust the performance thresholds by doing the steps that follow:

Each performance threshold slider has two buttons that can be clicked and dragged.

  1. Click-and-drag the left-side button to set the lower performance threshold. If the relevant parameter falls below this threshold, the relevant Status icons will turn red.

  2. Click-and-drag the right-side button to set the upper performance threshold. If the relevant parameter falls below this threshold, the relevant Status icons will turn yellow.

If radio signal strength, link error rate, packet error rate or network latency drop below the specified levels, the Status icons of individual devices in the table view shows the relevant status.


Setting Performance Thresholds for Each Section

To apply different performance thresholds to different sections of the network, follow these steps:

Procedure


Step 1

Click Settings in the top right corner.

A new settings page is shown.

Step 2

Click .

The network KPI settings page is shown.

Step 3

Enable the PERFORMANCE CHECK switch to On.

The default thresholds section is shown.

Step 4

Make sure that the current network is partitioned into two or more sections. To know more on how to partition the network into sections, see Creating a new Section.

Step 5

If the network is partitioned, tabs are created for each network section under Global Thresholds sliders as shown below:

Step 6

Select the network section for which you want to alter the performance thresholds.

A separate group of performance-alert threshold sliders will be shown for the specified network section. For more information about thresholds, see Setting Performance Thresholds.

Step 7

Click-and-drag the sliders to adjust the performance-alert thresholds for the specified network.

Step 8

Repeat the steps above for all network sections.