Monitoring Mobility Express Network

Viewing Network Summary

The Monitoring service enables the primary AP to monitor the Cisco Mobility Express network.

Monitoring Dashboard

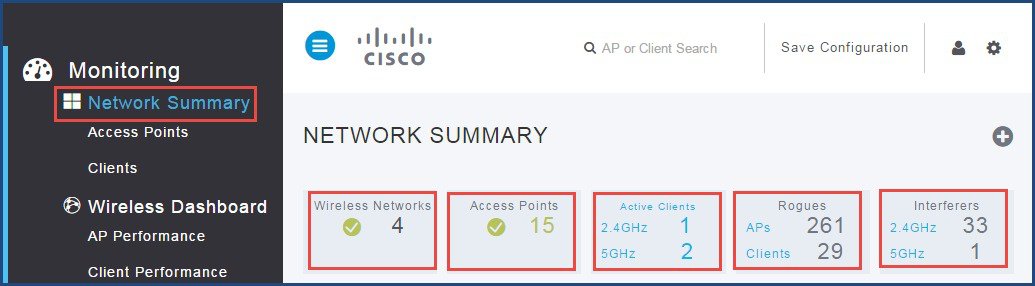
The monitoring dashboard of the Network Summary page displays count of the following:

  1. Wireless Networks

  2. Access Points

  3. Active Clients in 2.4 GHz and 5GHz

  4. Rogues AP and Clients

  5. Interferers


    Note

    Rogues and interferers are not clickable link. Only the count is displayed.


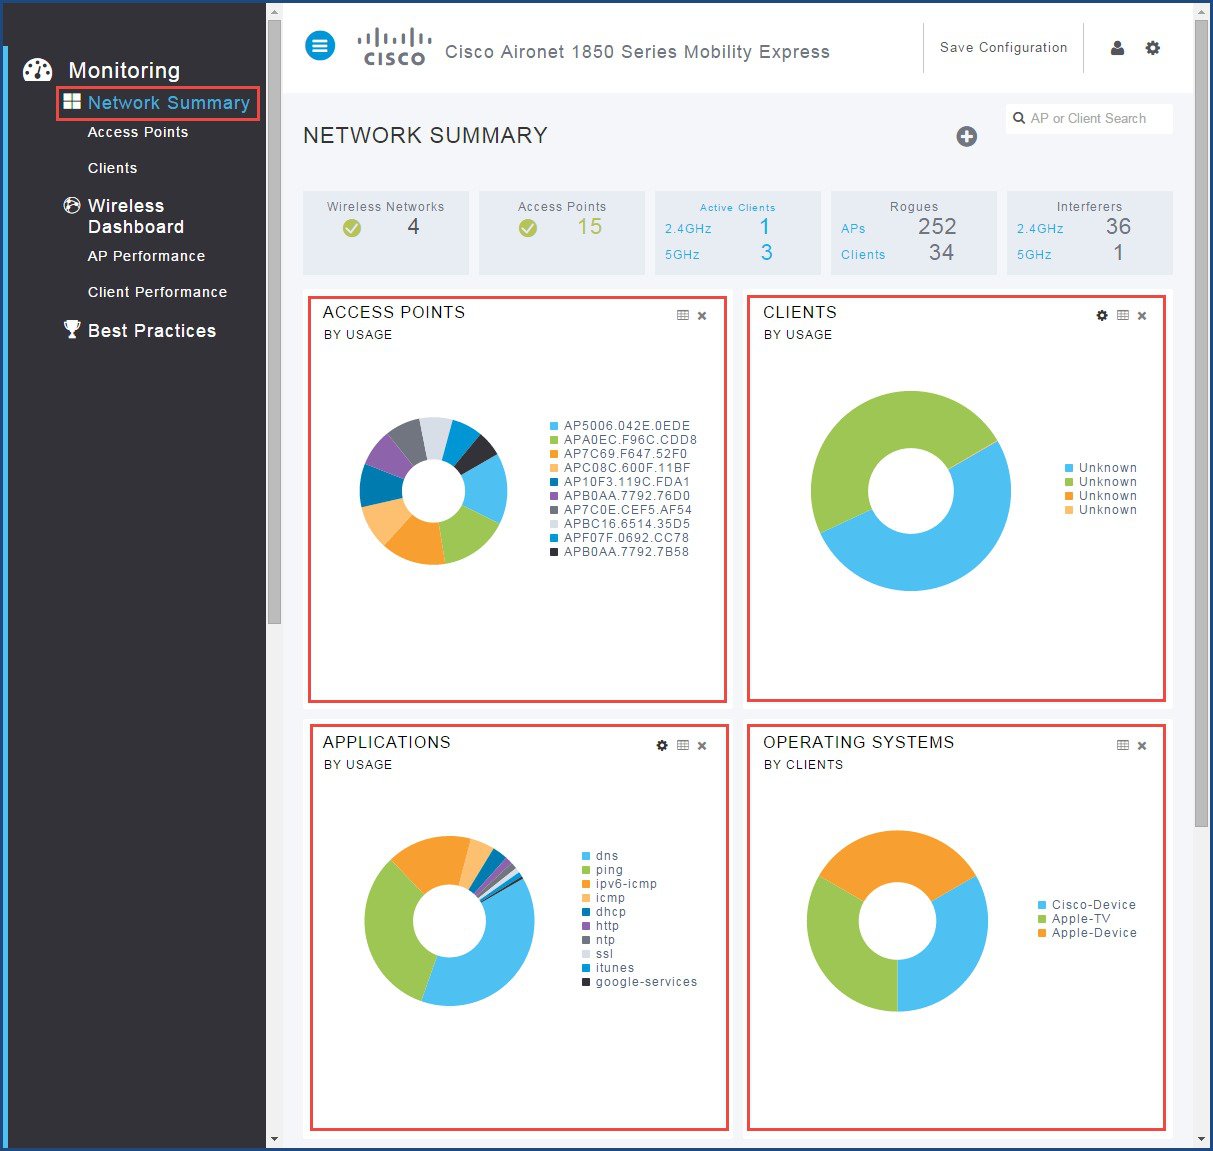
The Network Summary page has five customizable widgets representing data in both tabular and graphical formats for the following:

  1. Access Points (by usage)

  2. Clients (by usage)

  3. Applications (by usage)

  4. Operating System (by clients)

  5. Top WLANs (by usage)


Note

The widgets under Network Summary shows aggregate data for the wireless network.


View Access Points Summary using GUI

To view access points using GUI, perform the following steps:

Procedure


Step 1

Click Monitoring > Network Summary > Access Points .

A table displays the list of Access Points.
Step 2

Toggle between 2.4 GHz and 5 GHz tabs to view a list of the access points operating at respective radio frequencies.

Step 3

(Optional) Click the down arrow on the top right of the column header to select columns to be hidden or shown in the table view. Hide or show desired fields or to filter the table view based on desired parameters.


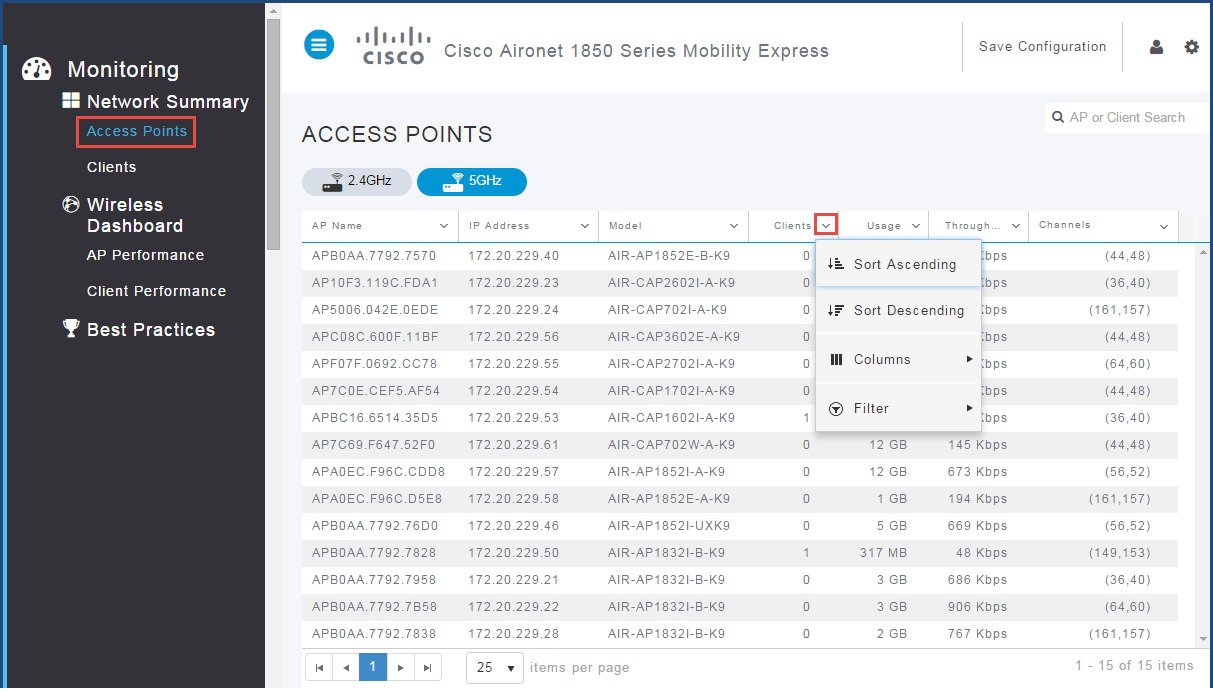
View Access Points Summary using CLI

To view access point summary using CLI, perform the following steps:

Procedure


Enter the following command to display a summary of all access points associated to the primary AP:

show ap summary 

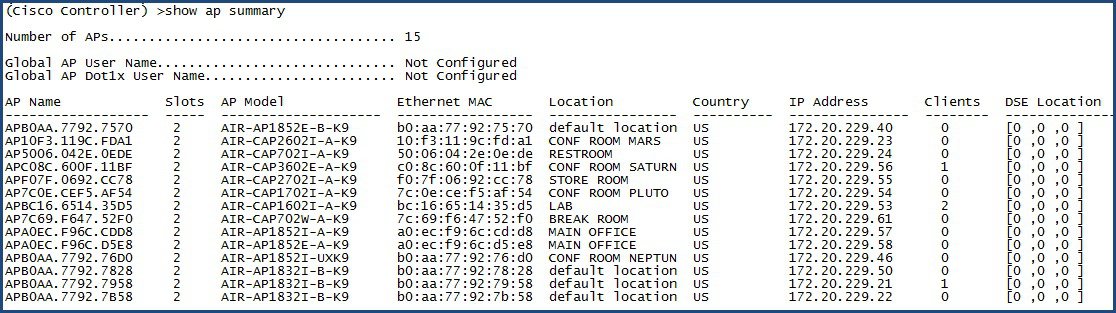
View Access Point Details using GUI

To view access point details using GUI, perform the following steps:

Procedure


Step 1

Click on any of the Access Points from the list to see detailed information about the AP. The default tab is the RF Troubleshoot tab, displays the following information:
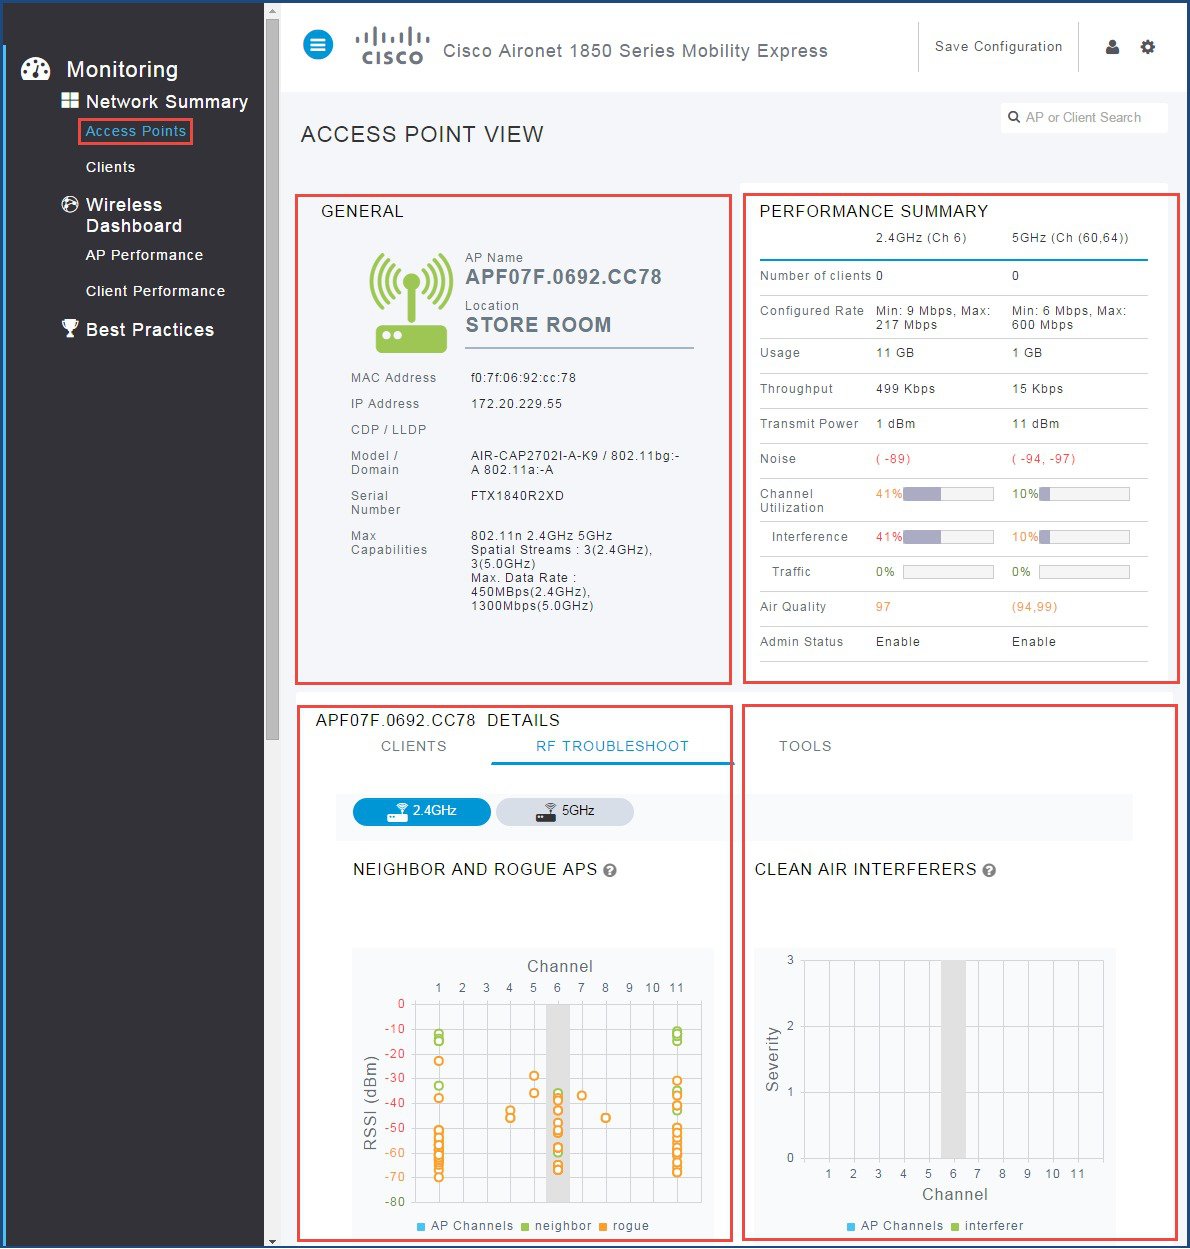
  1. General AP Parameters

  2. Performance Summary of the two radios (2.4 GHz and 5 GHz)

  3. Neighbor and Rogue APs

  4. Clean Air Interferers

  5. Client Distribution by Usage

  6. Client Distribution by and Data Rates

Step 2

Click Tools to restart the AP or clear the AP configuration.


View Access Point Details using CLI

To view access points using CLI, perform the following steps:

Procedure


Step 1

Enter the following command to view the access points:

show ap <option> 
Step 2

Enter the following command to restart the AP:

(Cisco Controller) >config ap reset <Cisco AP>  

View Client Summary using GUI

To view client summary using GUI, perform the following steps:

Procedure


Step 1

Click Monitoring > Network Summary > Clients.

Step 2

(Optional) Click the down arrow on the top right of the column header to select columns to be hidden or shown in the table view.

Hide or show desired fields or to filter the table view based on desired parameters.


View Client Summary using CLI

To view client summary using CLI, perform the following steps:

Procedure


Enter the following command to display a summary of all access points attached to the Mobility Express network:

show client summary

Viewing Wireless Dashboard

The Wireless Dashboard provides details of AP and client performance.

Viewing AP Performance

The AP Performance dashboard helps the user to identify and troubleshoot the issues in the Mobility Express.


To access AP Performance dashboard, choose Monitoring > AP Performance.

The AP Performance dashboard displays the following charts:

  • Channel Utilization Top APs—Level of traffic including data and interference over the channel that is assigned on the AP. Interference includes both Wi-Fi and non Wi-Fi signals. High utilization of channel, for example above 50%, suggests high level of interference including noise from nearby APs/clients/rogues on the same channel which results in poor client performance.

  • Client Load TOP APs—Load indicator displays current number of connected clients on each access point. Higher load may impact performance, using client load balancing you can improve client distribution on the wireless network.

  • Interference Top APs—RF interference involves unwanted, interference of RF signals that disrupt normal wireless operations, that creates potential network latency and poor client performance. Interfering RF signals includes both Wi-Fi and non Wi-Fi signals.

  • Coverage BOTTOM APs—Coverage holes are areas where clients cannot receive a signal from the wireless network. A coverage hole is considered to have occurred when client SNRs falls below a predetermined level. A coverage hole event is when several clients are stuck in the same coverage hole.

Viewing Client Performance

The Client Performance dashboard helps the users to determine the cause of connection failure to the Mobility Express network and troubleshoot client related issues.

To access Client Performance dashboard, choose Monitoring > Client Performance.

The Client Performance dashboard displays the following charts:

  • Signal Strength—Strong signal strength results in more reliable connections and higher speeds. Signal strength is represented in -dBm format, ranges from 0 to -100dBm. The closer the value to 0, the stronger the signal. Click to get a summary of clients.

  • Connection Rate—Each client's throughput varies depending on the data rate used (802.11 a/b/n/ac) at any time, and this data rate may vary every second. Various factors such as RSSI values, RF interference, and so on, may affect a client device's instantaneous data rate.

  • Signal Quality—Signal-to-noise ratio (SNR) is the power ratio between the signal strength and the noise level. This value is represented as a +dBm value. In general, you should have a minimum of +25dBm signal-to-noise ratio. Lower values than +25dBm result in poor performance and speed.

  • Client Connections—Shows clients associated with the access points, of any connectivity types.